MySQL monitoring tools can help you identify potential issues with your database, continuously check your database instances, improve performance, and detect and alert you about real-time issues.
But choosing the right MySQL monitoring tool can be daunting. How do you know which one is right for your application stack?
Top MySQL Monitoring Tools at a Glance
Here is a list of the top 11 MySQL monitoring tools that can help you keep your MySQL database instances in fine health:
| Tool Name | Why Use for MySQL Monitoring | Pricing |
|---|---|---|
| SigNoz | - OpenTelemetry-native and opensource - Out of the box MySQL dashboard templates - Integration with managed MySQL services such as AWS RDS | Free (self-hosted). Cloud pricing starts at $49/month |
| Prometheus | - Opensource - Supports multi-target patterns - Database performance metrics | Free |
| Oracle Enterprise Manager | - Automated database discovery and fixes - Query Analyzer to identify slow-running queries - Standardize monitoring and compliance across databases | Custom pricing |
| Paessler PRTG | - Automatically queries databases - Customizable alerts and notifications - Custom database reports | Starts at $179/month for 500 sensors |
| Sematext | - Automated database discovery - Application and database performance metrics in split view - Custom alert rules for deviations in metrics | $2.8/month/host |
| SolarWinds | - Supports various deployment environments - Real-time alerts and root cause diagnostics - Tracks MySQL performance metrics, query execution times, and resource utilization | Starts at $117/database/month |
| Dynatrace | - Automated end-to-end tracing - AI-driven diagnostics - Visualization for application interaction with MySQL server | $0.08/hour for an 8 GiB host |
| Datadog | - 850+ vendor-backed integrations - Live and historical query snapshots, wait event analysis, and query explain plans - Tracks key MySQL metrics | Starts at $70/database/month |
| New Relic | - Tracks critical MySQL performance metrics - Detailed visibility into slow queries - Real-time notifications for anomalies or performance issues | Starts at $0.35/GB for ingestion |
| ManageEngine | - Intelligent forecasting reports - Monitors key metrics - Notifications for anomalies or threshold violations | Starts at $395/year for up to 10 monitors |
| Splunk | - Leverages OpenTelemetry - AI/ML-driven features - Full-fidelity monitoring with no data sampling | Starts at $15 per host/month |
SigNoz - Monitoring MySQL with OpenTelemetry
SigNoz is an open-source unified observability tool that can also help you monitor MySQL databases. With SigNoz, you can monitor your entire software system and track application and infrastructure metrics. Given its high-performance columnar storage for low-latency querying at scale, SigNoz is especially suited to monitoring modern cloud-native applications based on microservices and serverless architecture.
Why Use SigNoz for MySQL Monitoring
As an open-source APM tool that monitors all your services and their multiple database instances, SigNoz can monitor the performance of database calls from every service.
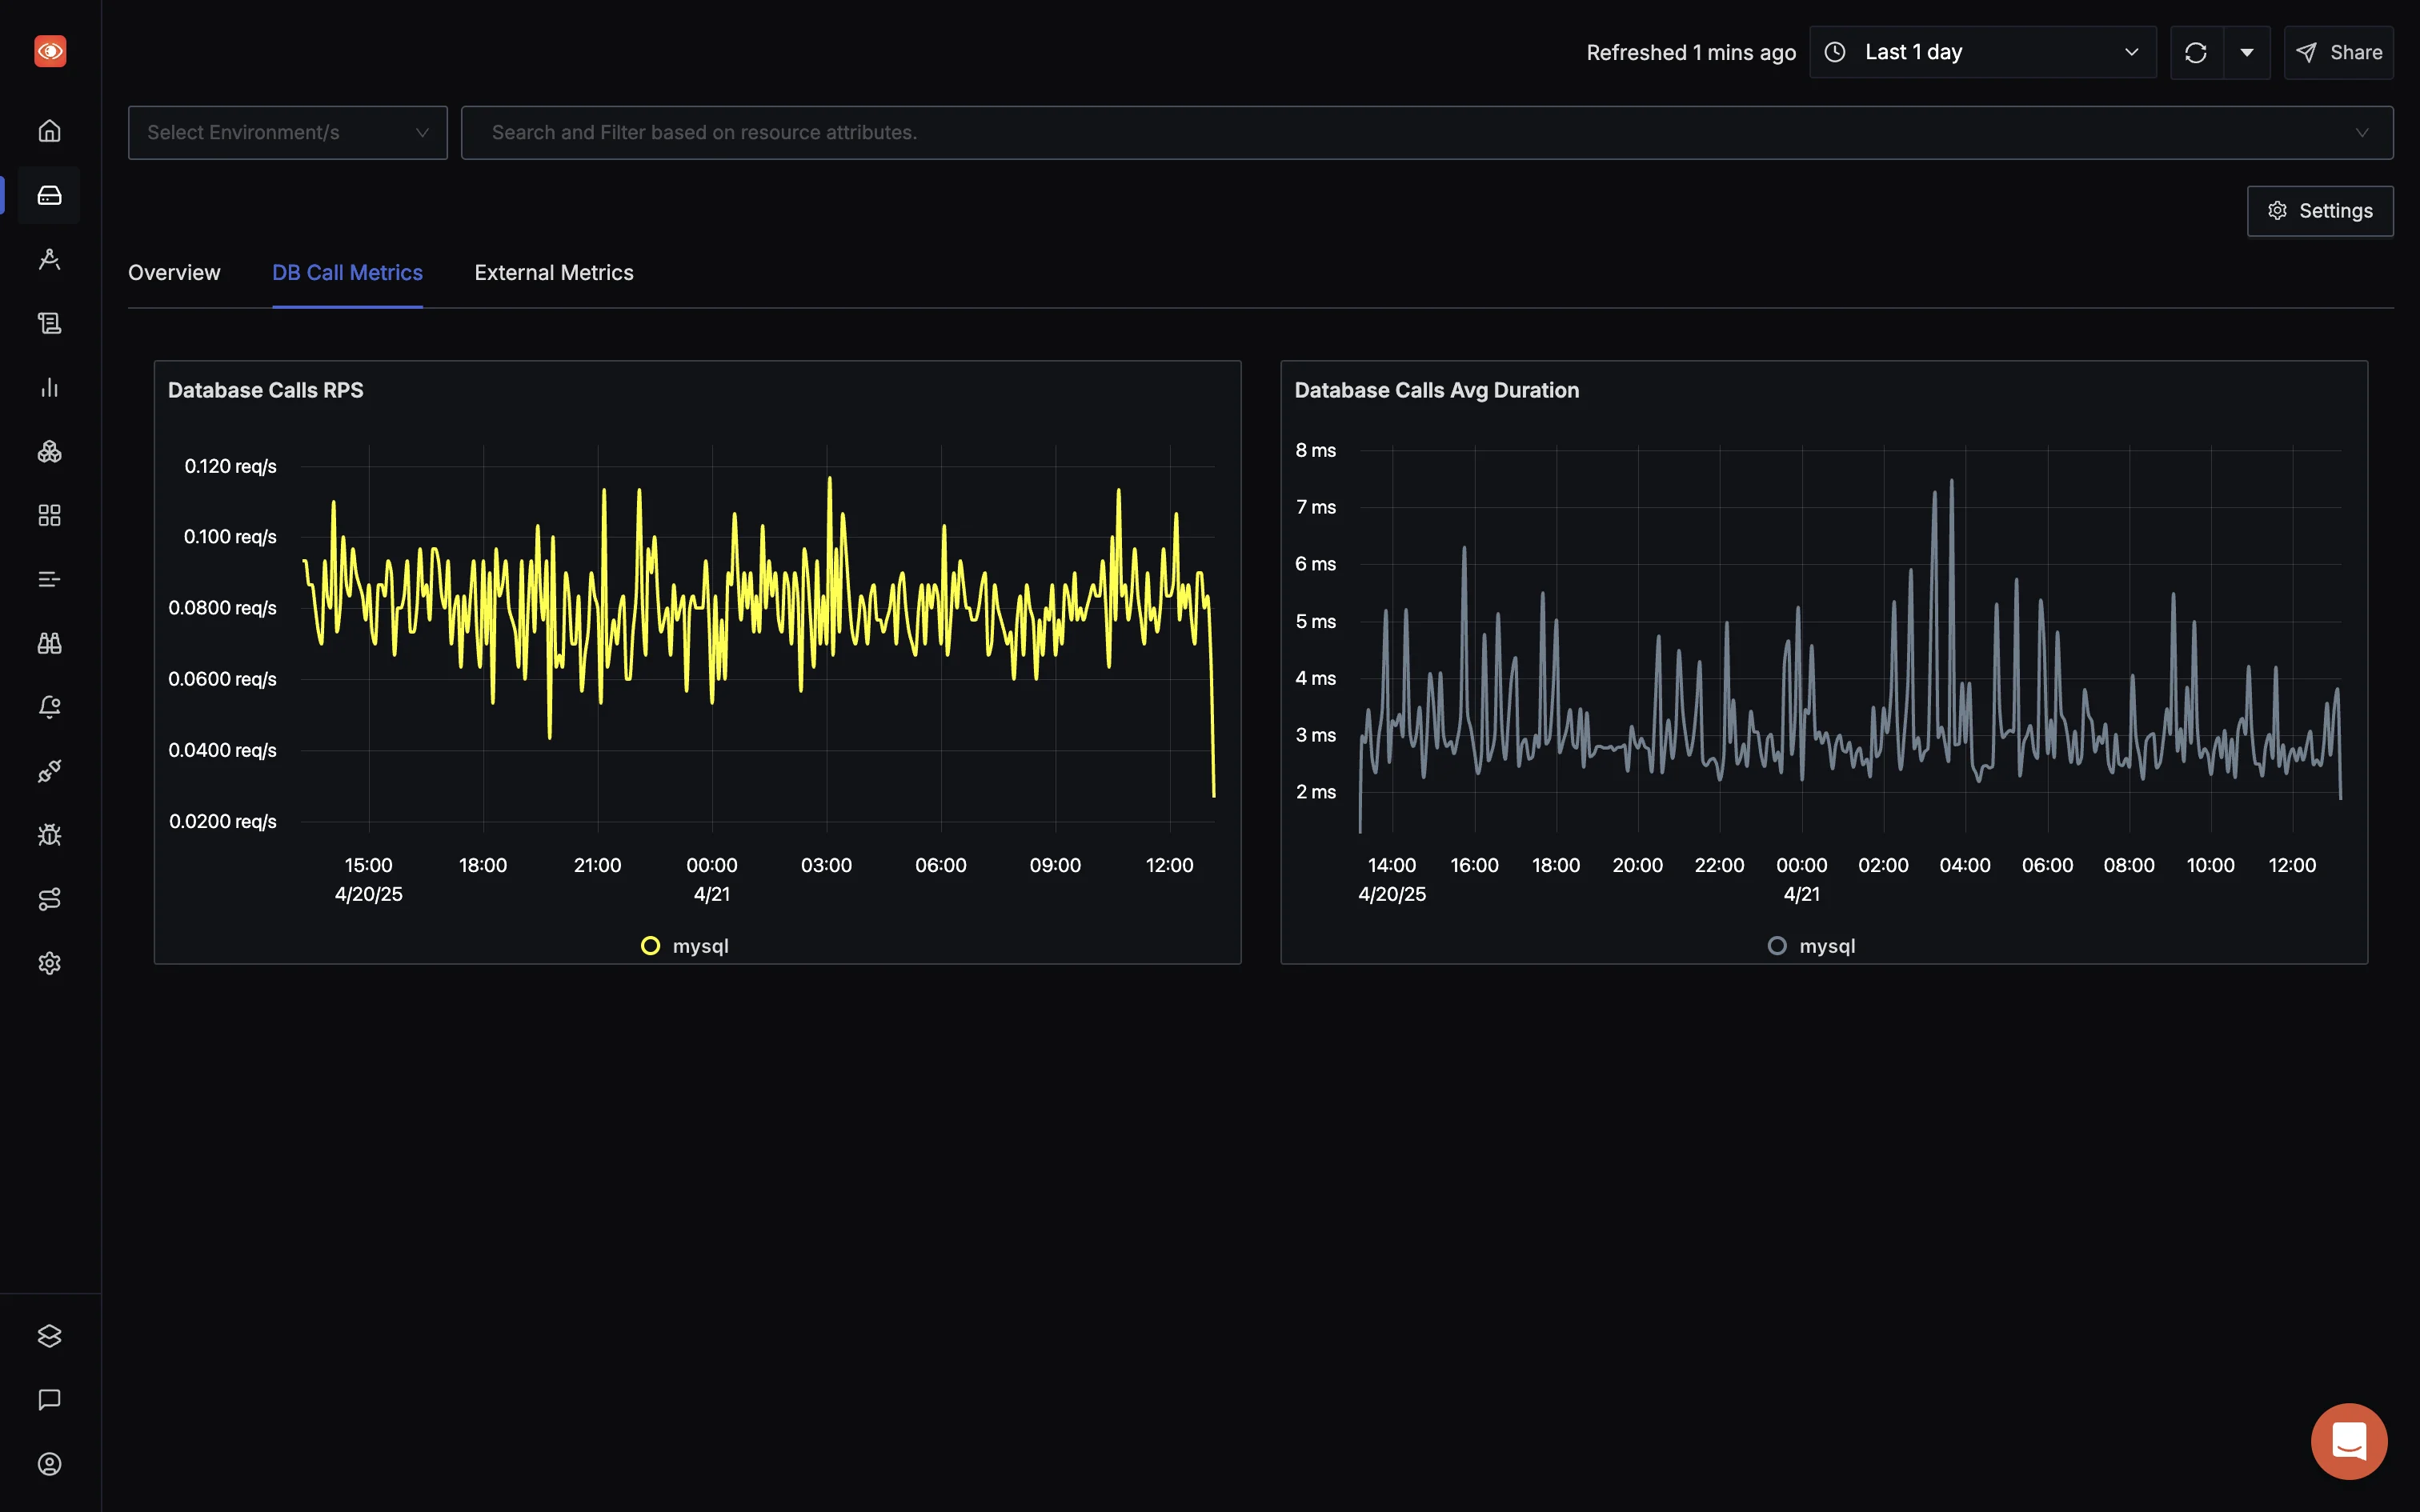
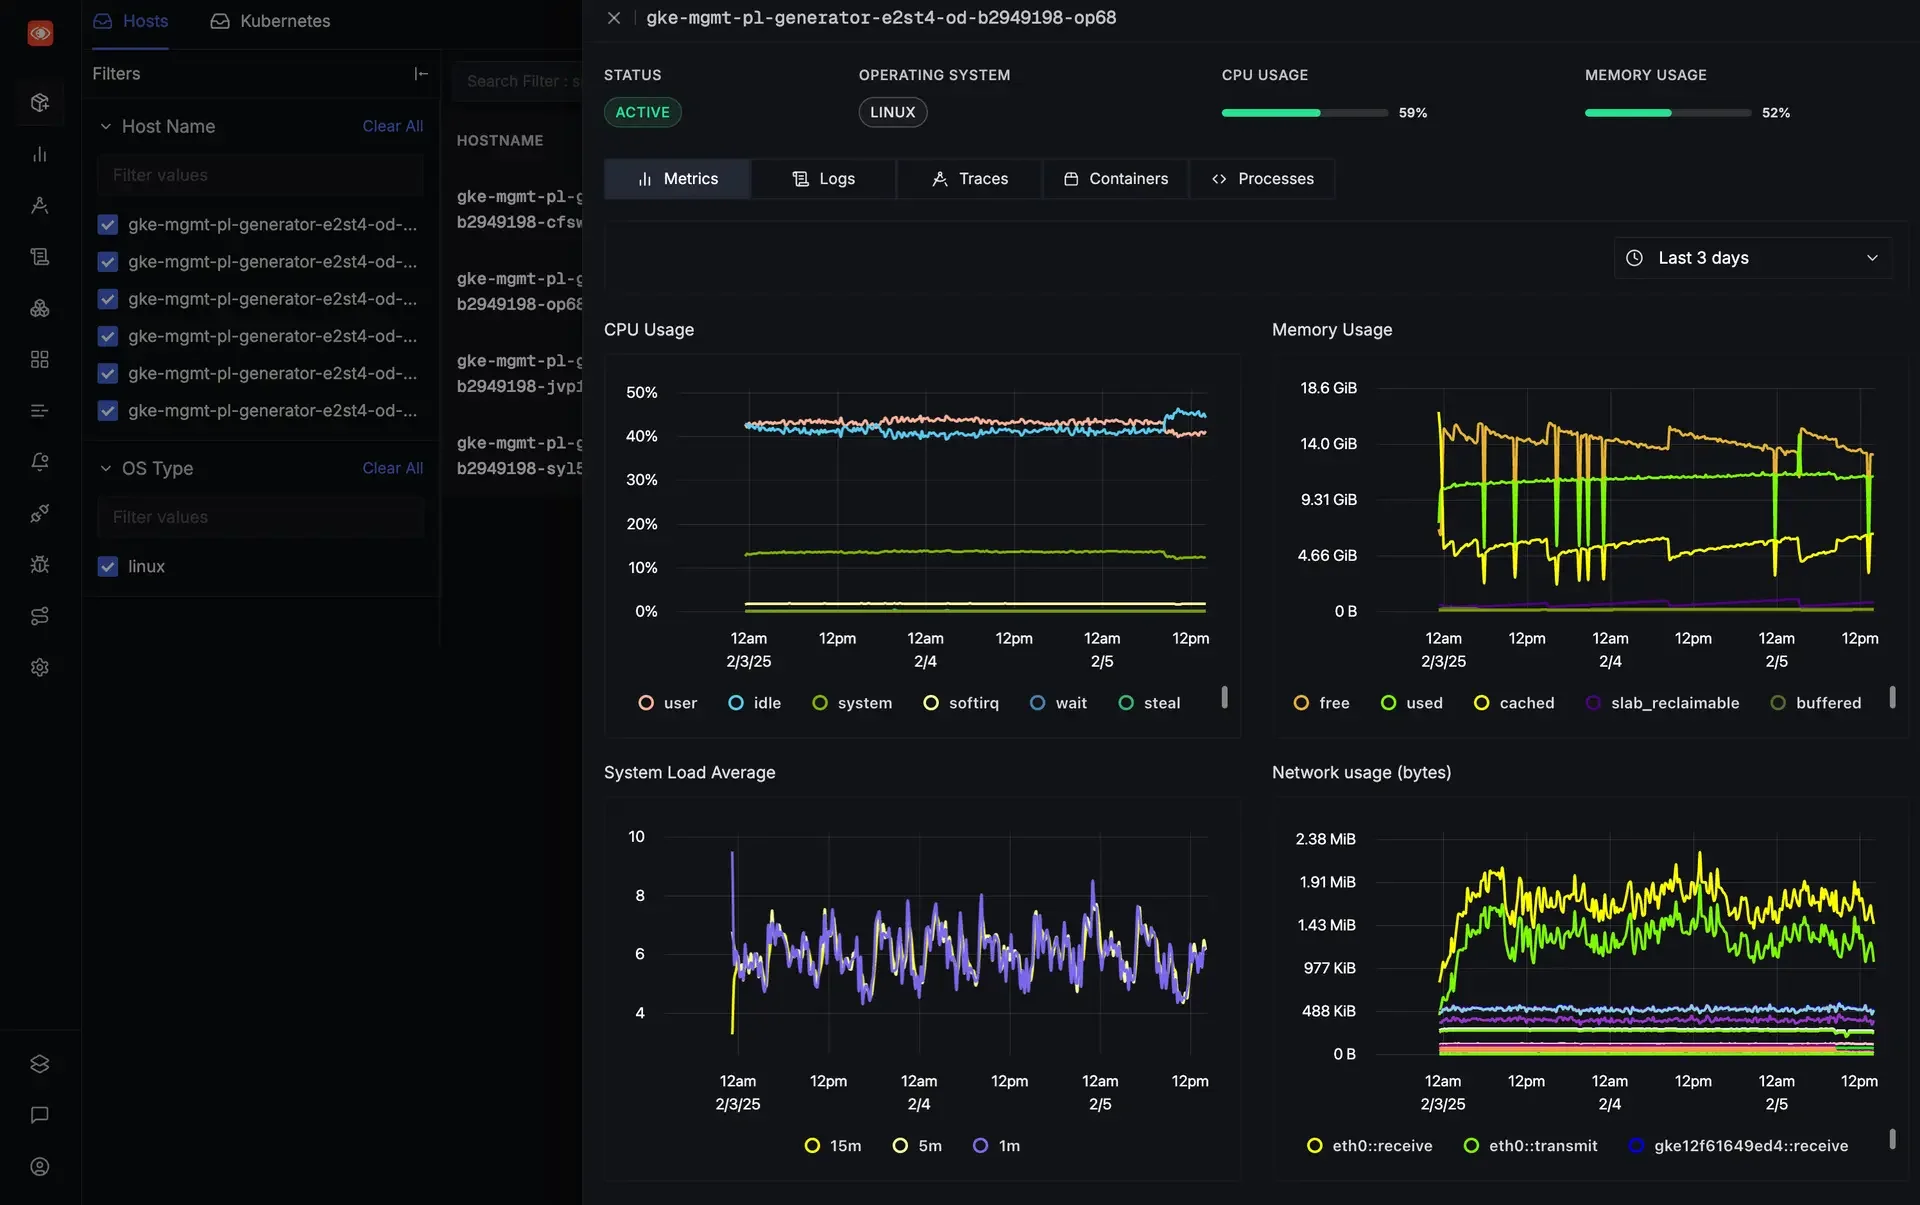
SigNoz provides a metrics builder using which you can create customized dashboards to monitor your MySQL databases. You can also monitor the health and performance of the host machines where your MySQL database is hosted.
Pricing
- SigNoz Cloud starts at $49/month.
SigNoz cloud is the easiest way to run SigNoz. Sign up for a free account and get 30 days of unlimited access to all features.

You can also install and self-host SigNoz yourself since it is open-source. With 20,000+ GitHub stars, open-source SigNoz is loved by developers. Find the instructions to self-host SigNoz.
Prometheus
Prometheus enables you to capture time-series data as metrics. You can capture metrics about MySQL query performance and stats about your MySQL deployments using Prometheus. You must install a MySQL exporter to collect metrics from MySQL deployments and relay them to a Prometheus server.
Why Use Prometheus for MySQL Monitoring
- Prometheus is open-source
- The exporter supports a multi-target pattern, which means you can run a single instance to connect multiple MySQL targets.
However, Prometheus comes with a very basic visualization layer. It's generally used with Grafana, a visualization tool to create charts and metrics.
Besides, Prometheus does not provide distributed tracing. This means that although Prometheus can provide insights into how your MySQL instances are performing, it will not offer contextual information for your MySQL database queries.
Pricing
- Prometheus is free
- You can get managed services or Prometheus commercial distributions from different vendors at various price points.
Oracle Enterprise Manager
Oracle Enterprise Manager allows DevOps, SREs, and DB admins to monitor MySQL databases for availability and performance metrics (connections to MySQL or InnoDB buffer pool usage). It helps to identify slow-running queries quickly and ensures database compliance with performance and security best practices.
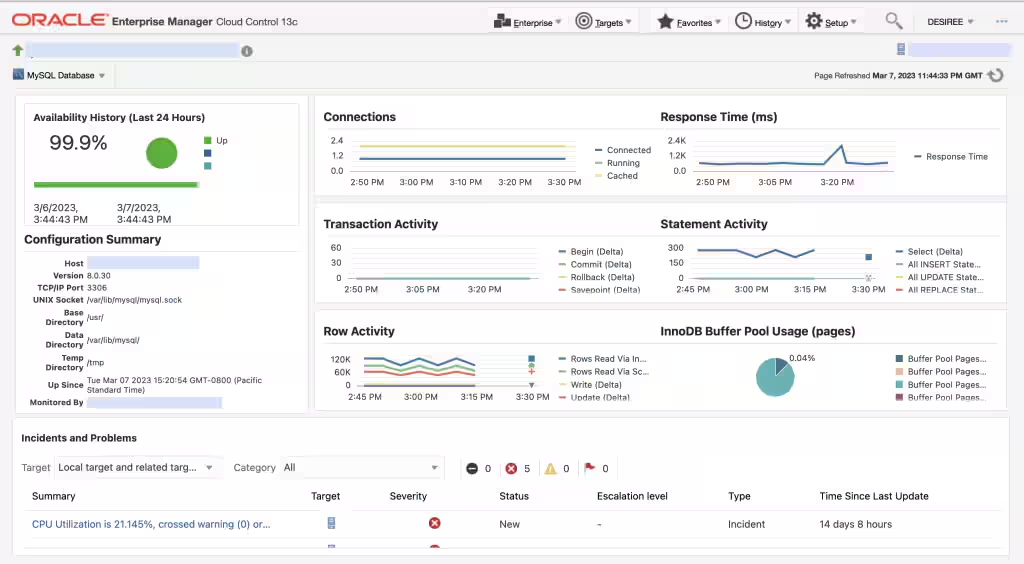
MySQL Enterprise Monitor was an Oracle alternative for monitoring databases. It reached end-of-life on January 1, 2025. For those using earlier versions of Enterprise Monitor, Oracle recommends migrating to Enterprise Manager for MySQL.
Why Use Oracle Enterprise Manager for MySQL Monitoring
Enterprise Manager can auto-discover MySQL databases on managed hosts. Once databases are auto-discovered or manually added, you can:
- Automate fixes, like restarting MySQL when it's down
- Identify slow-running queries using the Query Analyzer
- Standardize monitoring and compliance for multiple databases
Pricing
- Custom pricing
Paessler PRTG Network Monitor
Paessler PRTG Network Monitor provides IT infrastructure monitoring along with MySQL database monitoring. PRTG delivers a predefined sensor for MySQL monitoring. You can use the sensor to monitor MySQL database metrics like availability and execution time.
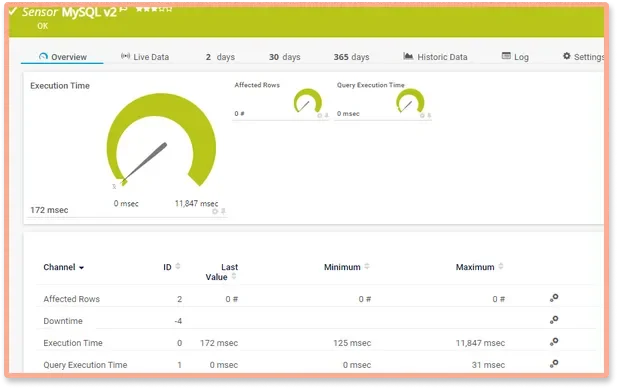
Why Use PRTG for MySQL Monitoring
- PRTG Network Monitor automatically queries databases and measures the time required for establishing a connection, executing an SQL query, handling a transaction, and disconnecting
- Provides customizable alerts and notifications when a database is unavailable or when it returns incorrect values
- Offers creating custom database reports to share with the stakeholders
Pricing
- Paessler PRTG Network Monitor subscription starts at $179/month (billed annually) for 500 sensors
Sematext
Sematext is an enterprise monitoring tool that provides various IT systems and infrastructure monitoring solutions. It gives detailed dashboards for MySQL monitoring. Once installed, the Sematext agent collects logs and metrics from MySQL services and displays them on Sematext Cloud.
Why Use Sematext Cloud for MySQL Monitoring
- Automated database discovery along with their logs
- View application and database performance metrics in a split view for each correlation
- Set up custom alert rules for deviations in metrics
Pricing
- Monitoring the entire infrastructure with Sematext Cloud costs a starting price of $2.8/month
SolarWinds
SolarWinds provides a MySQL monitoring solution in SolarWinds Observability SaaS. It provides MySQL performance metrics, such as latency, throughput, index usage, execution plans, etc. DevOps, SREs, or DB admins can view the metrics on preconfigured or create custom dashboards.
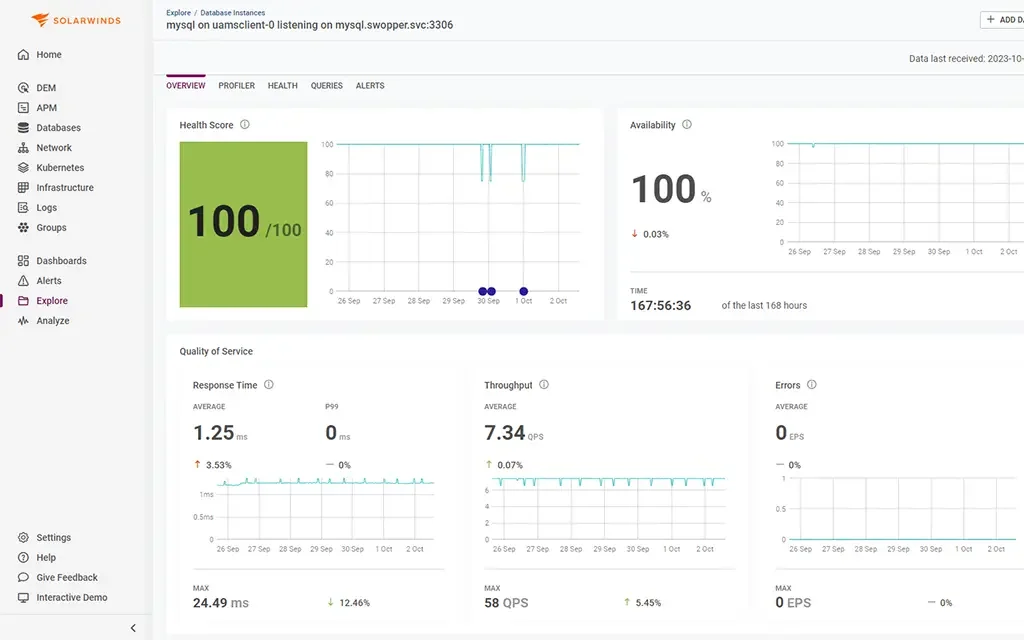
Why Use Database Observability for MySQL Monitoring
- Supports various deployment environments, including self-hosted MySQL instances, Amazon RDS, Google Cloud SQL, and more
- Provides real-time alerts and root cause diagnostics
- Tracks MySQL performance metrics, query execution times, and resource utilization
Pricing
- SolarWinds Observability SaaS provides Database Observability, which starts at $117/database/month.
Dynatrace
Dynatrace is a cloud-based monitoring solution that provides MySQL monitoring capabilities. Its agents can auto-detect your MySQL databases to start monitoring. Dynatrace compares current MySQL performance with historical metrics and creates a baseline for performance. It also categorizes all activities on your MySQL database instances to drive insights into MySQL performance.
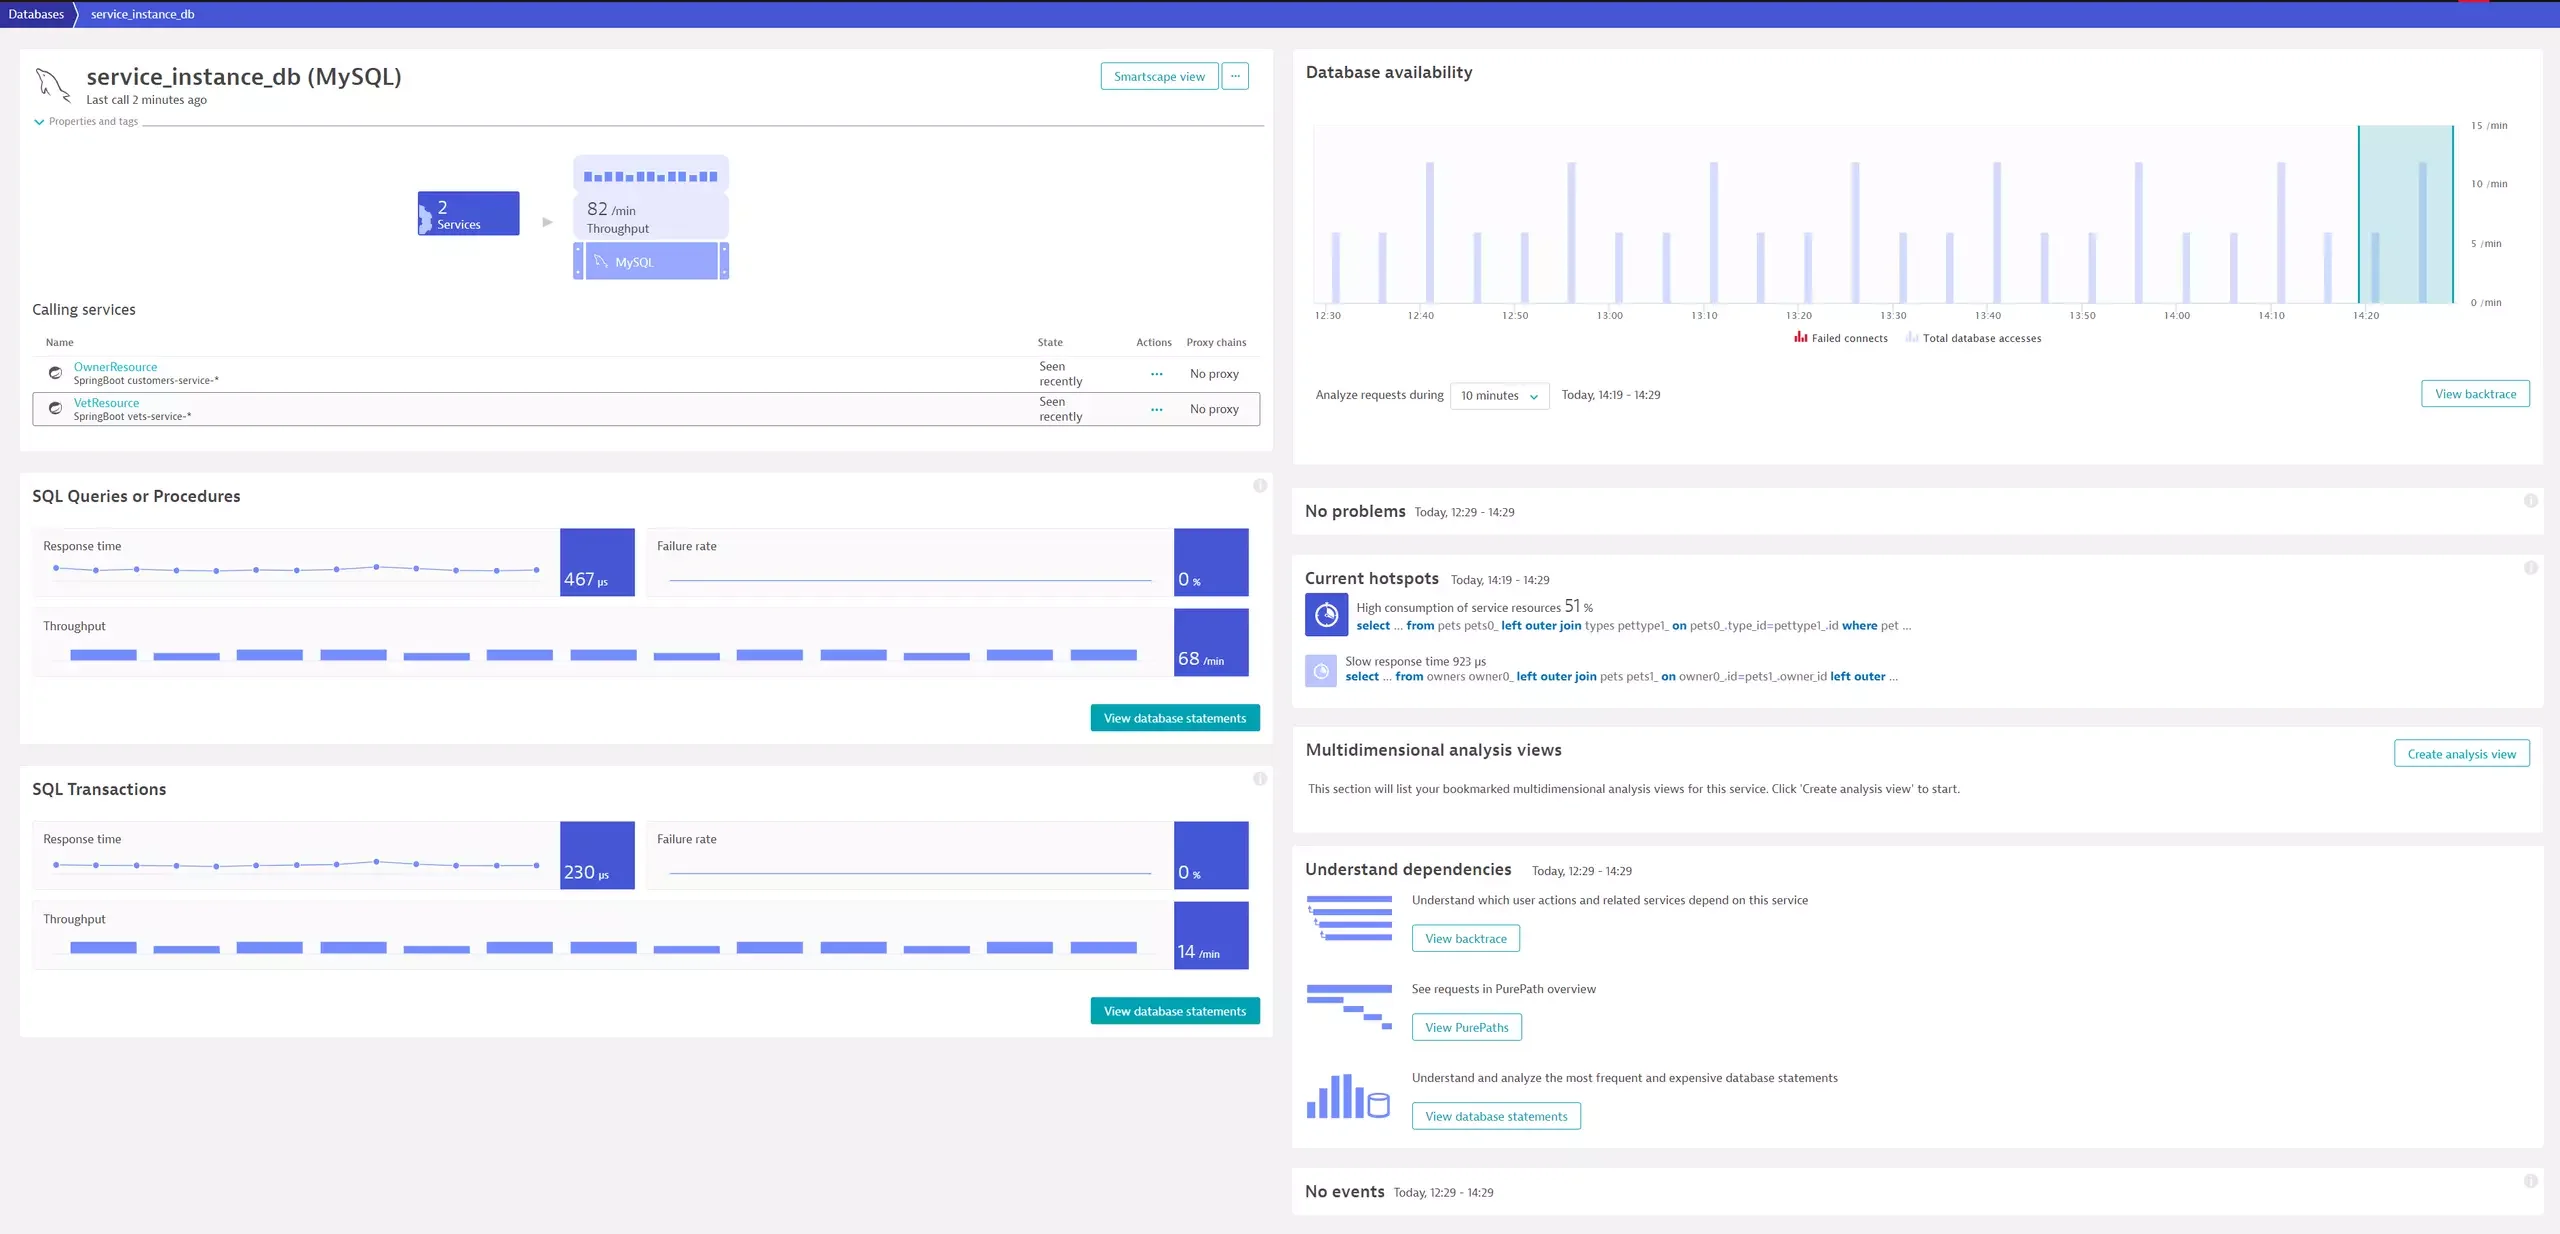
Why Use Dynatrace for MySQL Monitoring
- Automated end-to-end tracing with detailed insights into individual SQL statements, MySQL server performance metrics, and log data
- AI-driven diagnostics to pinpoint slow queries and performance bottlenecks
- Visualizes how applications interact with MySQL to optimize database usage
Pricing
- Dynatrace Full-Stack Monitoring starts at $0.08 per hour for an 8 GiB host
Datadog
Datadog is an enterprise monitoring tool that provides various solutions, such as APM, infrastructure monitoring, real-user monitoring, and more. It also provides MySQL monitoring that continually collects MySQL statistics and metrics. You can install Datadog agents on your database servers and monitor them on a dashboard.
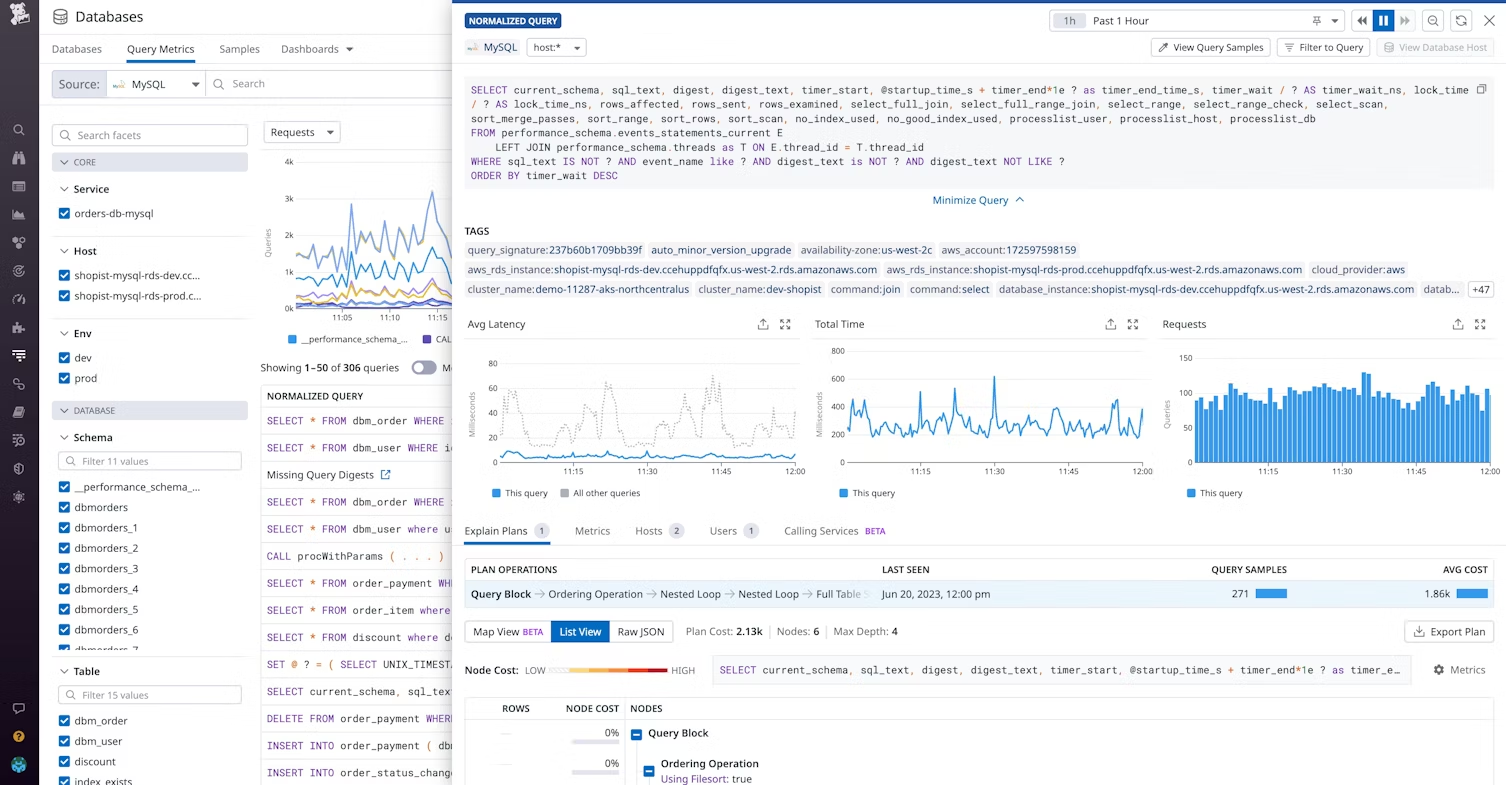
Why Use Datadog for MySQL Monitoring
- 850+ vendor-backed integrations
- Provides live and historical query snapshots, wait event analysis, and query explain plans
- Tracks key MySQL metrics like query execution time, connections, errors, and InnoDB performance
Pricing
- Datadog's database monitoring starts at $70/database/month
New Relic
New Relic is an enterprise monitoring application tool that provides various solutions, from application and infrastructure monitoring to log management. New Relic provides a MySQL integration that collects and sends data from the database to New Relic's platform. The platform dashboard lets you monitor key MySQL performance metrics like uptime, the number of simultaneous connections, memory usage, storage speed, query speed, and more.
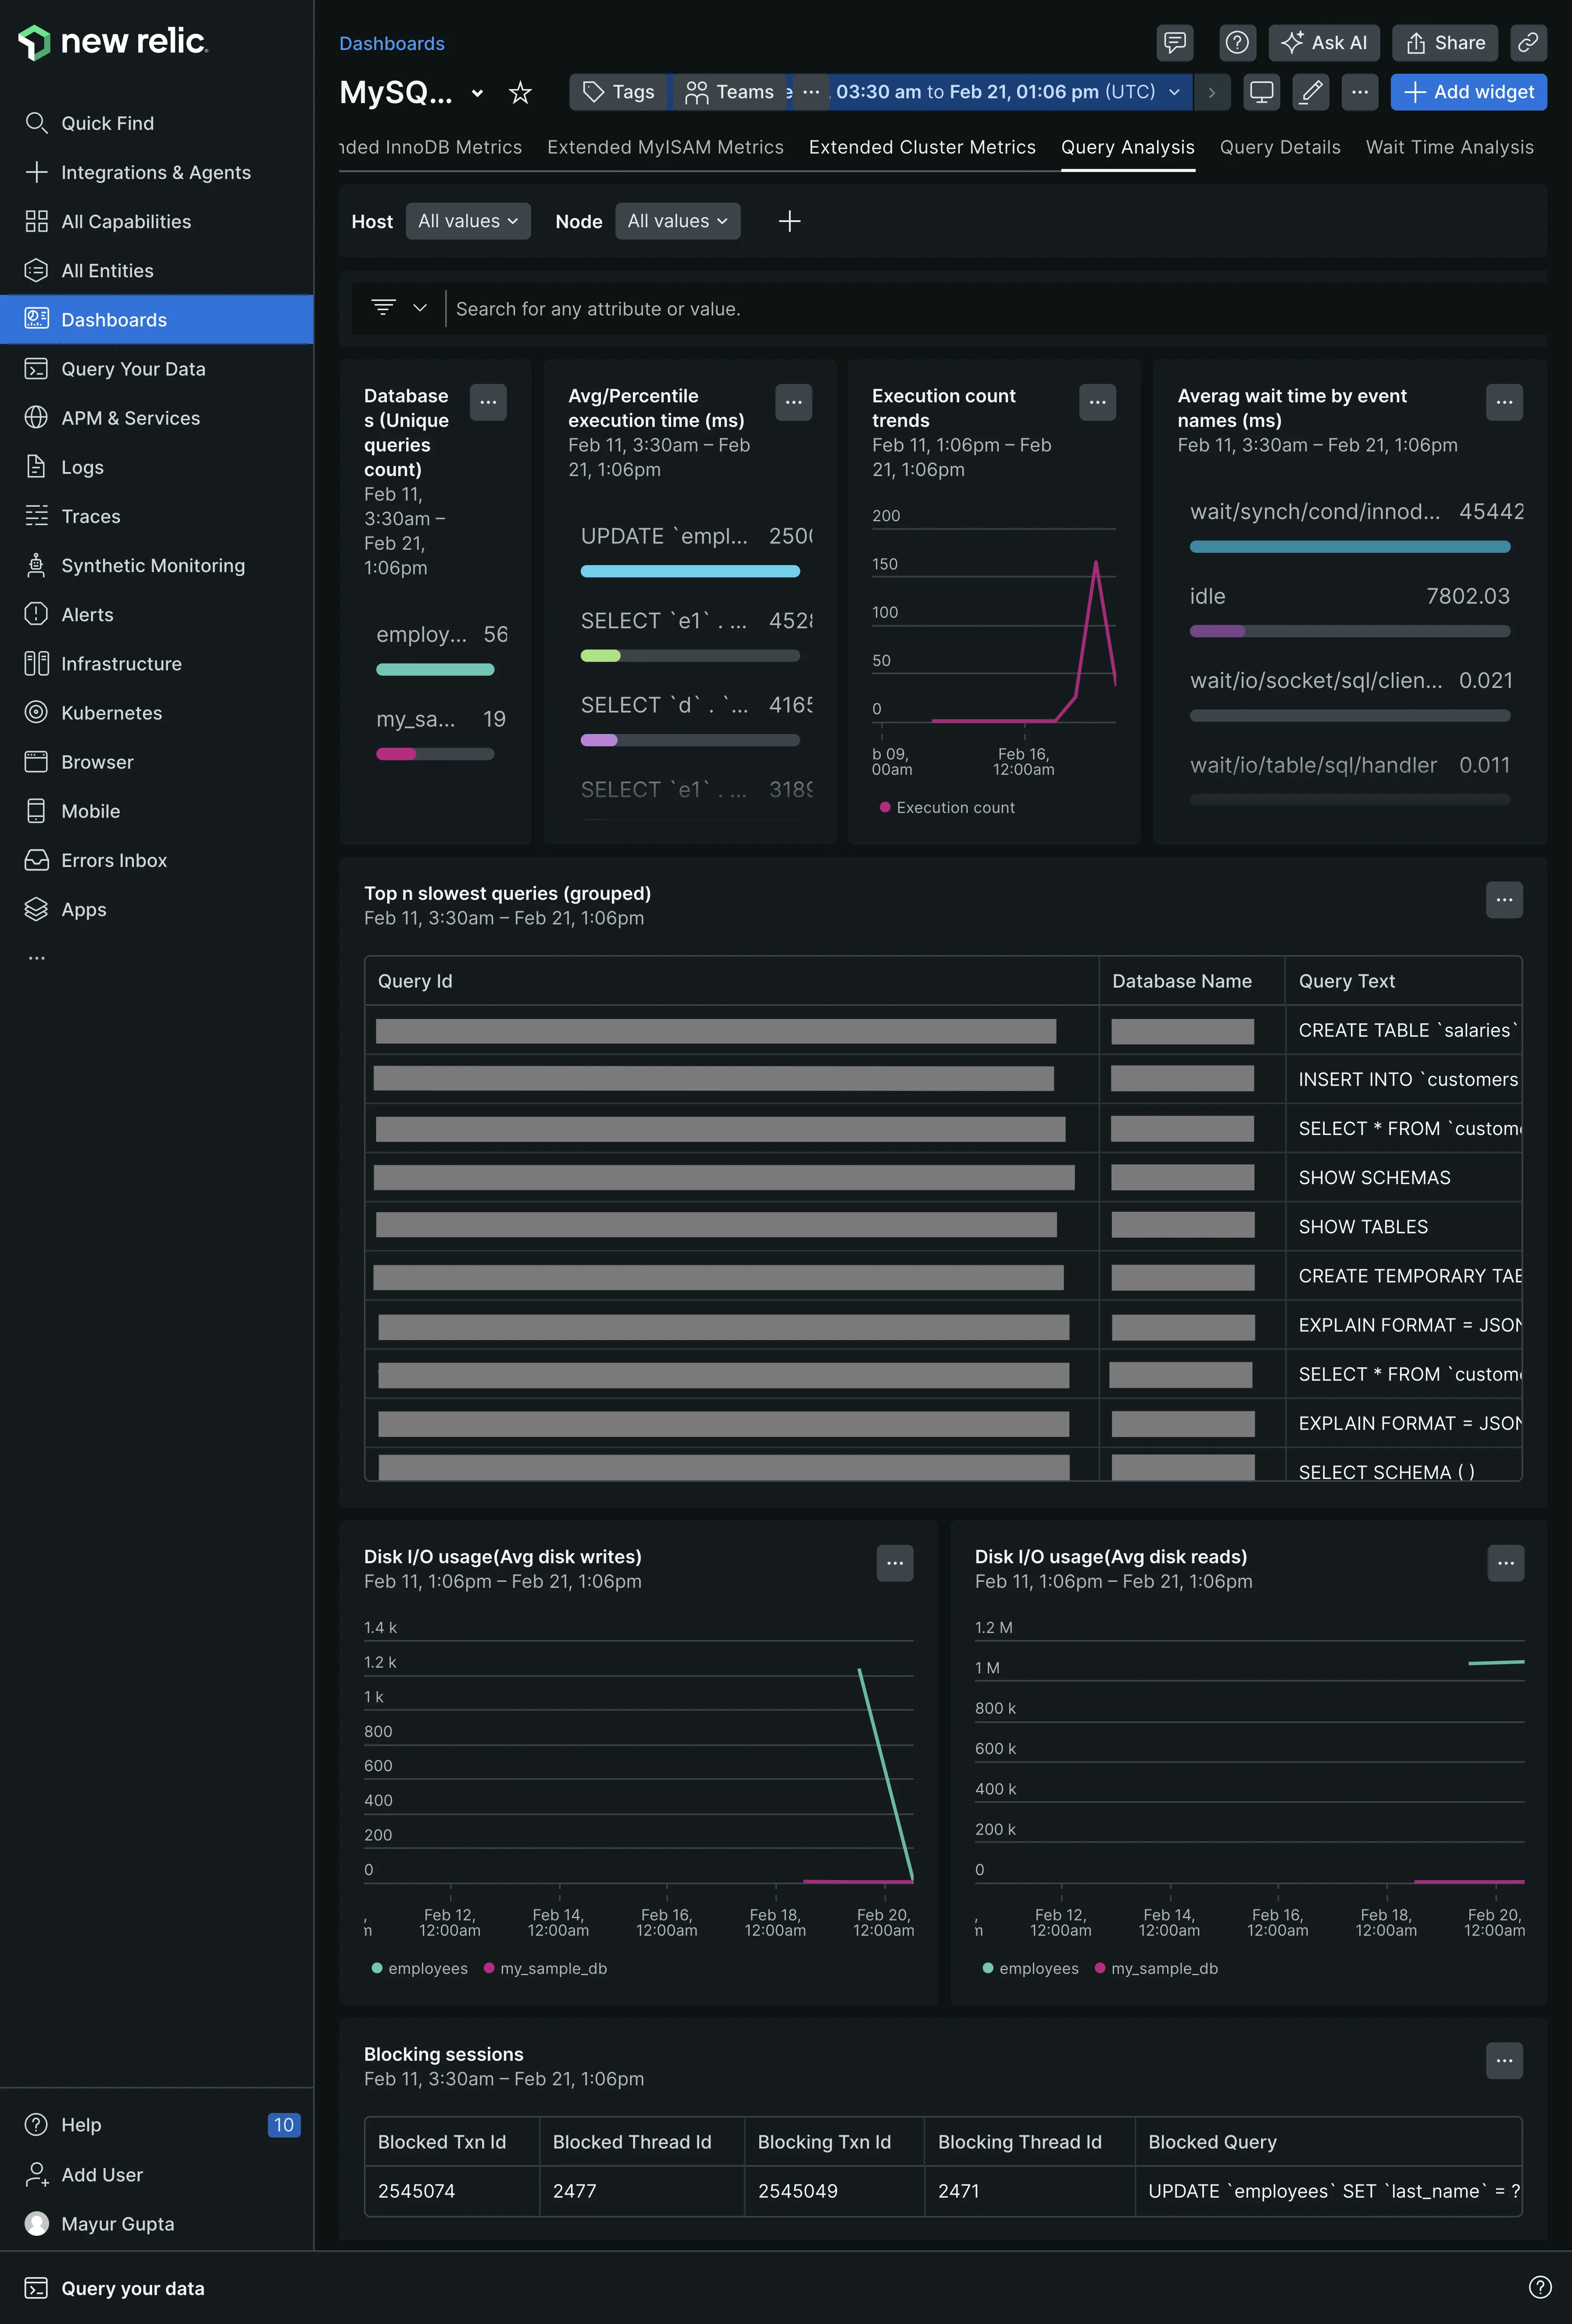
Why Use New Relic for MySQL Monitoring
- Tracks critical MySQL performance metrics, such as query execution times, connections, and InnoDB buffer pool usage
- Provides detailed visibility into slow queries and their impact on database performance
- Sends real-time notifications for anomalies or performance issues
Pricing
- Free tier includes 100 GB of data ingest per month
- Standard plan starts at $0.35 per GB of data ingest per month beyond the free tier, with additional costs for advanced features
ManageEngine Applications Manager
ManageEngine Application Manager helps monitor MySQL metrics and trigger notifications in case of downtime. Some key metrics that the Application Manager can track for MySQL are connection time, request statistics, connection statistics, table lock statistics, and query hit ratio.
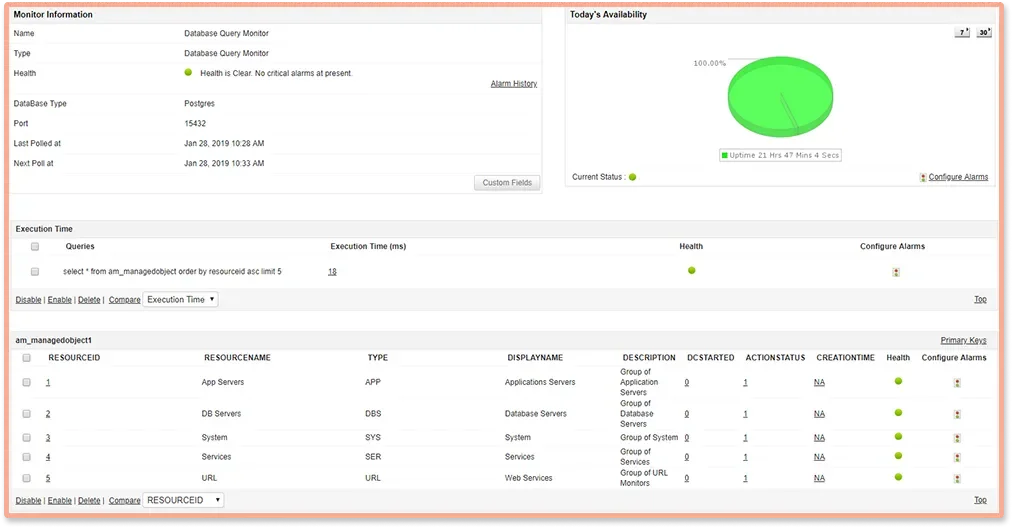
Why Use ManageEngine Application Manager for MySQL Monitoring
- Offers intelligent forecasting reports to predict resource growth trends
- Monitors key metrics like query execution times, database connections, and server resource utilization
- Sends notifications for anomalies or threshold violations
Pricing
- The free version supports monitoring up to 5 apps or servers
- Professional Edition starts at $395/year for up to 10 apps or servers
Splunk
DevOps and DB admins can use Splunk Observability Cloud to monitor the MySQL database in real time. It tracks MySQL DB performance using OpenTelemetry and gives insights into database health, query performance, and service dependencies. The tool lets you quickly get to the root cause of issues, such as DB connection failures, by correlating the service map, query error spikes, and stacktrace.

Why Use Splunk for MySQL Monitoring
- Leverages OpenTelemetry for seamless data collection and visualization
- Uses AI/ML-driven features like Service Maps and Trace Analytics for faster issue resolution
- Offers full-fidelity monitoring with no data sampling
Pricing
- Splunk Observability Cloud starts at $15/host/month
Choosing the Right Tool to Monitor Your MySQL Databases
You can monitor MySQL servers in isolation. However, it would be much more effective if the monitoring tool helps you monitor them with contextual information like which service made the call, along with resource metrics from your infrastructure.
Having complete visibility on the entire request involving MySQL queries can help engineering teams debug performance issues faster.
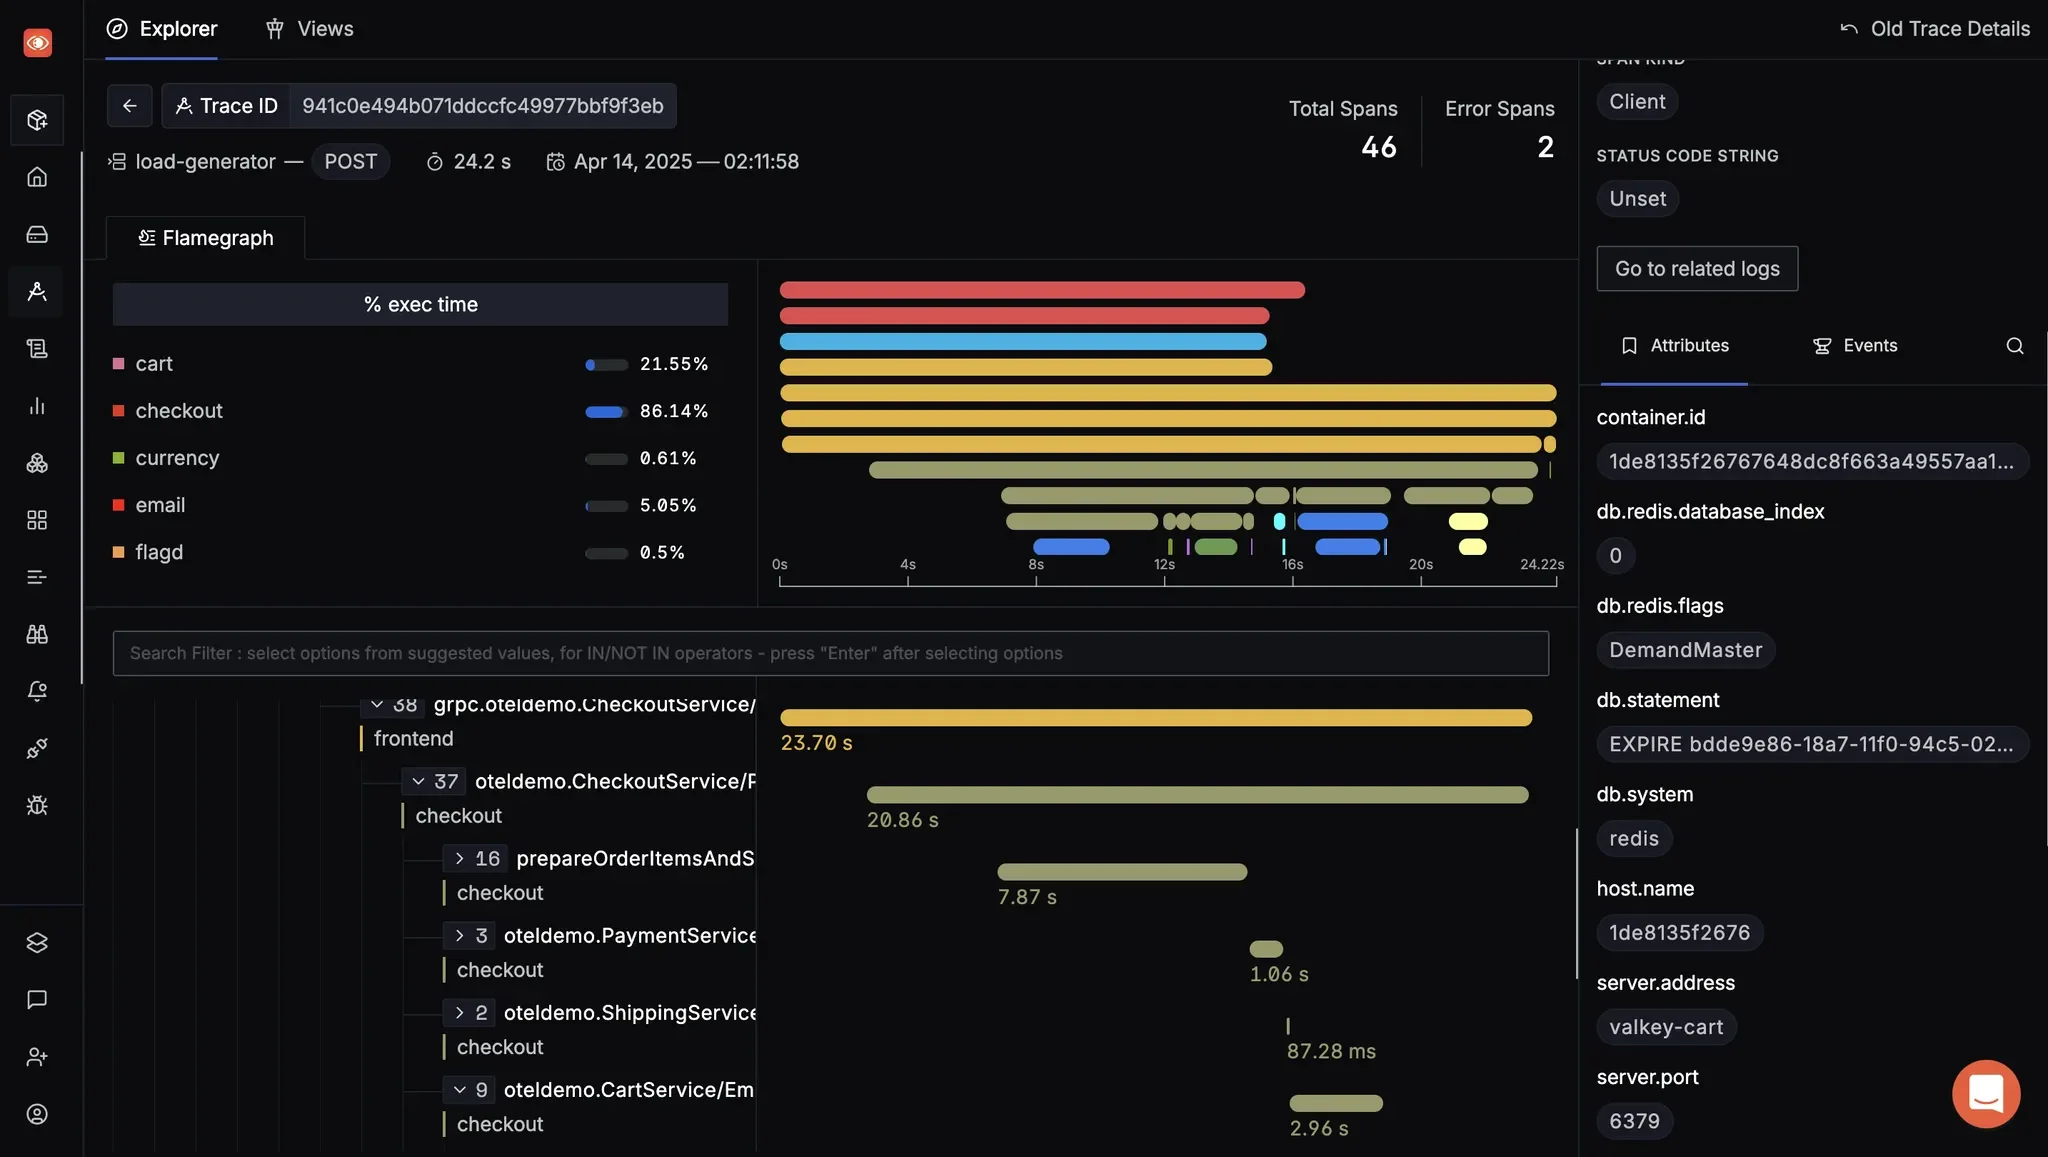
For this to happen, the tool must have capabilities like distributed tracing. SigNoz, the open-source unified observability solution, provides distributed tracing as one of its significant features.
Using SigNoz, you can trace your MySQL queries and see the entire request in its entirety. SigNoz uses OpenTelemetry as the agent to instrument your application and database calls. Since OpenTelemetry is becoming the standard way of instrumenting cloud-native applications, you can future-proof your monitoring stack with SigNoz.
SigNoz is open-source; you can check out the repo on GitHub:
FAQs
What are MySQL Monitoring Tools?
MySQL monitoring tools are software applications that track, analyze, and report on MySQL database servers' performance, health, and availability. They help identify potential issues, optimize performance, and ensure the smooth operation of MySQL databases.
Why is MySQL Monitoring Important?
MySQL monitoring is crucial because it helps maintain optimal database performance, prevent downtime, identify bottlenecks, and ensure data integrity. It allows database administrators and developers to proactively address issues before they impact users or business operations. What are Some Key Metrics to Monitor in MySQL?
What are Some Key Metrics to Monitor in MySQL?
Key metrics to monitor in MySQL include:
- Query response time
- Number of connections
- Buffer pool utilization
- Disk I/O
- Replication lag
- Table locks
- Query cache hit ratio
- Slow queries
How do Open-source MySQL Monitoring Tools Compare to Commercial Solutions?
Open-source tools like SigNoz and Prometheus offer robust monitoring capabilities at no cost, with the flexibility to customize and extend functionality. Commercial solutions like Dynatrace and DataDog often provide more comprehensive features, better support, and a more straightforward setup at a higher price point. The choice depends on specific needs, budget, and in-house expertise.
Can MySQL Monitoring Tools Help with Database Optimization?
Yes, many MySQL monitoring tools provide insights that can help with database optimization. They can identify slow queries, inefficient indexes, resource bottlenecks, and other performance issues. This information lets database administrators make informed decisions about query optimization, server configuration, and resource allocation.
What is Distributed Tracing and Why is it Important for MySQL Monitoring?
Distributed tracing is a method for tracking and analyzing requests as they flow through distributed systems. It's vital for MySQL monitoring because it allows you to see a request's complete journey, including database queries, in the context of your entire application. This helps identify performance bottlenecks and understand how database operations impact overall application performance.
How can I Choose the Right MySQL Monitoring Tool for my Needs?
To choose the right MySQL monitoring tool:
- Assess your specific monitoring requirements
- Consider your budget and whether you prefer open-source or commercial solutions
- Evaluate the tool's features, such as real-time monitoring, alerting capabilities, and dashboard customization
- Check for integration with your existing tech stack
- Consider the tool's scalability to accommodate future growth
- Look for tools that offer comprehensive insights, including distributed tracing for a holistic view of your application's performance
Further Reading
SigNoz - an open-source APM alternative
Monitor MongoDB calls with OpenTelemetry and SigNoz
