Node.js powers some of the fastest-growing web applications, but its single-threaded nature makes it vulnerable to memory leaks and CPU spikes. To keep your app running smoothly, especially in production, you need more than just web server logs — you need complete visibility across the entire stack.
In this practical guide, we’ll walk through how to implement performance monitoring for a Node.js app using open-source tools — OpenTelemetry for instrumentation and SigNoz for visualization.
You’ll learn how to track performance metrics in real time using SigNoz
👉 Learn how to build a CRUD application using Vue 3, Node, Express, and MongoDB.
What is Node.js Performance Monitoring?
Monitoring performance in Node.js isn’t just about graphs and numbers — it’s your first line of defense when things go wrong. It involves collecting data on key performance indicators (KPIs) to ensure optimal application health and user experience.
Key components of Node.js performance monitoring include:
- Resource usage: CPU, memory, and disk utilization
- Response times: How quickly your application responds to requests
- Error rates: The frequency and types of errors occurring in your application
- Throughput: The number of requests your application can handle
While logging tells you what happened, performance monitoring shows you why it happened — giving you a bird’s-eye view of your app’s health.
Why is Node.js Performance Monitoring Critical?
Picture this: Your Node.js app powers an e-commerce site during a major sale. Suddenly, users start complaining — carts aren't updating, checkouts stall, and your CPU usage is spiking. Without proper monitoring, you're left scrambling in the dark, trying to diagnose performance issues as customers abandon their carts.
Node.js apps come with their own set of performance risks:
- Event loop blocking: Long-running operations can stall the entire application
- Memory leaks: Improper memory management can lead to crashes and poor performance
- Scaling issues: Node.js's single-threaded nature requires careful monitoring as traffic increases
That’s where proactive monitoring steps in. It gives you visibility into potential bottlenecks before they spiral into full-blown outages.
For instance, a fintech company once identified a creeping memory leak in its job queue system using proactive monitoring tools. Fixing it not only stopped their weekly crashes but also improved overall response times by 40%.
It’s not just about catching failures — proactive monitoring helps you build resilient, performant systems that stay healthy even under pressure.
Essential Metrics for Node.js Performance Monitoring
To effectively monitor your Node.js application, focus on these key metrics:
- CPU Usage: High CPU usage can indicate inefficient code or the need for scaling.
- Memory Consumption: Track heap size and growth over time to detect memory leaks early.
- Event Loop Lag: Measures how long operations wait in the event queue — a key indicator of application responsiveness.
- Network I/O: Monitor incoming and outgoing network traffic to identify bottlenecks.
- Database Query Performance: Slow queries can significantly impact overall application performance.
Advanced Metrics to Consider
Once you've covered the fundamentals, here are some deeper insights worth tracking
- Garbage Collection: Frequent or long-running garbage collection can impact performance.
- Clustering Efficiency: In multi-core environments, ensure your clusters are utilized effectively.
- External Service Dependencies: Monitor the performance of APIs or services your application relies on.
- Event Loop Utilization: Track how busy your event loop is over time.
- Custom Application Metrics: Track business-specific KPIs relevant to your application's goals.
👉Learn how to Set up Custom Metrics - OpenTelemetry NodeJS
Now that we’ve outlined what metrics matter, let’s walk through how to collect and visualize them using OpenTelemetry and SigNoz.
How to Monitor Your Node.js App with OpenTelemetry and SigNoz
Monitoring your Node.js application’s performance becomes incredibly simple with SigNoz and OpenTelemetry. In just a few steps, you can start collecting key performance data like request latency, error rates, throughput, and resource usage — all essential for production-grade observability.
If you want to monitor specific aspects of your Node.js application that are unique to your business logic or performance goals—like tracking the number of user sign-ups, measuring the distribution of API response times, or logging how often a feature is used—you'll need to send custom metrics such as counters and histograms.
Step 1: Set Up OpenTelemetry in Your App
Install the required OpenTelemetry libraries:
npm install @opentelemetry/api @opentelemetry/sdk-metrics @opentelemetry/exporter-metrics-otlp-http
Then configure the OpenTelemetry SDK to start collecting and exporting metrics:
import HostMetrics from '@opentelemetry/host-metrics';
import { NodeSDK } from '@opentelemetry/sdk-node';
import { OTLPMetricExporter } from '@opentelemetry/exporter-metrics-otlp-http';
import { PeriodicExportingMetricReader } from '@opentelemetry/sdk-metrics';

// Create host metrics collector
const hostMetricsCollector = new HostMetrics.HostMetrics();
hostMetricsCollector.start();

// Configure the OTLP exporter
const metricExporter = new OTLPMetricExporter({
  url: 'https://ingest.<region>.signoz.cloud/v1/metrics',
  headers: {
    'signoz-access-token': 'YOUR_SIGNOZ_ACCESS_TOKEN',
  },
});

// Setup the OpenTelemetry Node SDK
const sdk = new NodeSDK({
  metricReader: new PeriodicExportingMetricReader({
    exporter: metricExporter,
    exportIntervalMillis: 1000,
  }),
});

async function main() {
  try {
    await sdk.start();
    console.log('✅ System metrics collection started');
  } catch (err) {
    console.error('❌ Failed to start SDK:', err);
  }
}

main();
Step 2: Send Custom Metrics from Your App
Now, let’s define metrics tailored to a specific business logic—like a counter for sign-ups and a histogram for request durations:
import './otel.js';
/// imports the OTLP HTTP metric exporter from OpenTelemetry,
/// which is used to send metrics data to a backend like SigNoz.
import { OTLPMetricExporter } from '@opentelemetry/exporter-metrics-otlp-http';
import {
  MeterProvider,
  PeriodicExportingMetricReader
} from '@opentelemetry/sdk-metrics';

// Create exporter
const exporter = new OTLPMetricExporter({
  url: 'https://ingest.in.signoz.cloud/v1/metrics',
  headers: {
    'signoz-access-token': 'YOUR_SIGNOZ_ACCESS_TOKEN',
  },
});

// Create reader with exporter
const reader = new PeriodicExportingMetricReader({
  exporter,
  exportIntervalMillis: 1000,
});

// Provide reader to MeterProvider during creation
const meterProvider = new MeterProvider({
  readers: [reader], // ✅ THIS IS REQUIRED
});

// Use meter
const meter = meterProvider.getMeter('custom-node-meter');

// Create the Counter Metric
const counter = meter.createCounter('custom_node_metric', {
  description: 'Counts custom events from Node.js',
});

// Create the Histogram Metric
const histogram = meter.createHistogram('custom_histogram', {
  description: 'Measures the distribution of request durations',
  boundaries: [0.5, 1, 2, 5, 10], // You can set boundaries based on expected value ranges
});

// Send metrics
setInterval(() => {
  // Increment the counter
  counter.add(1, { status: 'ok' });
  console.log('✅ Custom counter metric sent!');

  // Record a random value to the histogram
  const randomDuration = Math.random() * 10;  // Simulate a random duration (in seconds)
  histogram.record(randomDuration, { status: 'ok' });
  console.log(`✅ Custom histogram metric sent! Duration: ${randomDuration}s`);
}, 5000);
After you’ve implemented the above OpenTelemetry setup in your Node.js application, your app will start sending custom metrics — like custom_node_metric — to SigNoz every 5 seconds.
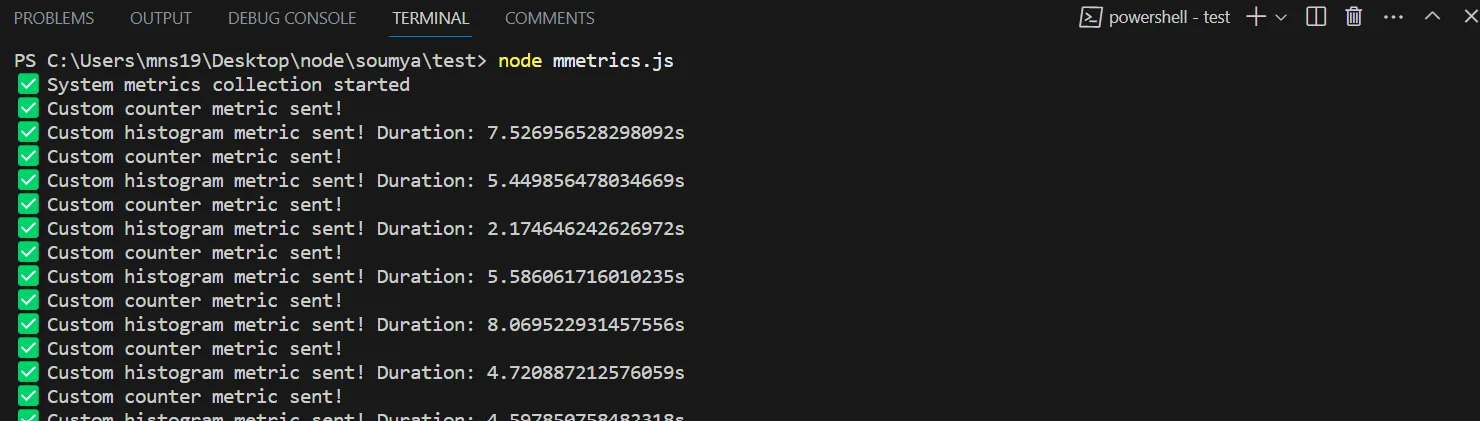
Note: If you don’t see your custom metrics in SigNoz after 2–3 minutes, make sure your access token and endpoint URL are correct and check the console logs for any export errors
Step 3: Monitor and Act on Custom Metrics in SigNoz
Once the data starts flowing, SigNoz gives you powerful tools to monitor, analyze, and act on these custom metrics.
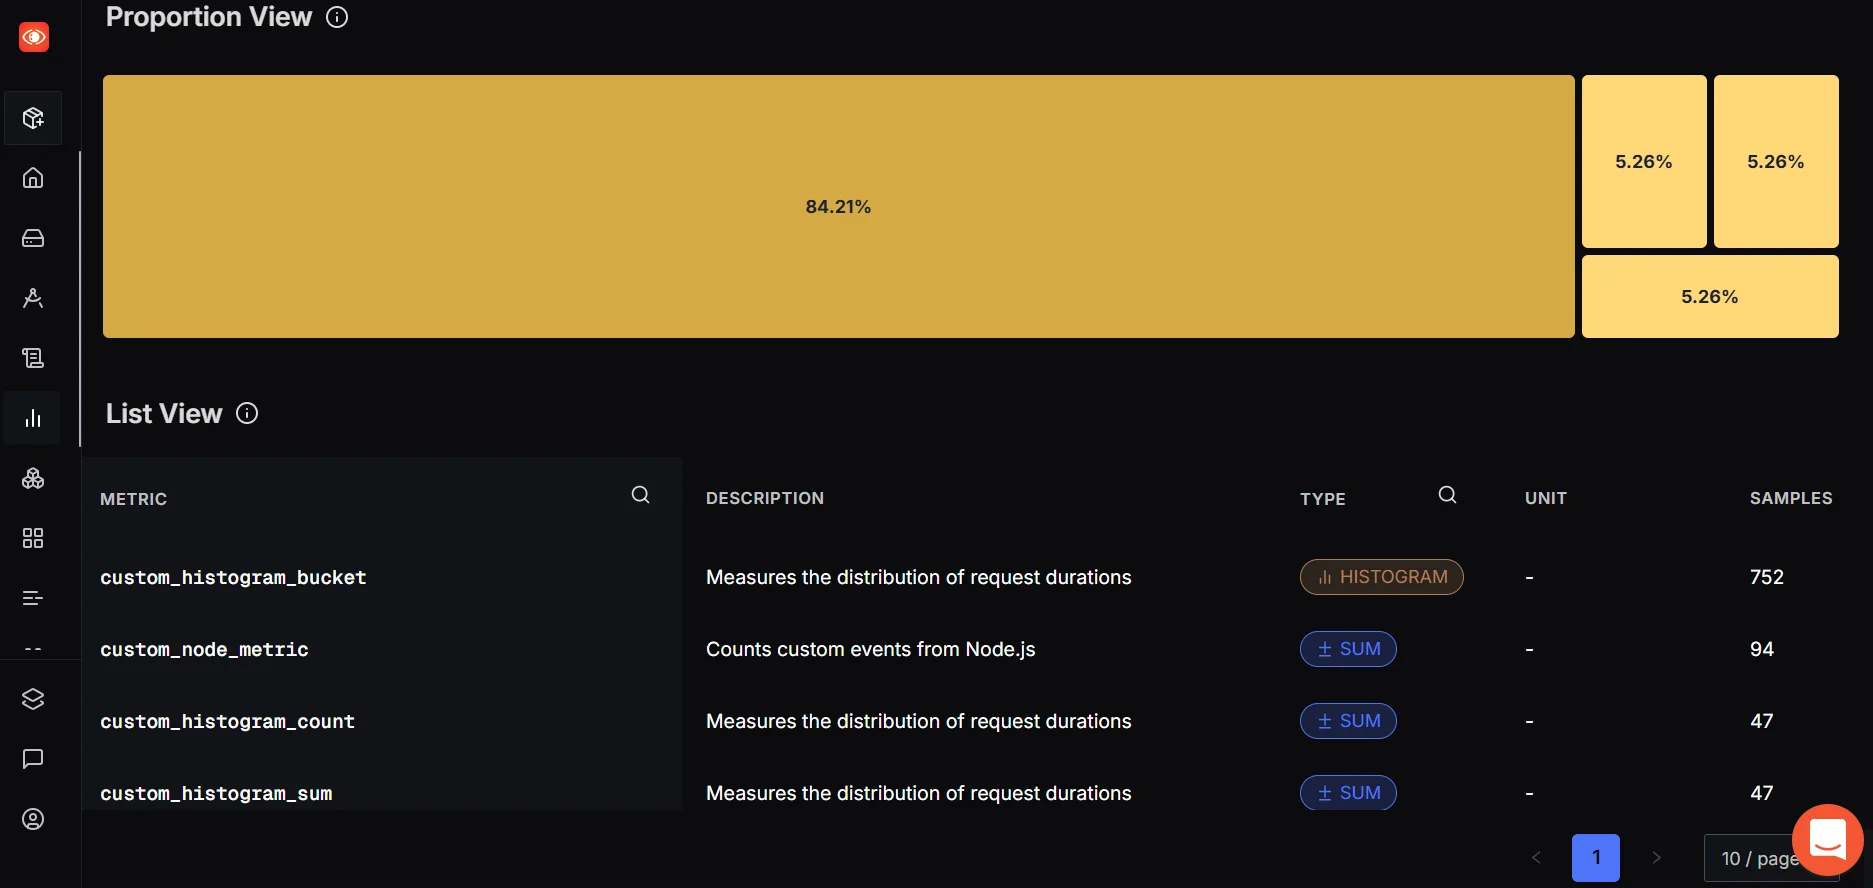
- The List View helps you verify that your metrics are being received correctly by showing their name, type, and sample count.
- The Proportional View gives a treemap of metric usage, making it easy to spot high-volume signals or anomalies.
Note: Auto-instrumentation is great for traces and some built-in metrics, but it won't capture your custom business logic. For that, you'll need to manually define and send metrics using OpenTelemetry's Metrics API.
👉 For a detailed guide on Auto Instrumentation with OpenTelemetry, check out: SigNoz | Auto instrumentation for Traces - OpenTelemetry NodeJS
Monitor Event Speed and Growth
Once your custom_node_metric data appears in SigNoz, you can analyze event frequency and total volume using built-in rate functions. The first thing you might want to track is how often your metric is being called. This can help you understand how frequently a specific event occurs — for example, tracking user logins, API hits, or background job runs.
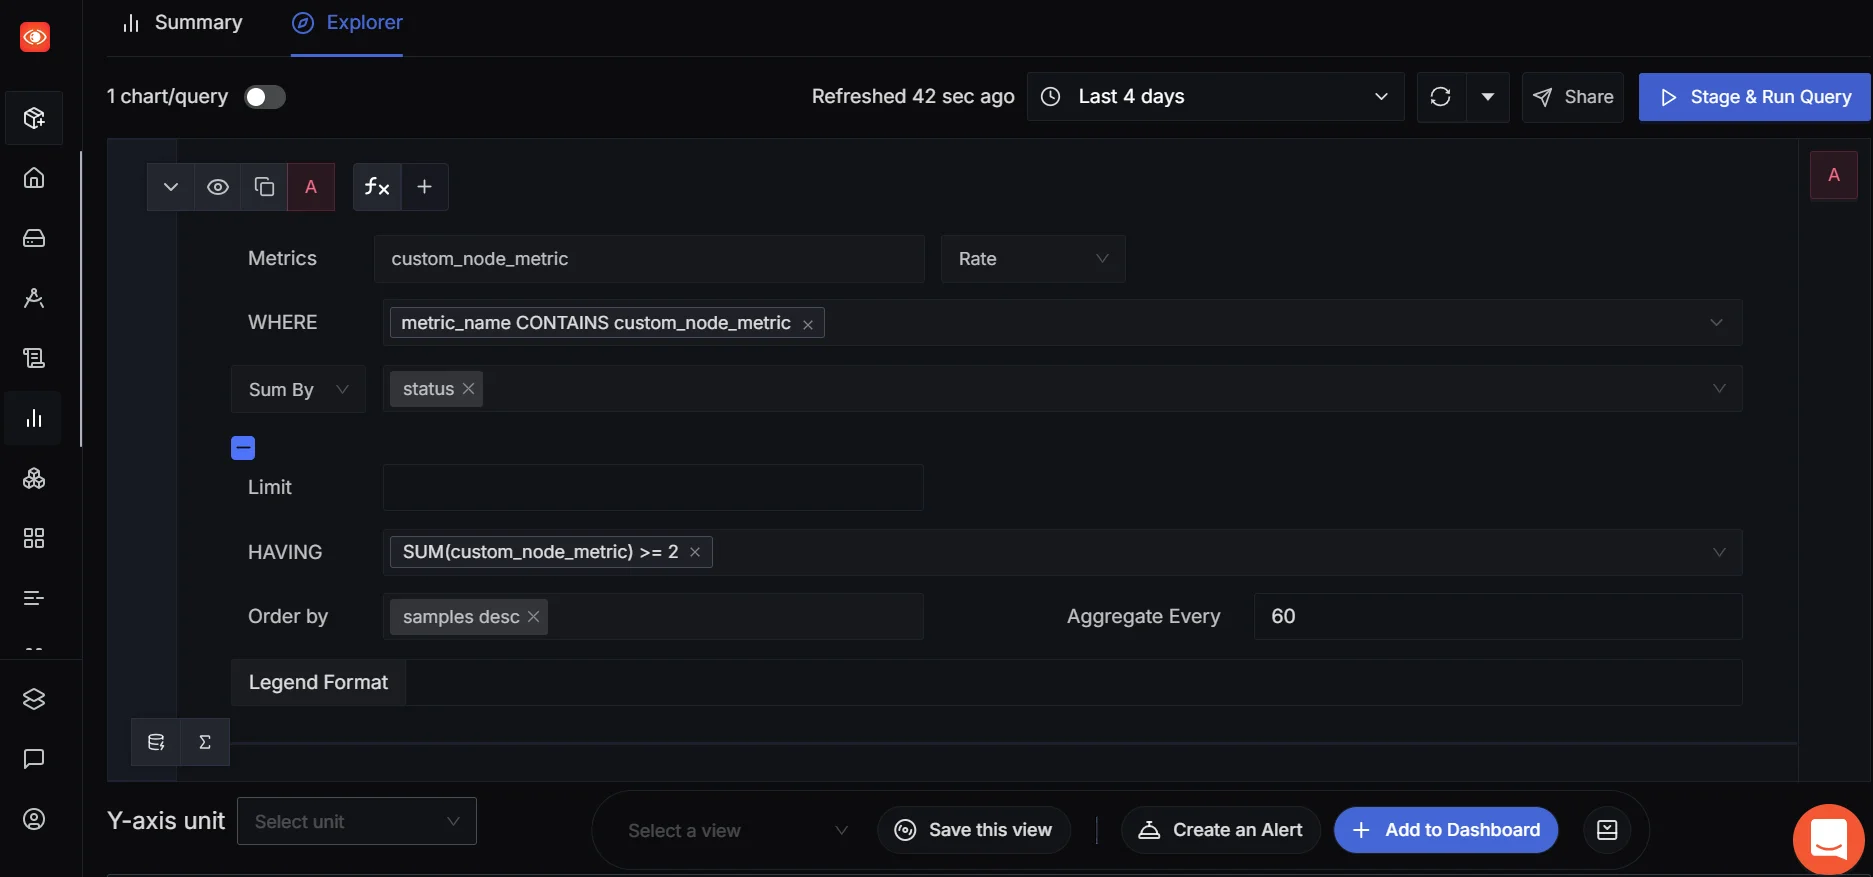
To do this, you can use SigNoz’s Rate function, which shows the per-second increase of your metric. In other words, how fast is the event happening?
👉 Go to Metrics → Custom Metrics, search for
custom_node_metric, and apply the Rate function.
This is useful when you're looking to monitor the speed or frequency of events over time — especially helpful in real-time systems or when you're dealing with high-throughput services.
Now, in scenarios where you care about the total number of events that happened during a time window — say, how many jobs were processed in the last 5 minutes — you can switch to using the Increase function. Increase gives you an aggregated view — it shows how much your counter metric has grown in the selected time range.
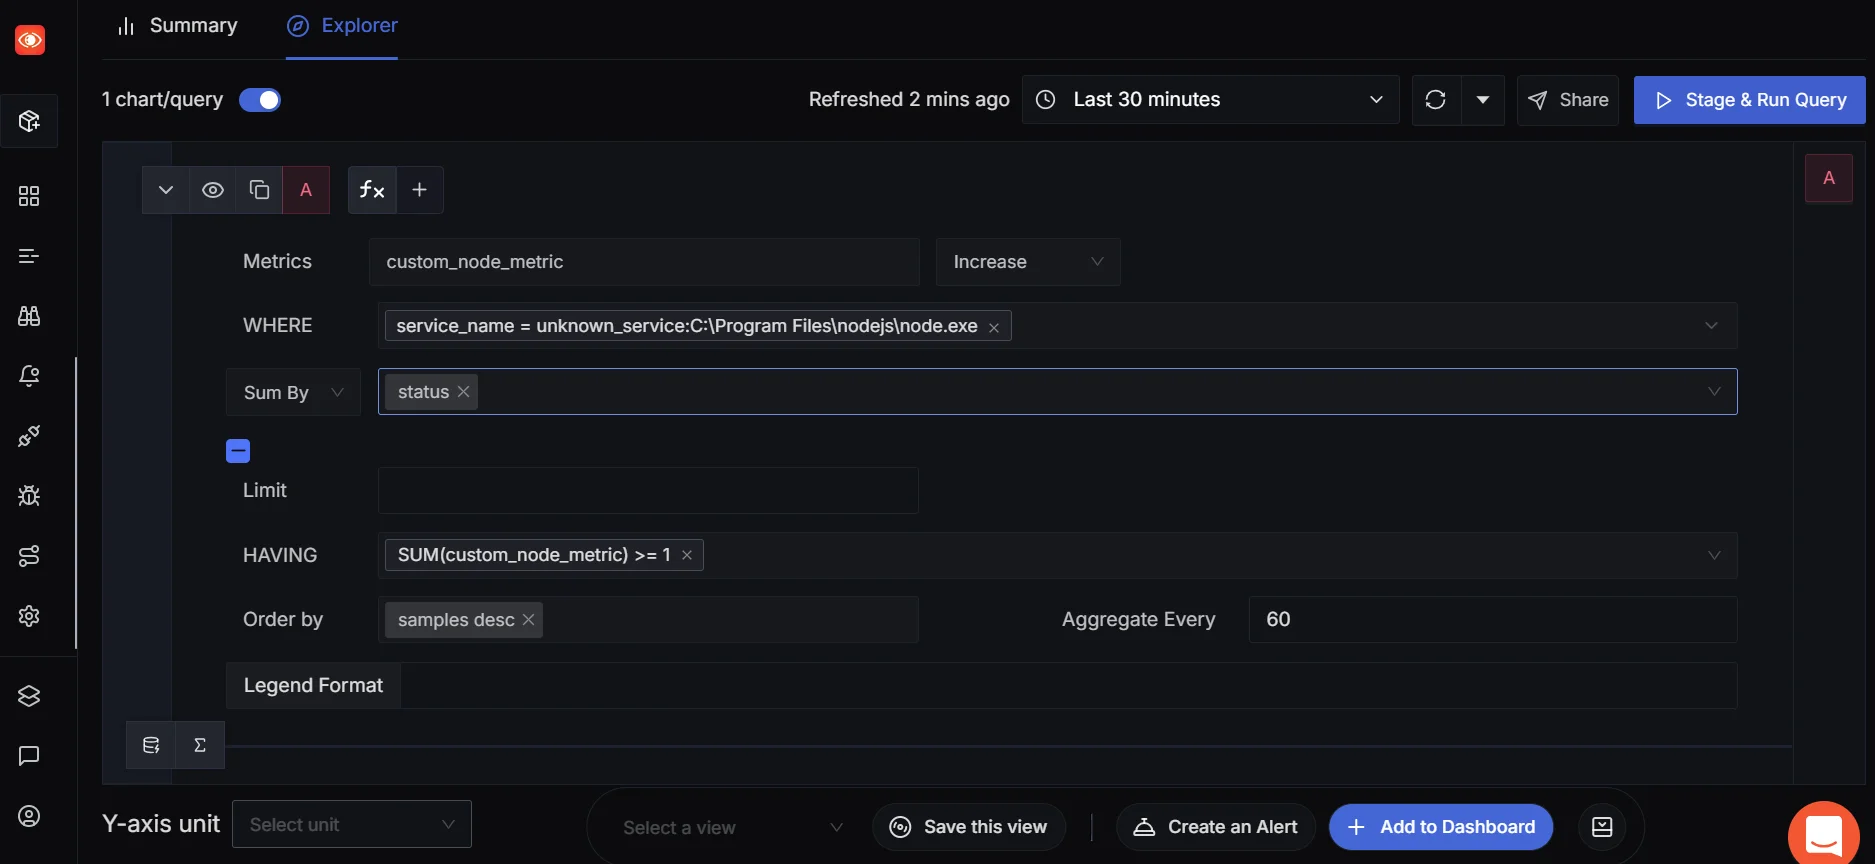
This tells you how often your custom event occurred over the past 5 minutes. It gives you a quick, aggregated view—like the number of requests handled during an alert window or a promotional campaign.
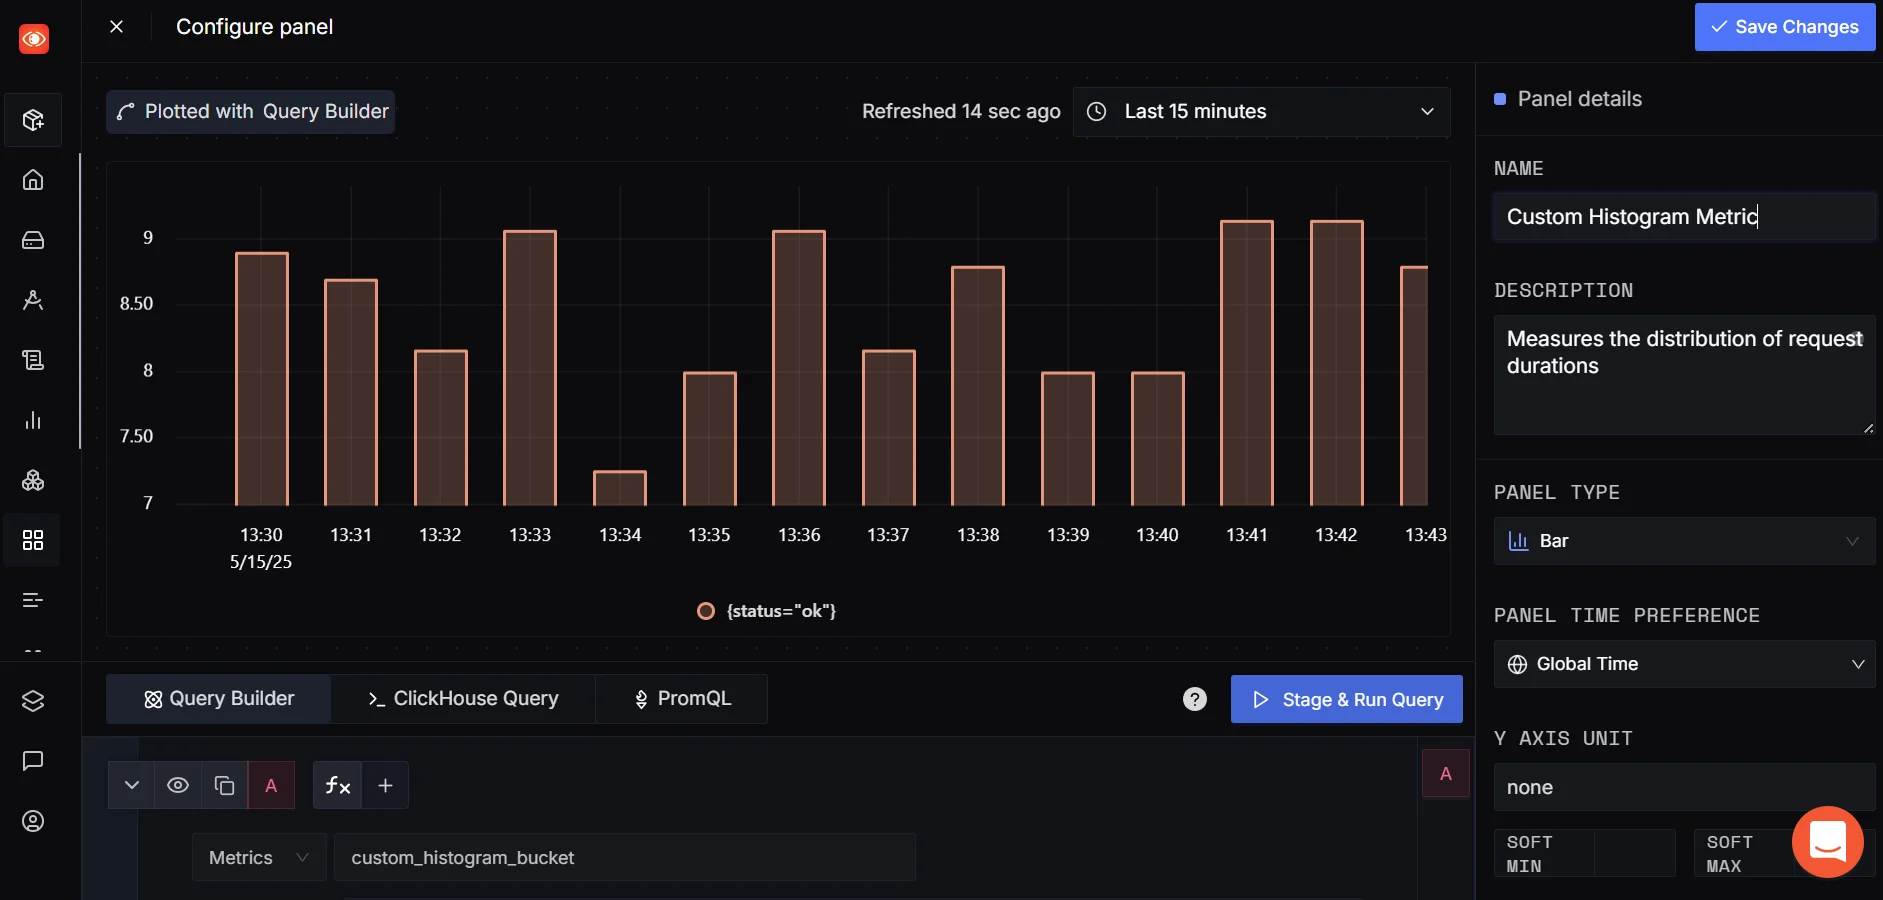
Custom Dashboards
Once you’re comfortable viewing metrics through the query builder, you might want to build a custom dashboard to visualize multiple metrics in one place.
You can add your custom metric widgets, combine them with other telemetry signals, and even switch from time series to bar charts for better comparative insights — useful for non-time-dependent visualizations like success vs. failure counts or region-wise breakdowns.
👉 SigNoz also provides a quicker way to do this via ClickHouse Queries, check out: SigNoz | Writing a metric ClickHouse Query
Set Alerts for What Matters
Once your custom metrics are flowing, you can set up alerts to catch anomalies:
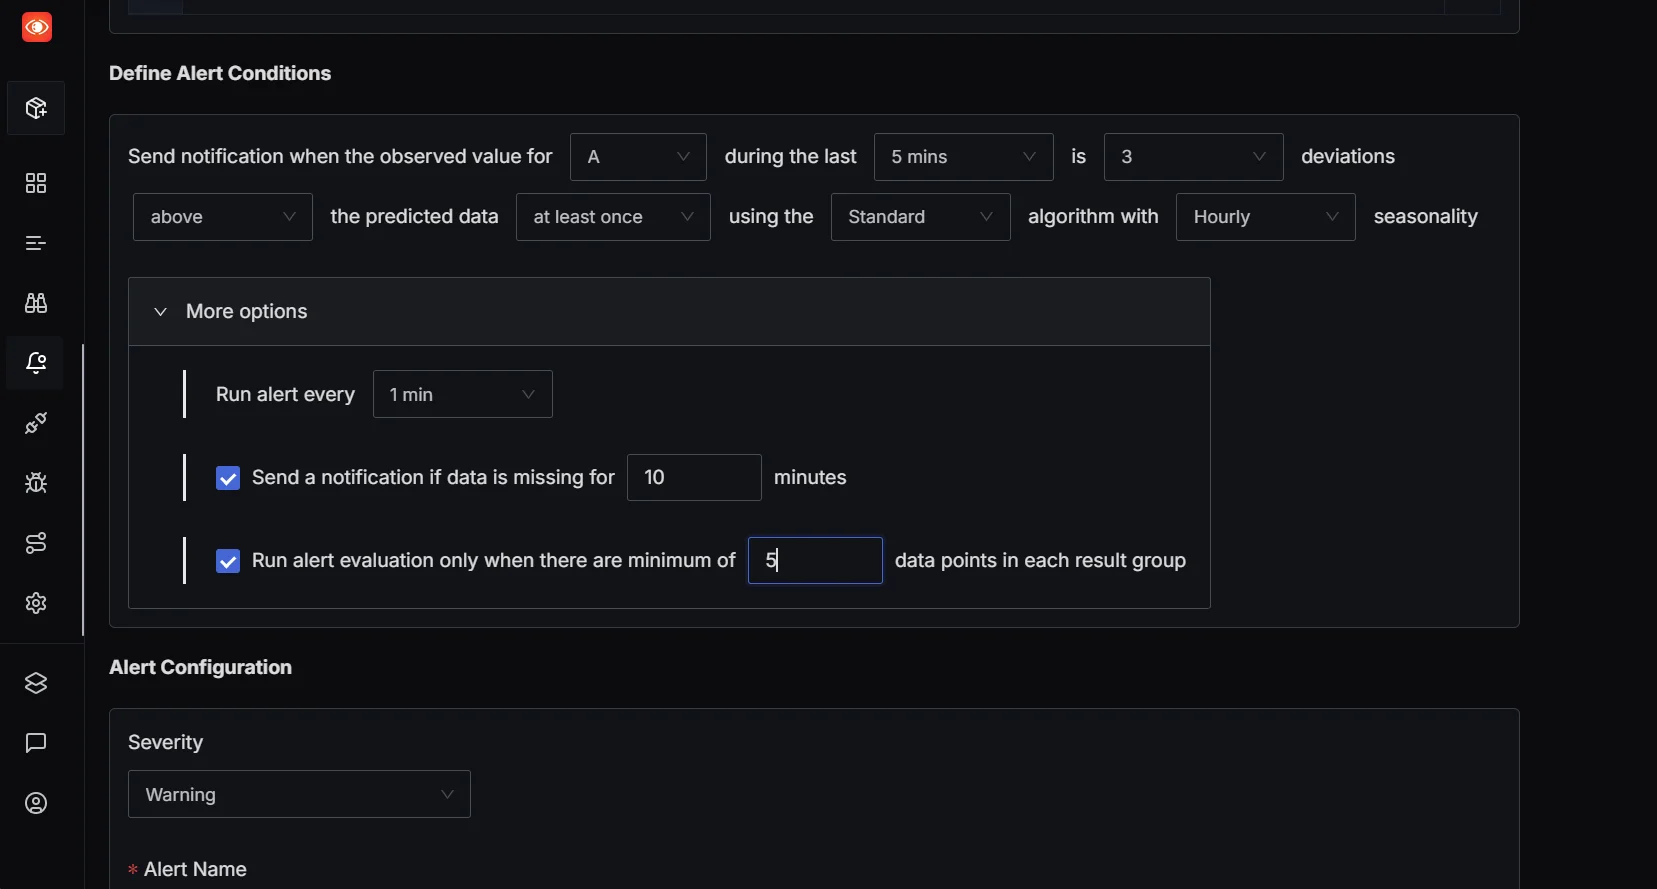
Let’s say you want to get notified if the number of processed jobs drops suddenly or if error counts exceed a threshold. SigNoz supports alerting on these metrics—so you can define thresholds (e.g., 95th percentile latency > 1s, or error count > 10/min) and get notified when something unusual happens. This ensures you're not just collecting data but actively using it to detect and respond to issues faster. Once configured, you’ll get alerted in real-time, ensuring you’re the first to know when something goes wrong.
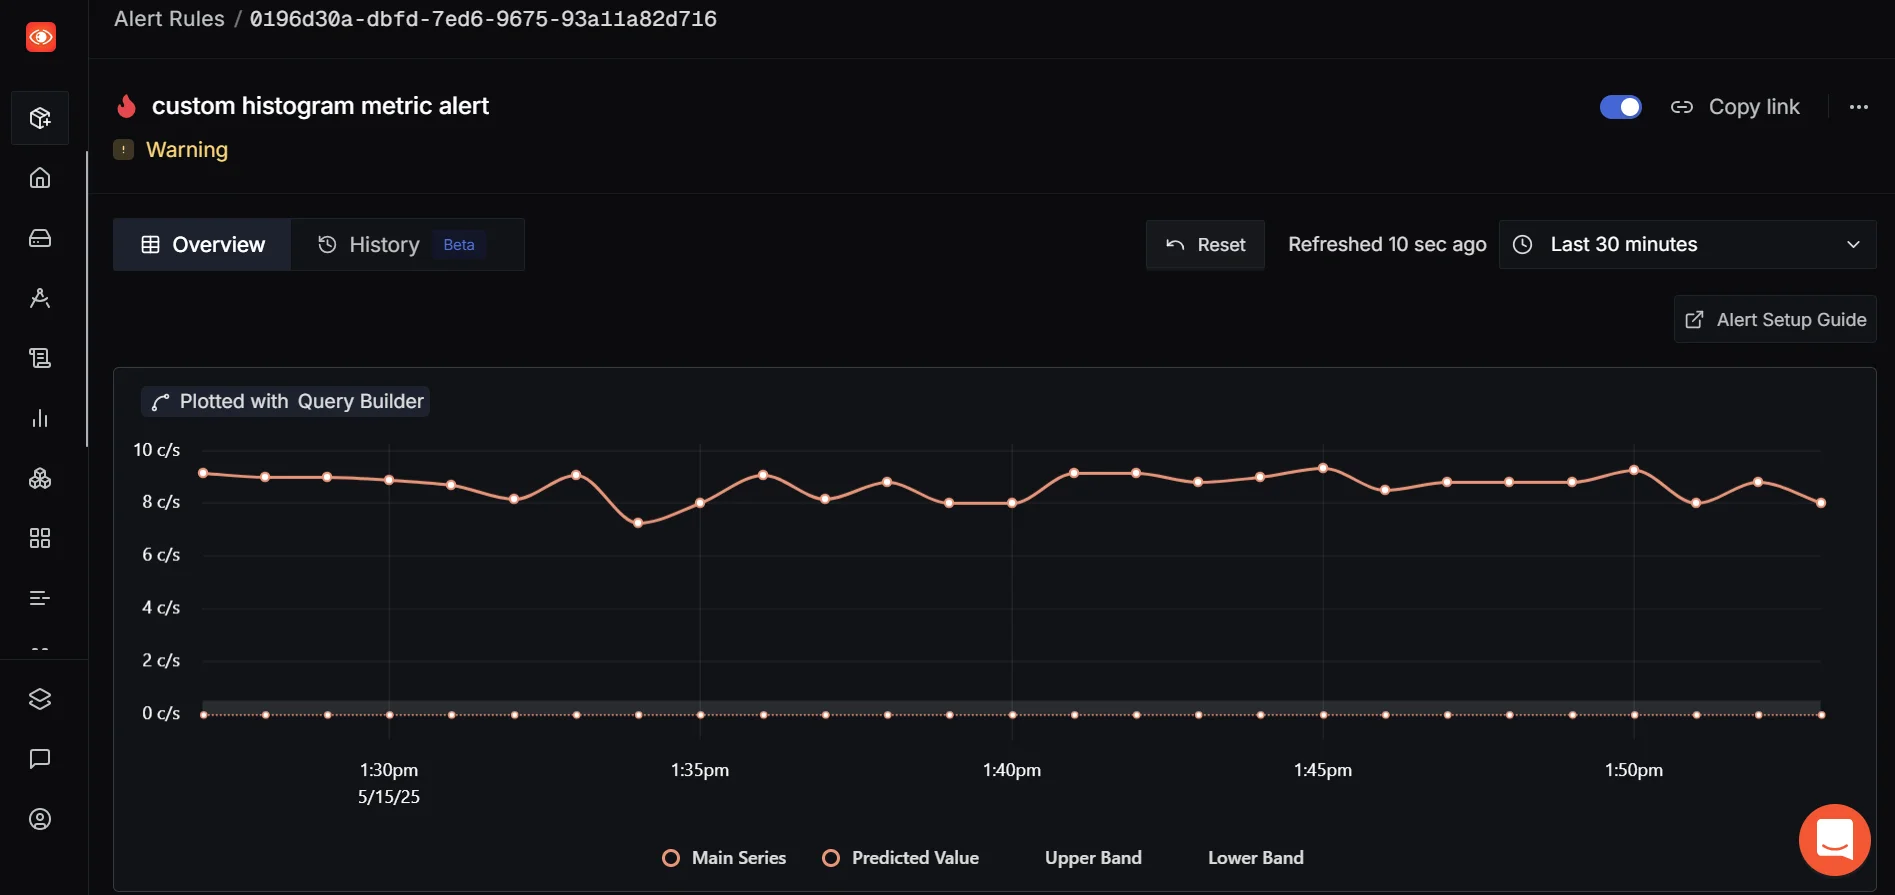
👉 For a detailed guide on setting metrics-based alerts, check out: SigNoz | Metric based alerts
Monitor Host and Kubernetes Metrics
Besides your app’s custom metrics, SigNoz can also help you keep tabs on system-level metrics like CPU usage, memory consumption, and container health through Host Metrics and Kubernetes integrations.
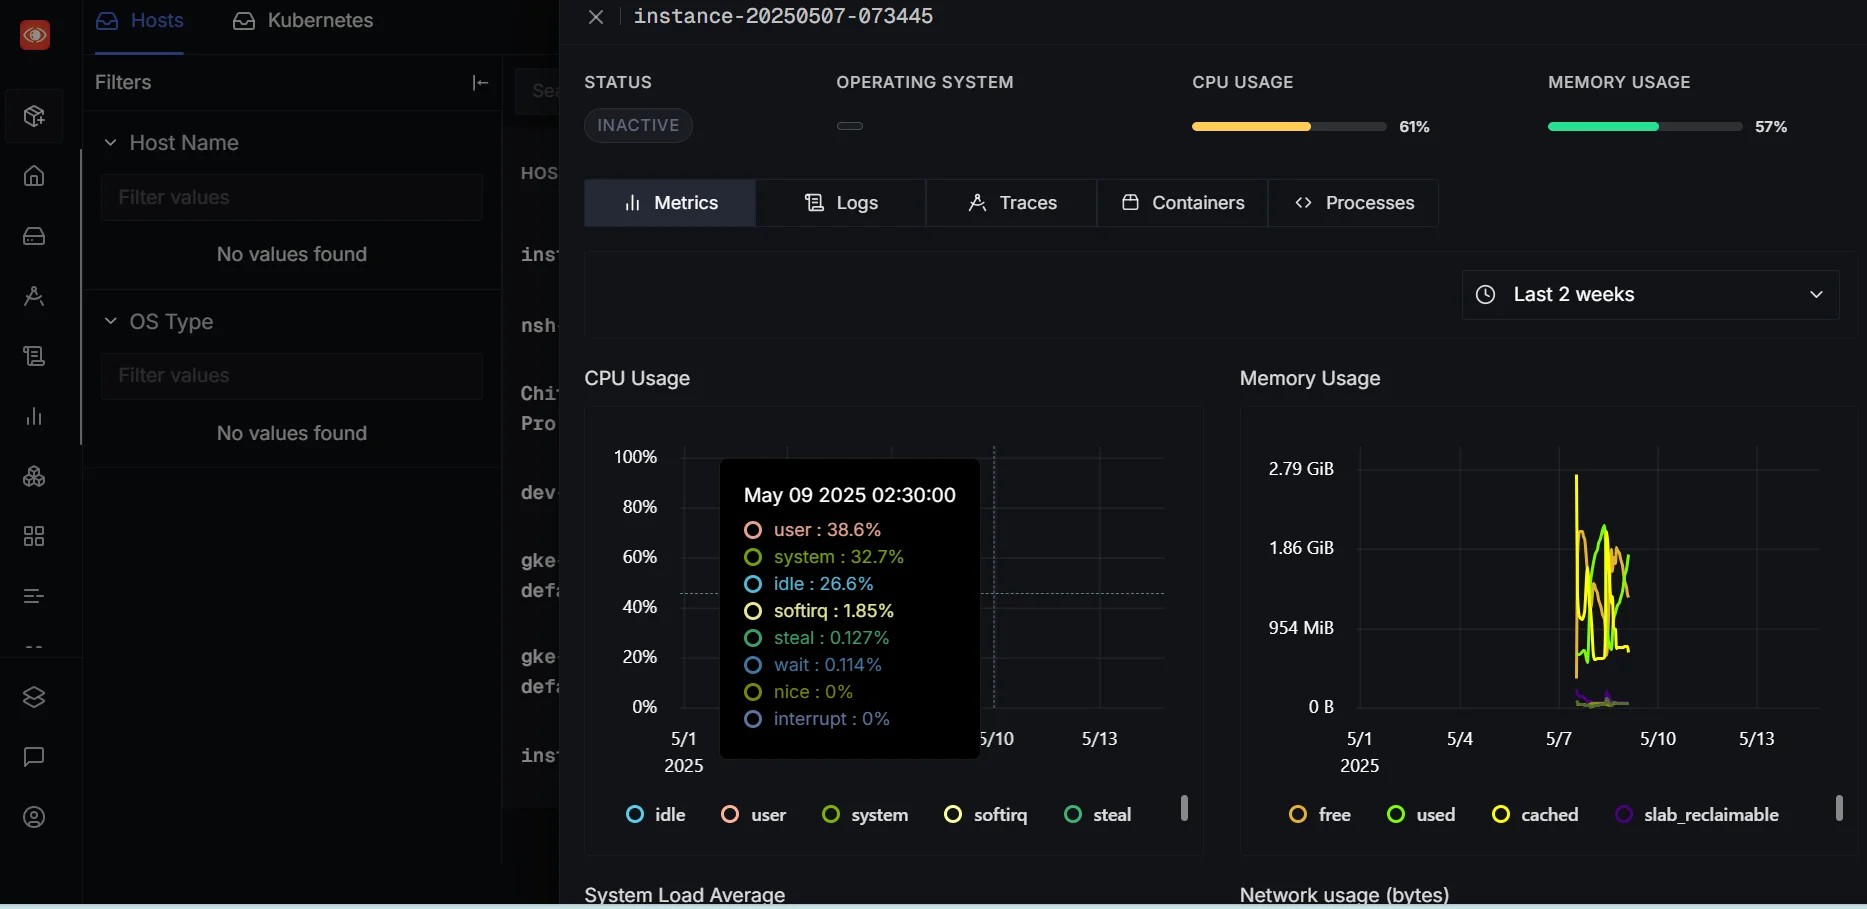
If you're running your app in production, combining system and app-level metrics gives you a more complete observability picture.
👉 For a detailed guide on enabling Host Metrics and Kubernetes monitoring, check out: SigNoz | Infrastructure Monitoring
Common Challenges in Node.js Performance Monitoring
As you implement monitoring, you may encounter these challenges:
- Microservices complexity: In distributed architectures, it’s tough to trace how a request flows across services. Accurate context propagation — especially across async calls and middleware — is key. Instrumenting core libraries like
express,http, andaxiosensures visibility into how requests move through your stack. - High-volume data: Implement sampling and aggregation to manage large amounts of monitoring data. Consider tail-based sampling if you want to retain only traces that exhibit high latency or errors, instead of sampling blindly upfront.
- Root cause analysis: Link logs to traces and use span attributes to enrich your telemetry, making incident analysis faster and more precise.
- Serverless monitoring: Serverless functions introduce unique observability gaps due to short lifespans and cold starts. Adapt your monitoring strategy for serverless Node.js deployments, which have unique characteristics.
Best Practices for Effective Node.js Monitoring
To get meaningful insights without overwhelming your system or team, it’s important to follow some practical monitoring strategies. Here are key best practices to keep your observability efforts effective and sustainable:
- Establish performance baselines: Know what "normal" looks like for your application. Track baseline values for key metrics like request latency, CPU/memory usage, and error rates over time. This helps distinguish between healthy variations and actual anomalies
- Set meaningful alerts: Configure notifications for significant deviations from your baselines such as latency spikes or memory leaks. Tools like SigNoz allow you to set alerts using functions like Rate, Increase, or Threshold with label filters for granularity.
- Conduct regular performance audits: Look for unused metrics, outdated alerts, or services with degraded performance. Regular audits help surface bottlenecks or changes in user behavior that may otherwise go unnoticed.
- Balance monitoring granularity with overhead: Instrumenting every function or route might seem like a good idea — until it starts slowing your app or flooding your observability backend. Be thoughtful about what you measure. Focus on key user flows, critical API endpoints, and backend interactions instead of tracking every heartbeat
- Limit high-cardinality labels: High-cardinality dimensions can quickly balloon the number of time series in your backend, causing performance and cost issues. Stick to bounded or low-cardinality labels where possible.
- Don’t over-instrument: It’s tempting to measure everything — but more data doesn’t always mean more insight. Instead, define your observability goals first and then instrument accordingly. Start small, iterate, and add only what drives clarity and actionability.
Comparison of Popular Node.js Monitoring Tools
Open Source
- SigNoz: A full-stack observability tool with tracing, dashboards, and alerts; free to self-host but requires setup and maintenance.
- Prometheus + Grafana: Collects metrics with flexible dashboards and alerting; great for Kubernetes users but lacks tracing/logging by default.
- Elastic APM: Integrates with the ELK stack for tracing and monitoring; powerful for logging but can be complex and resource-intensive.
- PM2: A process manager with basic monitoring and log handling; easy to use but limited APM capabilities.
Commercial
- Datadog: Offers APM, logs, infra monitoring, and ML insights; easy to set up but can be expensive at scale.
- New Relic: Full observability with AI analytics and broad integrations; powerful but has a learning curve.
- AppDynamics: Monitors business transactions and app topology; ideal for enterprises but pricey and complex.
- Dynatrace: AI-powered with real-time insights and automation; excellent for cloud-native apps but overkill for small teams.
Key Takeaways
- Node.js performance monitoring is essential for maintaining application health and user satisfaction
- Focus on key metrics like CPU usage, memory consumption, event loop lag, and I/O performance
- Implement monitoring using a combination of built-in tools, third-party libraries, and best practices
- Regular performance audits and proactive monitoring lead to better application reliability and scalability
FAQs
What are the most important metrics to monitor in a Node.js application?
The most critical metrics include CPU usage, memory consumption, event loop lag, and I/O performance. These provide a comprehensive view of your application's health and performance.
How often should I review my Node.js application's performance data?
Review your performance data regularly — daily for critical applications, and at least weekly for less critical ones. Set up alerts for immediate notification of significant issues.
Can Node.js performance monitoring impact my application's performance?
While monitoring does add some overhead, modern tools and best practices minimize this impact. The benefits of early issue detection typically outweigh the slight performance cost.
How do I choose between different Node.js monitoring tools and platforms?
Consider your specific needs, budget, and technical requirements. Evaluate factors like ease of use, integration capabilities, scalability, and support. Open-source solutions like SigNoz offer a good balance of features and flexibility for many teams.
Further Reading
Implementing OpenTelemerty in an Angular application
Tracing MongoDB calls with OpenTelemetry
