“O11y”, also known as Observability, is changing how we handle system performance.
This guide will walk you through the essentials of O11y and how to implement it effectively.
Let's dive in.
What's O11y?
O11y = Observability.
It's about understanding your system's guts from the outside.
Think of it like a doctor diagnosing you without cutting you open.
The term 'O11y' originated from the tech industry's love for abbreviations and follows the pattern of other shortened terms like 'a11y' for accessibility and 'i18n' for internationalization.
Technically, O11y refers to the ability to understand the internal state of a system based on its external outputs. In simpler terms, observability allows you to answer the question, "What's happening inside my application?"
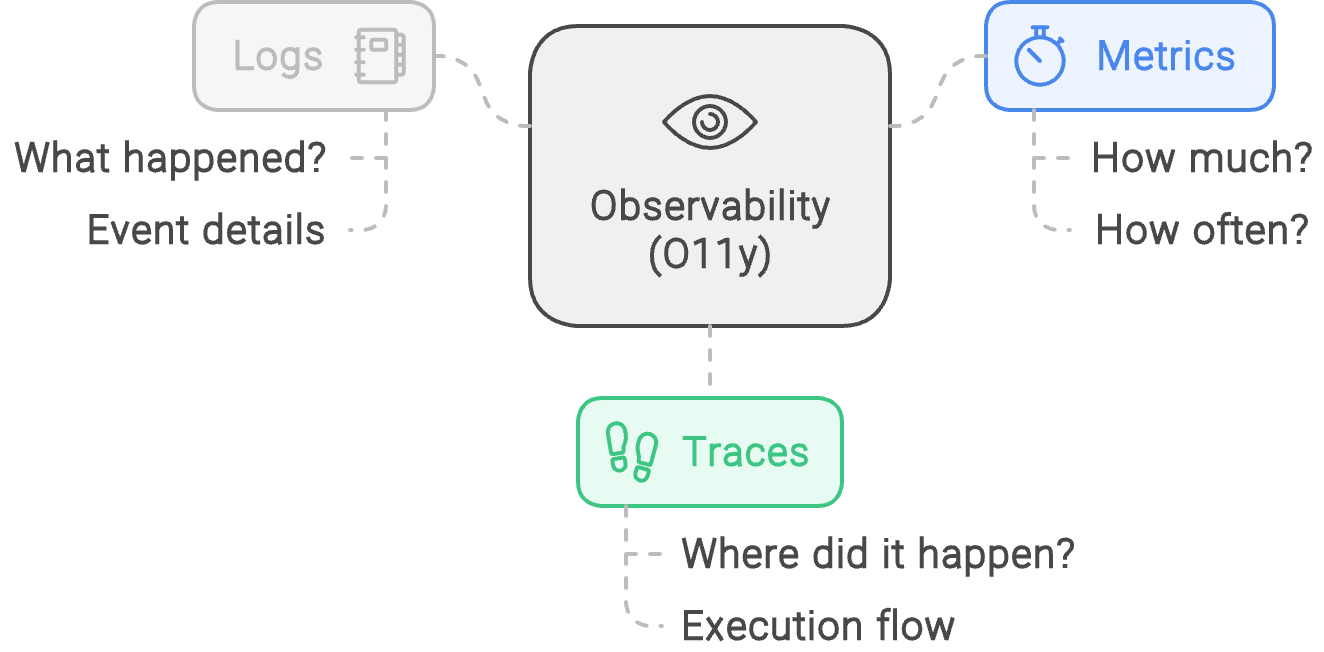
Traditionally, O11y has three main parts:
- Logs: What happened?
- Detailed records of events within your system.
- Metrics: How much and how often?
- Numerical representations of data measured over intervals of time.
- Traces: Where did it happen?
- A way to track a request as it travels through different parts of your system, like following a trail of breadcrumbs. Helpful in distributed systems.

But observability is much more than that. At its root, it’s about building more resilient applications, and when things break, it’s about surfacing issues so that they can be resolved quickly.
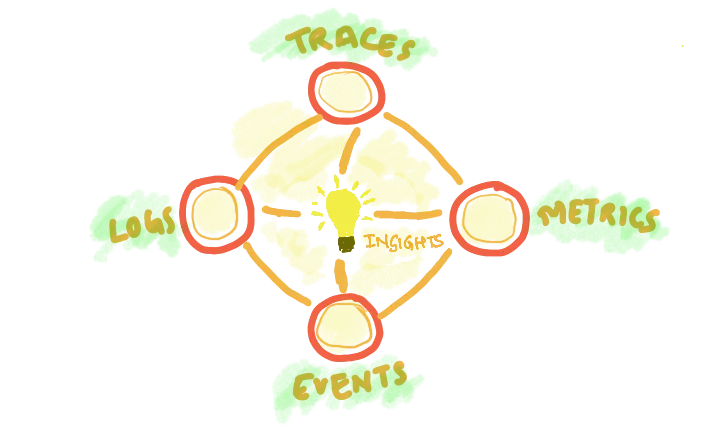
We believe the three "pillar" analogy for observability can be limiting. Instead of viewing logs, metrics, and traces as separate entities, we see observability as an interconnected network of signals that work together to provide a comprehensive view of your system's health and performance.
Beyond the Three Pillars: A Holistic Approach to Observability
While logs, metrics, and traces are indeed crucial components of observability, thinking of them as isolated pillars can create a false dichotomy. In reality, these signals are deeply interconnected:
- Application metrics can be derived from trace span data.
- Logs and events can be embedded within traces for added context.
- Log data can be aggregated to create meaningful metrics.
- Trace data can be used to generate granular, attribute-based metrics.

A better model where all signals come together to give insights to users
At SigNoz, we envision observability as a mesh or network rather than a set of pillars. This interconnected approach allows for more powerful correlations and faster problem-solving.
The Power of Correlation in Observability
When troubleshooting complex systems, the ability to correlate different signals is crucial. For example:
- You notice increased latency in your trace data.
- Correlated infrastructure metrics might reveal CPU saturation on a particular VM.
- Logs from the affected service could indicate a mutex locking problem.
By viewing all these signals in context, you can quickly pinpoint the root cause of issues.
Why Should You Care About O11y?
Ever been woken up at 3 AM because your system crashed? O11y helps prevent that.
With O11y, you can:
- Spot issues before users do: O11y provides real-time insights into your system's health, allowing you to proactively address issues before they impact users.
- Fix problems faster: With comprehensive observability, you can quickly identify the root cause of problems, reducing mean time to resolution (MTTR).
- Make your system run smoother: O11y data drives informed decision-making for system improvements and innovations.
- Prove your system is working (or not): It helps you understand how your system performs under various conditions, enabling you to optimize for better user experiences.
It's not just about looking good to your boss. It's about sleeping better at night.
Getting Started with O11y
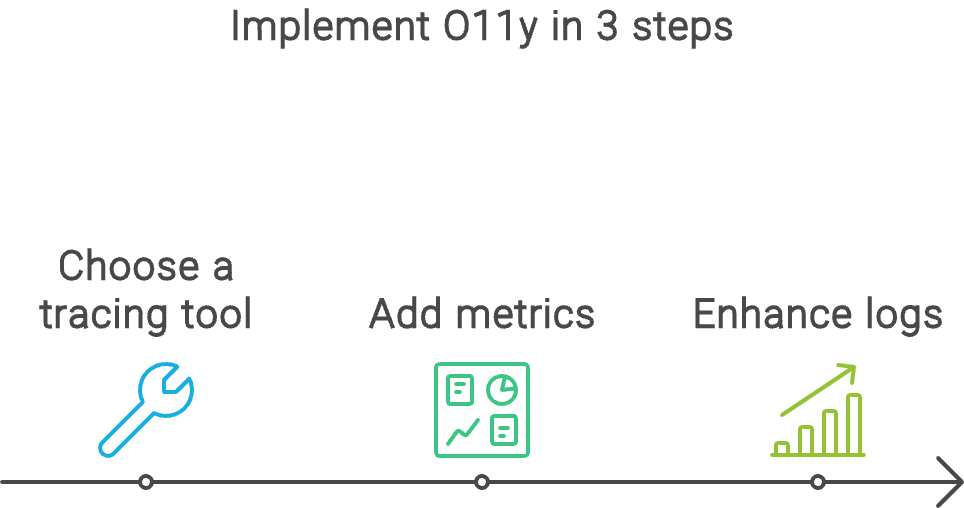
Implementing O11y doesn't have to be overwhelming. Here's a step-by-step approach:
- Start with tracing
- Pick a tool (OpenTelemetry is solid)
- Instrument your code to create spans for important operations.
- Configure a trace exporter to send data to your chosen backend.
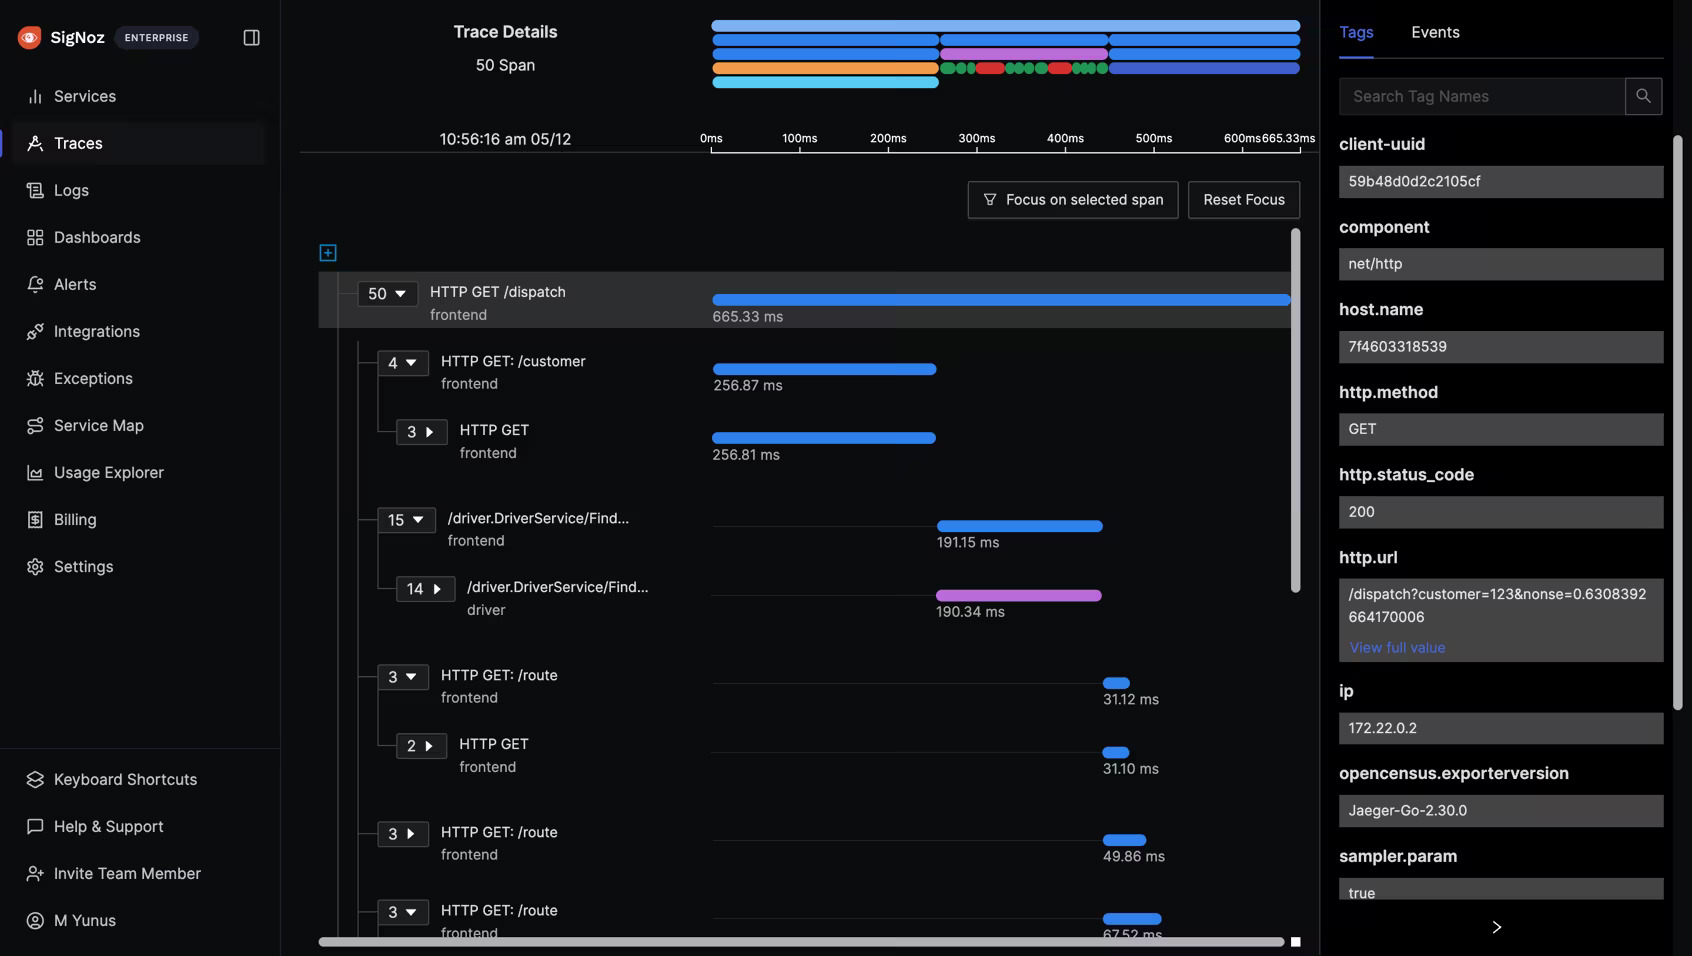
- Visualize and analyze your traces.
- Add some metrics
- Figure out what numbers matter to you (KPIs for your system)
- Implement metric collection for these KPIs (e.g., request rate, error rate, latency).
- Use tools like Prometheus to scrape and store metrics.
- Create dashboards to visualize your metrics.
- Enhance your logs
- Structure them to make them easily parsable (no more spaghetti logs)
- Link them to your traces using traceID
- Use log aggregation tools to centralize and analyze your logs.

Getting started with O11y
O11y Tools You Should Know
There's a whole buffet of O11y tools out there, here are some popular ones:
- Tracing: Jaeger, Zipkin
- Metrics: Prometheus, Grafana
- Logging: ELK Stack
- All-in-one: OpenTelemetry, SigNoz
Pro tip: Consider starting with free tiers or open-source options like SigNoz to experiment before committing to a paid solution.
OpenTelemetry: The Foundation of Modern Observability
OpenTelemetry has emerged as a game-changer in the world of observability. This open-source project provides a standardized way to collect and export telemetry data, making it easier than ever to implement comprehensive observability across your entire stack.
SigNoz fully embraces OpenTelemetry, leveraging its powerful instrumentation capabilities to provide deep insights into your systems. By using OpenTelemetry, you can:
- Instrument your applications with a single set of APIs and SDKs.
- Collect consistent, high-quality telemetry data across all your services.
- Easily switch between observability backends without changing your instrumentation.
Implementing O11y with SigNoz and OpenTelemetry
SigNoz makes O11y easy (It's open-source, so no selling your kidney). Here's how:
- SetUp SigNoz
- Instrument your app
- Use OpenTelemetry SDKs to instrument your app.
- Add a few lines of code
- Watch the magic happen
- Use the dashboard
- See all your traces, metrics, and logs in one place
- Set up alerts (so you can sleep at night)
- Impress your team with your newfound powers.

O11y Best Practices
To make the most of your O11y implementation:
Do's:
- Start with critical systems and gradually expand
- Focus on metrics that directly impact user experience
- Be mindful of high cardinality data, which can increase costs and complexity.
- Define and use Service Level Objectives (SLOs) to set performance targets.
Don'ts:
- Don't try to observe everything at once
- Don't ignore the data you collect
- Don't forget about privacy and compliance
Common O11y Headaches (and How to Cure Them)
Common challenges in O11y implementation include:
- Data overload: Prioritize the most important metrics and gradually expand.
- Cost management: Start with open-source tools and scale as needed.
- Team adoption: Show the value through reduced downtime and faster issue resolution.
- Complexity in microservices: Use service mesh technologies to simplify observability in distributed systems.
- Data privacy: Implement data anonymization and follow compliance guidelines.
- Skill gaps: Invest in training and leverage community resources.
Real-World O11y Applications
Many companies have successfully implemented observability to improve their systems:
- Netflix uses observability to ensure smooth streaming experiences for millions of users.
- Uber leverages observability to optimize ride dispatching and maintain service reliability.
- GitHub employs observability to quickly detect and resolve issues in its global code hosting platform.
As systems continue to grow in complexity, observability will play an increasingly crucial role in maintaining reliability and performance.
The future? More AI, more automation, and more sleep for on-call engineers.
For more real-world examples and detailed case studies on how companies are implementing observability, check out the SigNoz case studies.
Key Takeaways
- O11y = understanding your system from the outside
- Start with tracing, then add metrics and logs
- Use tools like SigNoz to make your life easier
- Start small, focus on what matters
- O11y is not just for the big players - it's for anyone who wants to sleep better at night
FAQs
How is O11y different from monitoring?
O11y provides deeper insights into system behavior, allowing you to understand why issues occur, not just that they occurred.
Is O11y necessary for small systems?
Yes, implementing O11y early can prevent future headaches as your system grows.
How can I manage the cost of O11y?
Start with open-source tools and focus on the most critical metrics. Scale your O11y practices as your system and budget grow.
Resources
O11y is your system's health tracker. Start now, thank yourself later.
SigNoz cloud is the easiest way to run SigNoz. Sign up for a free account and get 30 days of unlimited access to all features.
You can also install and self-host SigNoz yourself since it is open-source. With 20,000+ GitHub stars, open-source SigNoz is loved by developers. Find the instructions to self-host SigNoz.
