Choosing the right APM tool is critical. How do you know which is the right one for you? Here are the top 13 open-source application performance monitoring(APM) tools that can solve your monitoring needs.
Open-source APM tools have added benefits over their SaaS counterparts. They are more transparent, as you can verify their source code, and you can use them without going through the pains of obtaining approvals usually required for using a third-party vendor tool.
List of top open-source APM tools
Full-Stack Observability (Metrics, Traces, Logs):
- SigNoz: Integrates metrics, traces, and logs in one platform, with strong OpenTelemetry support.
Visualization & Dashboards:
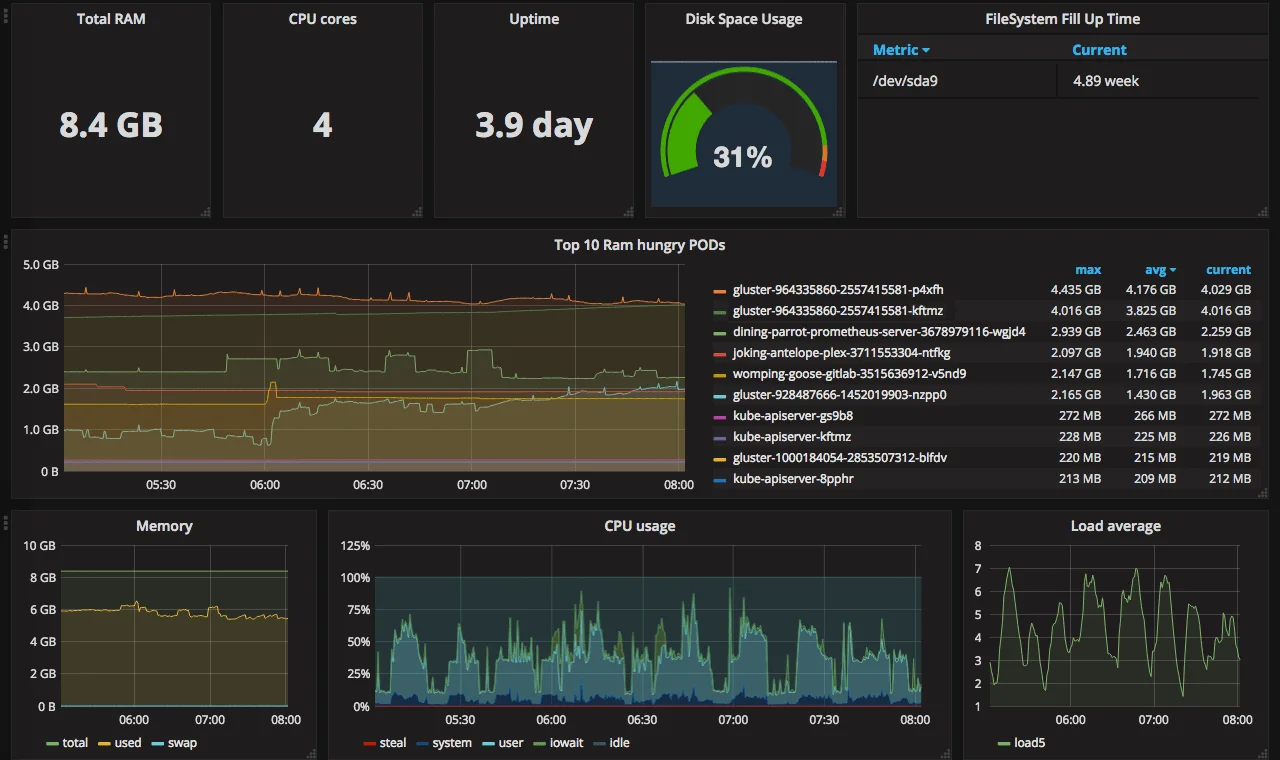
- Grafana: Highly flexible dashboards that connect to numerous data sources.
Distributed Tracing Focused (but often with metrics):
- Jaeger: End-to-end transaction tracing for microservices.
- Zipkin: Helps visualize and troubleshoot latency in distributed systems.
- Apache SkyWalking: APM with a strong focus on tracing in microservice architectures, also offering metrics and logging analysis.
Metrics & Monitoring:
- Prometheus: Powerful time-series database and alerting system.
- Graphite: Simple and scalable for storing and graphing metrics.
Java-Focused APM:
- Pinpoint: Real-time monitoring and deep tracing for Java and PHP.
- JavaMelody: Lightweight, in-process monitoring for Java applications.
- Stagemonitor: Performance analysis and monitoring for Java web applications.
- Scouter: Application performance monitoring for Java and other languages.
Elastic Stack Integration:
- Elastic APM: Seamlessly integrates APM data with Elasticsearch and Kibana.
.NET Monitoring:
- App Metrics: A library for collecting application metrics in
.NET.
Top Open Source APM Tools
Now let's explore the top 13 open-source APM tools in 2025 in detail.
SigNoz
SigNoz is a unified open-source APM tool providing metrics, traces, and logs, built on OpenTelemetry for application and infrastructure monitoring.
Pros:
- Combines logs, metrics, and traces in one place.
- Uses OpenTelemetry for vendor-neutral instrumentation.
- Offers self-hosting for data control and privacy.
Cons:
- Self-hosting can require effort and expertise.
Open source and Cloud options:
- Open Source: Free to self-host.
- Cloud: Paid managed service.
GitHub
- Github stars: 19.1k
- Alternative to: Datadog, New Relic, Dynatrace
- SigNoz on GitHub
Best For
Teams seeking a unified observability product covering APM, logs, and infrastructure metrics with OpenTelemetry, with the flexibility of self-hosting or a managed cloud option.
SigNoz cloud is the easiest way to run SigNoz. Sign up for a free account and get 30 days of unlimited access to all features.

You can also install and self-host SigNoz yourself since it is open-source. With 20,000+ GitHub stars, open-source SigNoz is loved by developers. Find the instructions to self-host SigNoz.
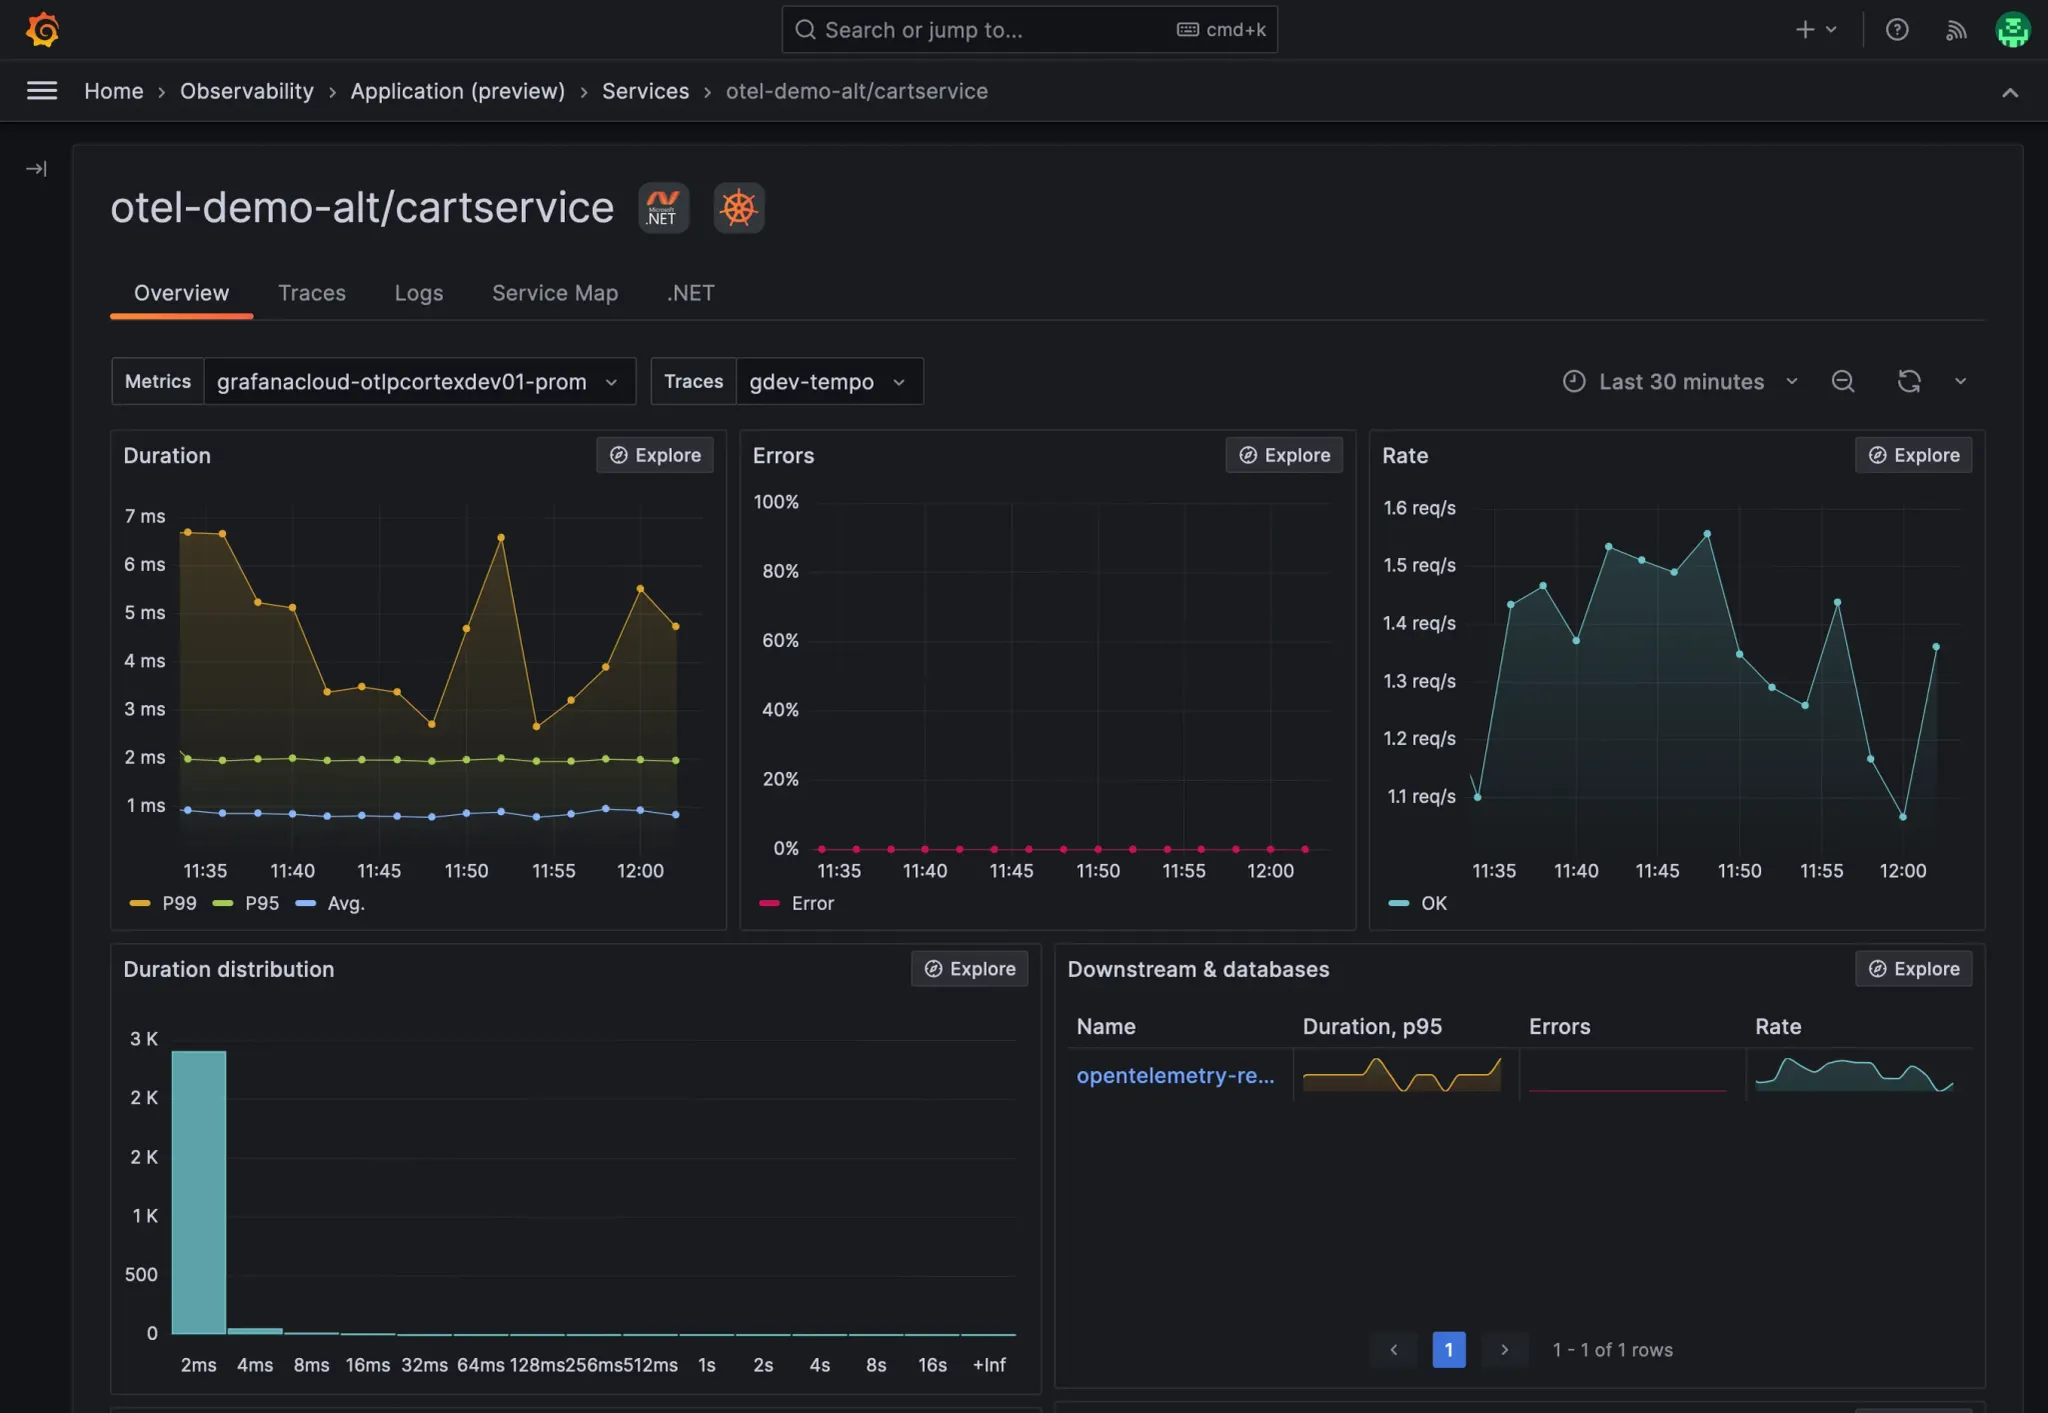
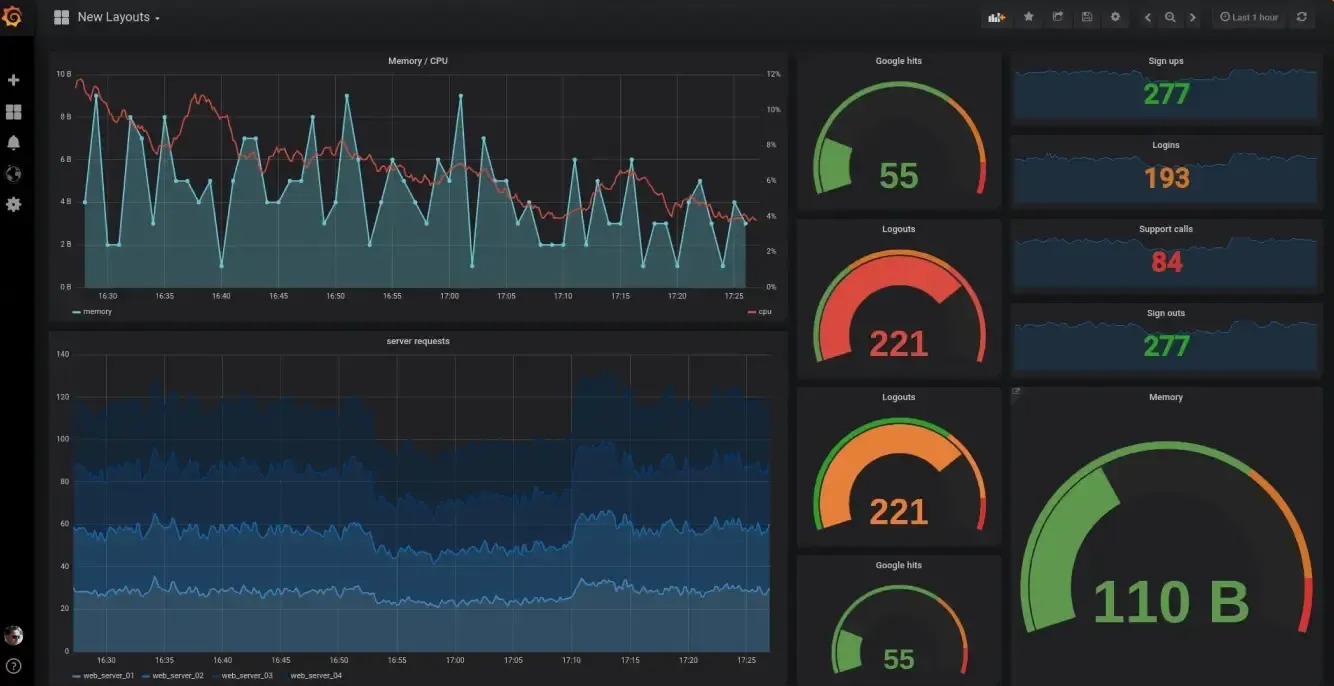
Grafana
Grafana is an open-source data visualization tool. It offers the LGTM+ stack for APM and observability. The key components in the LGTM+ stack are:
The "LGTM stack" refers to an observability platform developed by Grafana Labs that comprises Loki, Grafana, Tempo, and Mimir.
Grafana's observability platform is built on the LGTM stack:
- Loki: An efficient log aggregation system that indexes log metadata, enabling cost-effective storage and fast querying, integrated seamlessly with Grafana.
- Grafana: A versatile visualization tool offering customizable dashboards to display and analyze data from various sources, including metrics, logs, and traces.
- Tempo: A distributed tracing backend focused on scalability, storing and querying trace data, with easy integration into Grafana for visualization.
- Mimir: A long-term, scalable storage system for Prometheus metrics, ensuring high performance and availability for large-scale metric data.
The key challenge of using the LGTM+ stack as an open-source APM is to manage the individual components.
Pros:
- Highly flexible and customizable dashboards.
- Integrates with a vast range of data sources (Prometheus, Elasticsearch, etc.).
- Strong community support and extensive plugin ecosystem.
Cons:
- Not a complete APM solution out-of-the-box; requires integration with other tools for traces and logs.
- Alerting capabilities, while present, might require configuration and integration with external systems for advanced notifications.
- Primarily focuses on visualization, requiring other tools for data collection and analysis.
Open source and Cloud options:
- Open Source: Free to self-host with full visualization features.
- Grafana Cloud: Paid managed service with additional features like managed Prometheus and logs.
GitHub
- Github stars: 64.1k
- Alternative to: Datadog dashboards, New Relic insights
- Grafana on GitHub
Best For
Teams needing powerful and customizable dashboards to visualize metrics from various APM-related data sources.
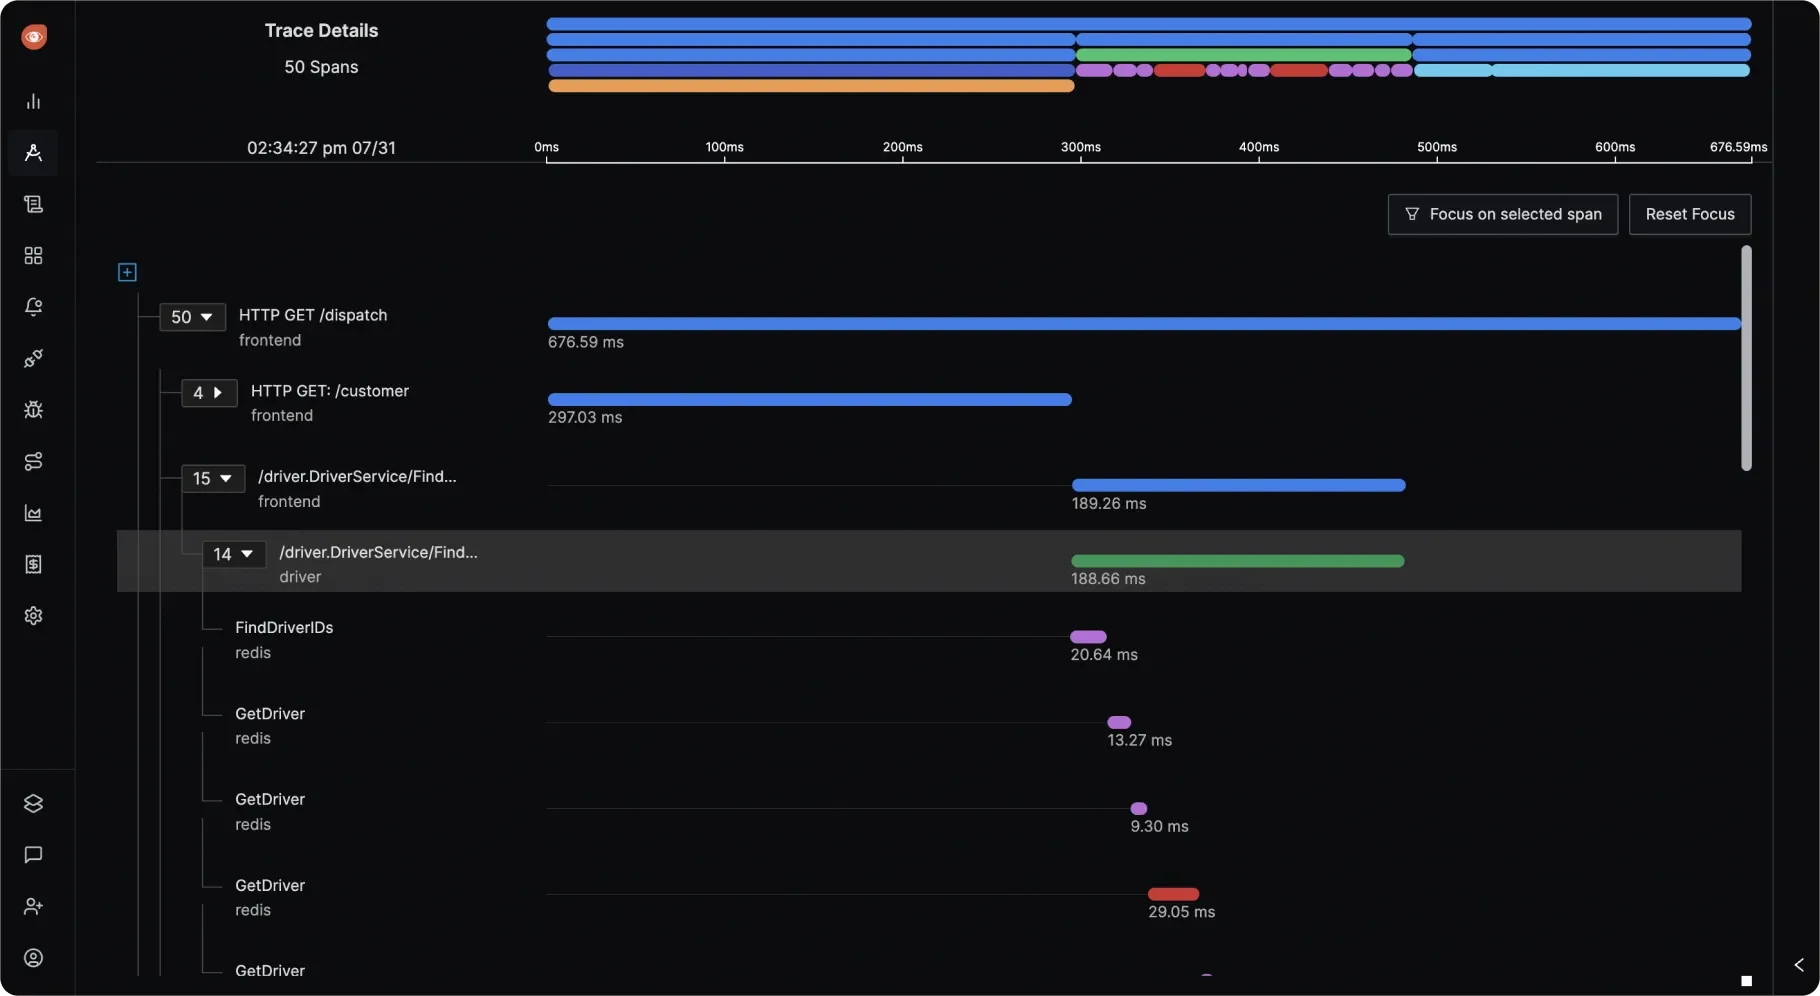
Jaeger
An open-source, CNCF-graduated distributed tracing system built to help monitor and troubleshoot microservices-based distributed systems.
Pros:
- Excellent for understanding call flows and latency in microservices.
- Provides detailed transaction tracing across services.
- Supports OpenTelemetry for data instrumentation.
Cons:
- Primarily focused on tracing; requires integration with other tools for metrics and logs.
- Setting up and managing a Jaeger backend can be complex.
- Visualization is focused on traces and might require integration with tools like Grafana for broader observability.
Open source and Cloud options:
- Open Source: Free to use and self-host.
- No official managed cloud offering by the core Jaeger project (third-party options may exist).
GitHub
- Github stars: 20.3k
- Alternative to: Zipkin, Datadog APM
- Jaeger on GitHub
Best For
Teams specifically tackling performance issues and latency in complex microservices architectures.
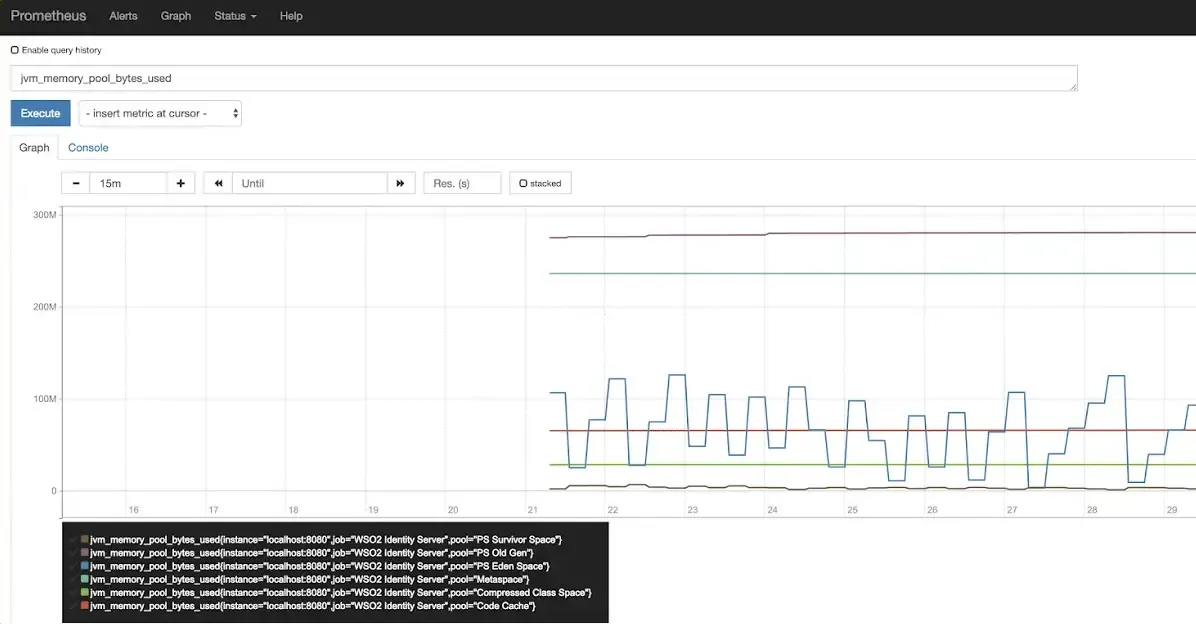
Prometheus
A popular open-source system for time-series data collection and storage, primarily focused on metrics and alerting for application and infrastructure monitoring.
The visualization layer of Prometheus is basic, but it is generally used with Grafana, a visualization tool to create charts and graphs.
Pros:
- Excellent for collecting and querying numerical time-series data.
- Powerful query language (PromQL) for flexible data exploration.
- Robust alerting system based on defined rules.
Cons:
- Primarily focused on metrics; requires integration with other tools like Jaeger for tracing and Loki for logs for full observability.
- It can be complex to set up and manage at scale.
- Visualization is often done through integration with Grafana.
Open source and Cloud options:
- Open Source: Free to use and self-host.
- Prometheus as a Service: Various cloud providers offer managed Prometheus instances.
GitHub
- Github stars: 55.3k
- Alternative to: Datadog metrics, New Relic infrastructure
- Prometheus on GitHub
Best For
Teams heavily focused on monitoring and alerting on application and infrastructure metrics.
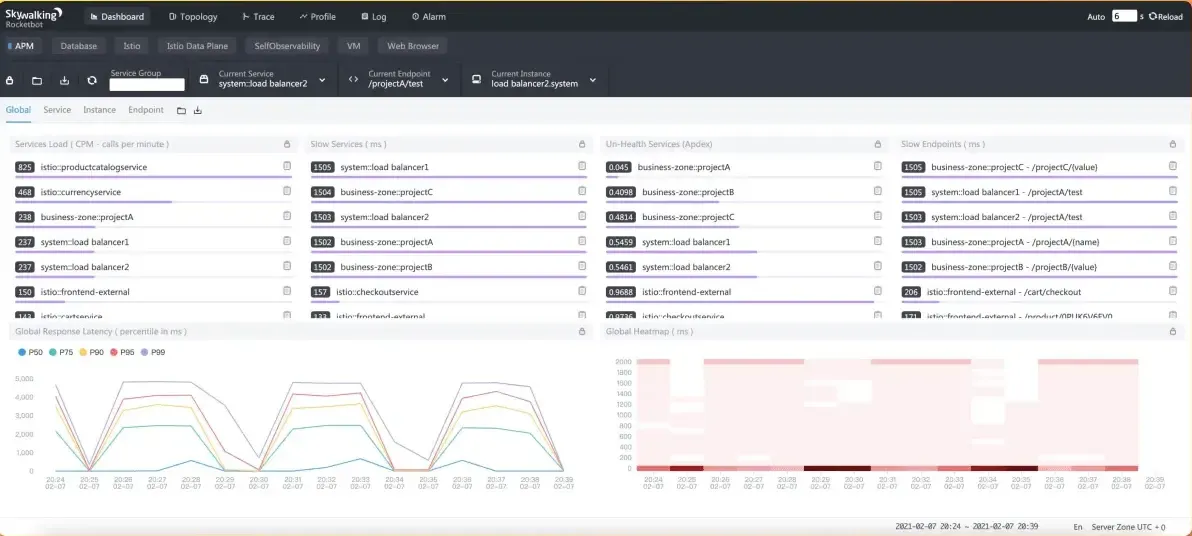
Apache Skywalking
An open-source APM system specifically designed for microservices, cloud-native, and container-based architectures, offering tracing, metrics, and logging analysis.
Pros:
- Specifically built for distributed systems and microservices.
- Provides distributed tracing, service topology maps, and metrics.
- Supports multiple languages and agents.
Cons:
- Can have a steeper learning curve compared to simpler tools.
- Might require more resources for setup and management in large environments.
- While it handles logs, it often integrates with dedicated logging systems.
Open source and Cloud options:
- Open Source: Free to use and self-host under the Apache 2.0 license.
- No official managed cloud offering by the Apache SkyWalking project (third-party options may exist).
GitHub
- Github stars: 23.8k
- Alternative to: Jaeger, Datadog APM
- Apache SkyWalking on GitHub
Best For
Teams operating complex microservices architectures needing integrated tracing, metrics, and topology visualization.
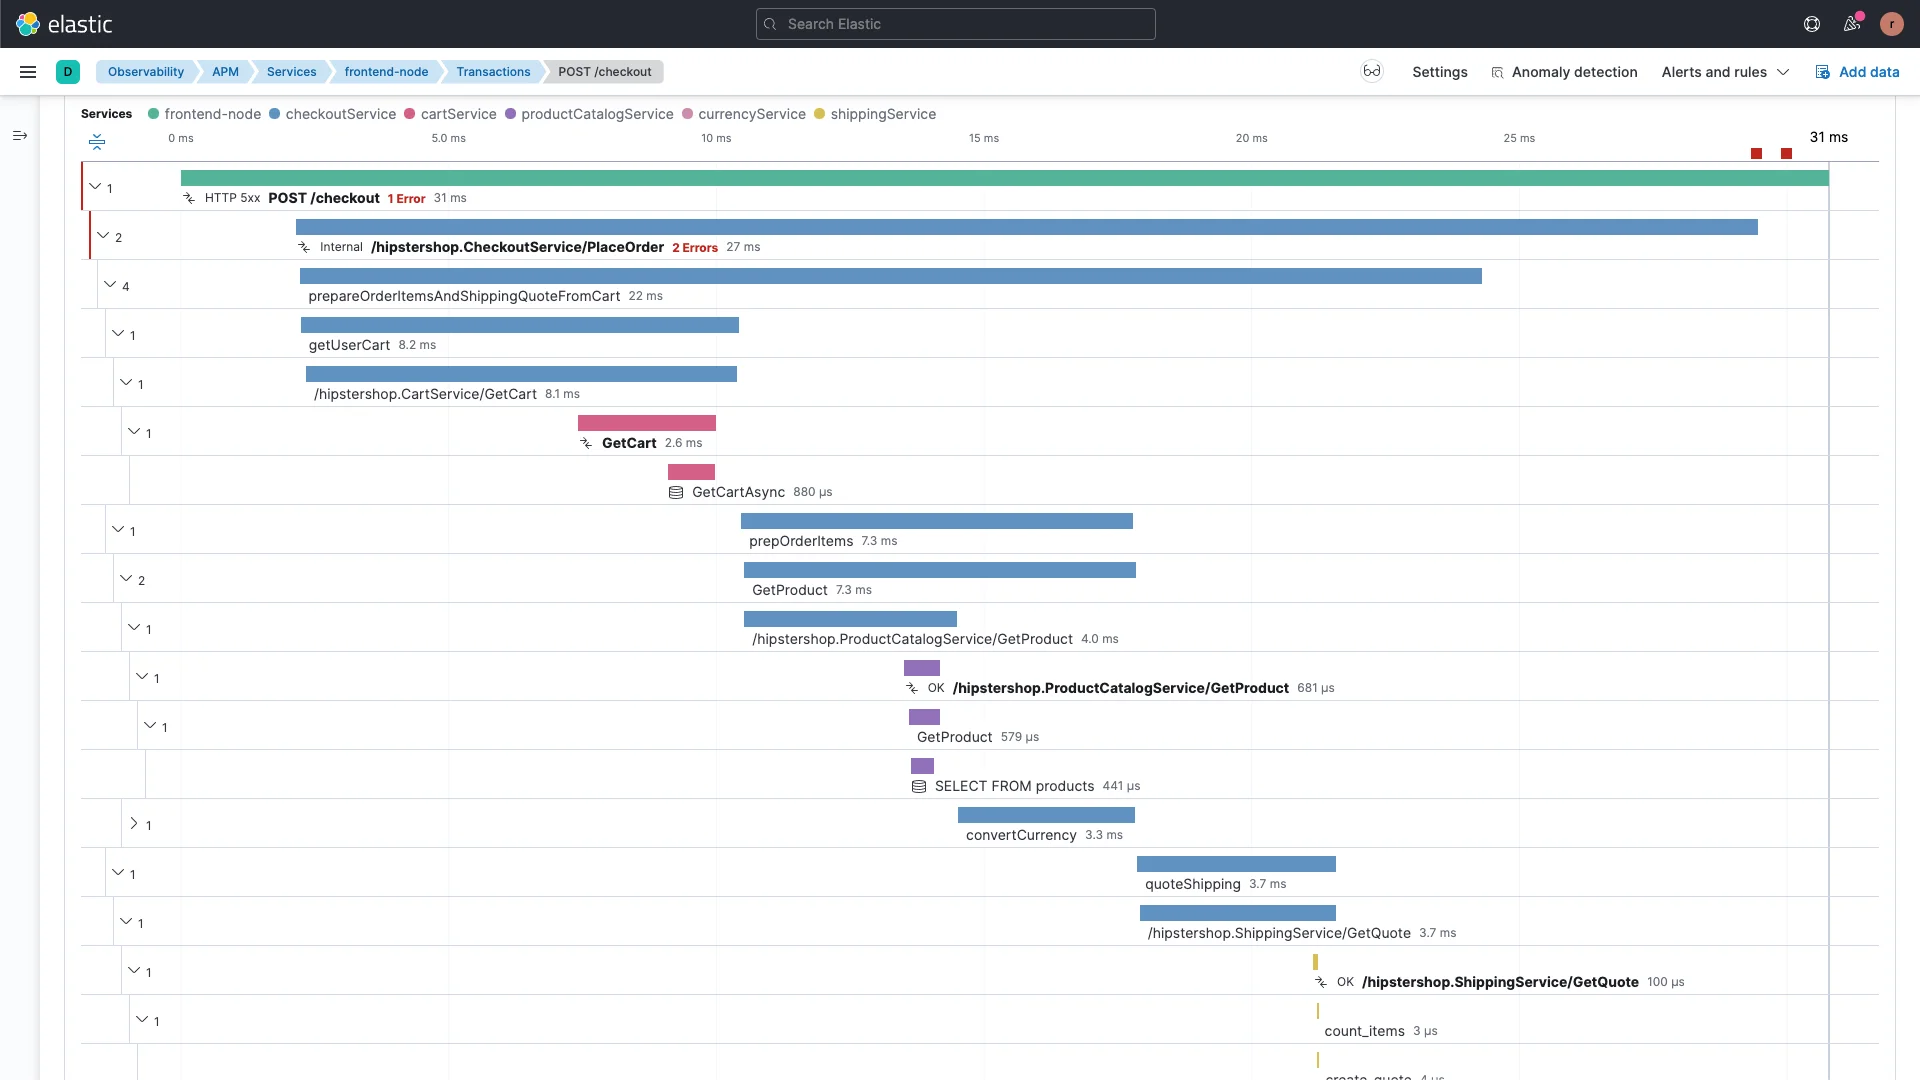
Elastic APM
The APM component of the Elastic Stack (ELK) provides application performance monitoring tightly integrated with Elasticsearch and Kibana for centralized data analysis and visualization.
Pros:
- Seamless integration with Elasticsearch and Kibana for unified logging, metrics, and traces.
- Powerful search and analytics capabilities through Elasticsearch.
- Centralized management and visualization within Kibana.
Cons:
- Requires familiarity with the Elastic Stack ecosystem.
- Can be resource-intensive, especially at scale.
- Tracing and metrics capabilities might not be as feature-rich as dedicated APM tools for specific use cases.
Open source and Cloud options:
- Open Source (Basic Features): Free to use and self-host the basic APM agents and backend.
- Elastic Cloud: Paid managed service with enhanced features, support, and scalability.
GitHub
- Github stars: 1.9k
- Alternative to: Datadog APM, New Relic APM
- Elastic APM on GitHub
Best For
Teams already heavily invested in the Elastic Stack (ELK) seeking integrated APM capabilities alongside their logs and metrics.
Graphite
A straightforward open-source tool primarily focused on storing and graphing time-series data, commonly used for infrastructure and application metrics.
Graphite consists of three software components:
- carbon - a service that listens for time-series data
- whisper - a database library for storing time-series data
- graphite-web - Graphite's user interface & API for rendering graphs and dashboards
Pros:
- Simple and relatively easy to set up and operate.
- Scalable for handling large volumes of time-series data.
- Integrates well with other monitoring and visualization tools like Grafana.
Cons:
- Primarily focused on metrics; lacks built-in tracing or logging capabilities for comprehensive APM.
- Its own dashboarding features are less advanced compared to tools like Grafana.
- Alerting often requires integration with external systems.
Open source and Cloud options:
- Open Source: Free to use and self-host.
- Hosted Graphite services are available from various providers.
GitHub
- Github stars: 5.9k
- Alternative to: Prometheus, InfluxDB
- Graphite on GitHub
Best For
Teams needing a simple, scalable backend for storing and visualizing time-series metrics, often in conjunction with Grafana.
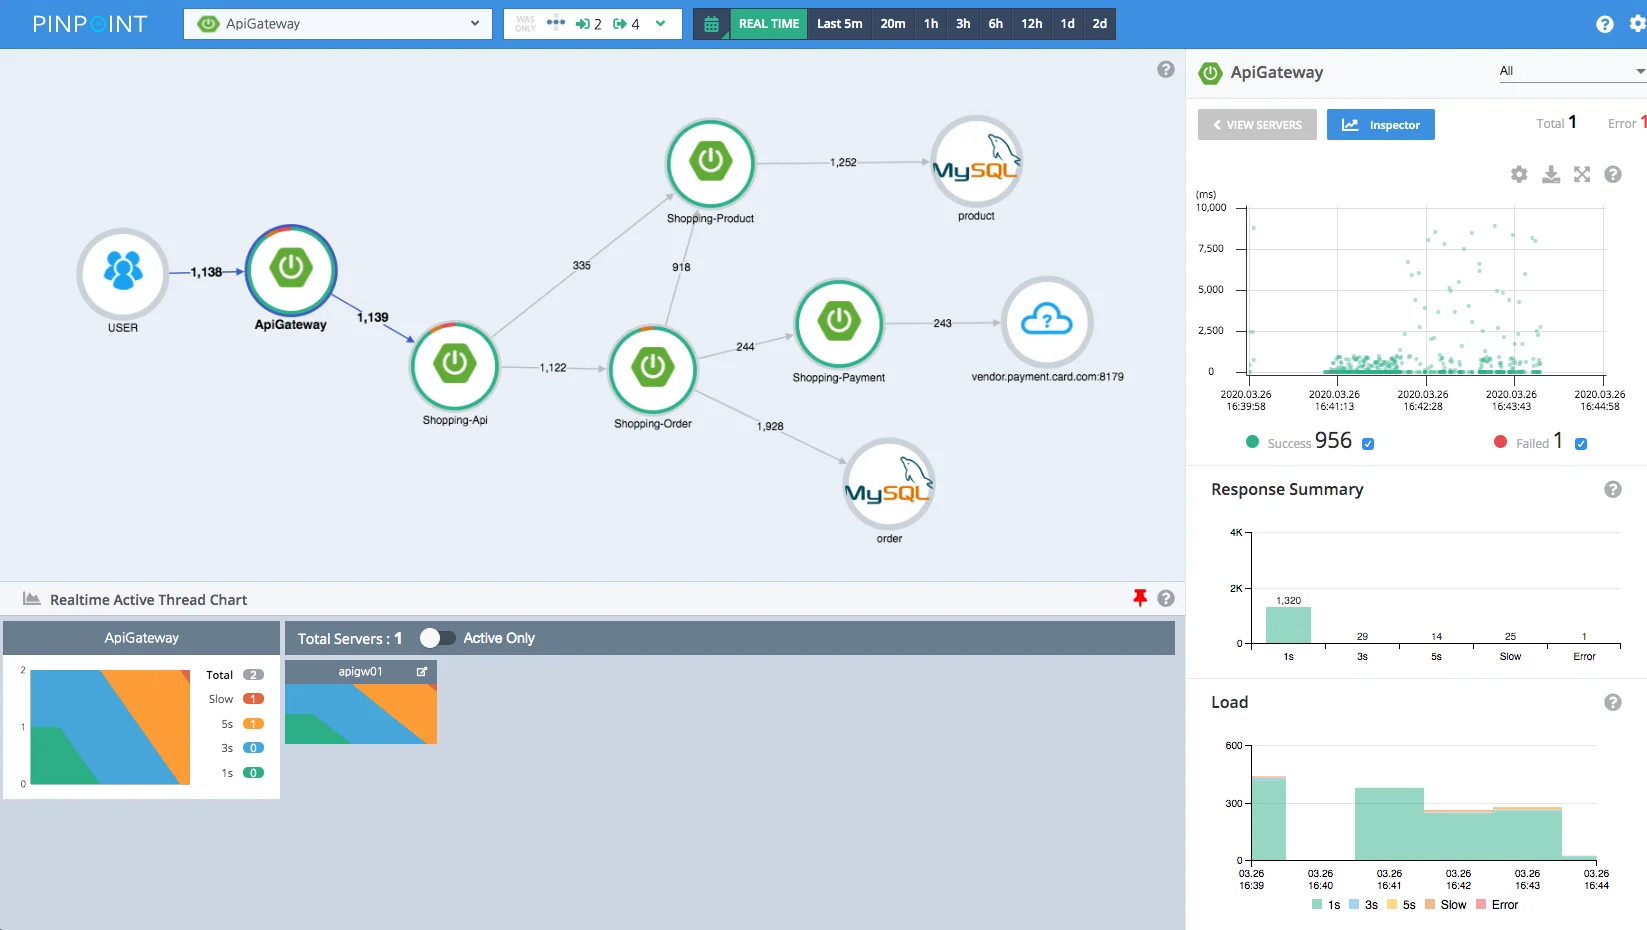
Pinpoint
An open-source APM tool primarily focused on providing deep performance analysis for Java and PHP applications, offering code-level visibility and transaction tracing.
Pros:
- Provides detailed transaction tracing and code-level insights for Java and PHP.
- Offers real-time application monitoring and performance analysis.
- Helps identify bottlenecks and performance issues within the code.
Cons:
- Primarily focused on Java and PHP; limited support for other languages.
- Setup and configuration can be complex, especially in distributed environments.
- Visualization is specific to Pinpoint and might not be as flexible as dedicated dashboarding tools.
Open source and Cloud options:
- Open Source: Free to use and self-host.
- No official managed cloud offering by the Pinpoint project (third-party options may exist).
GitHub
- Github stars: 13.5k
- Alternative to: New Relic, AppDynamics
- Pinpoint on GitHub
Best For
Teams primarily running Java and PHP applications needing deep code-level tracing and performance analysis.
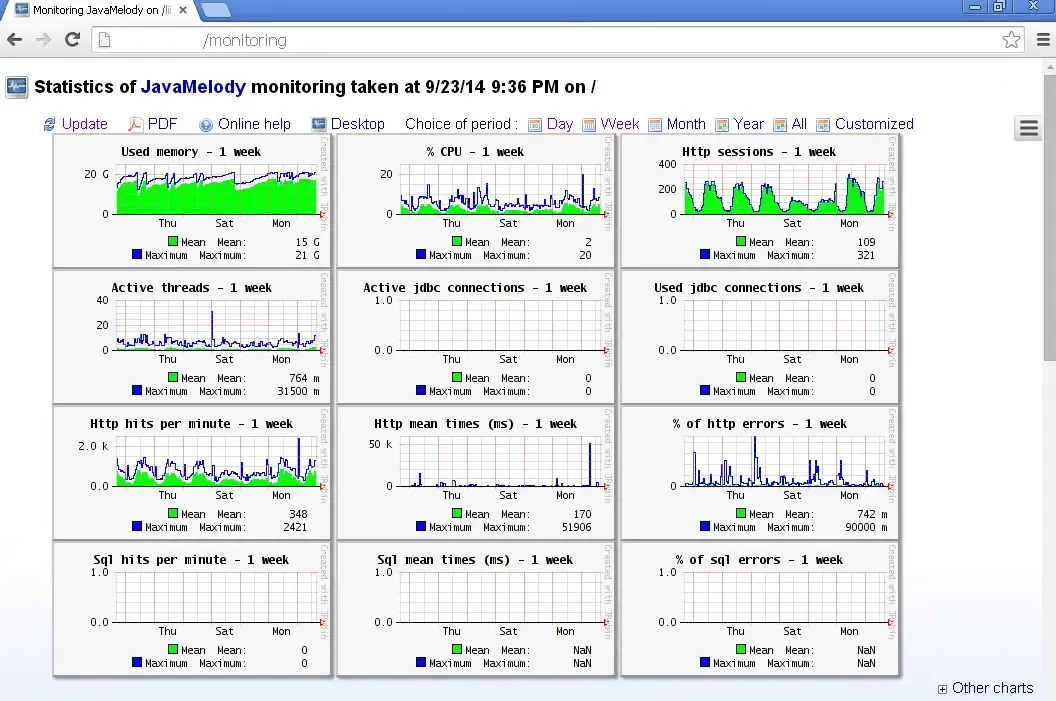
Javamelody
A lightweight, open-source monitoring and profiling tool embedded directly within Java web applications.
Pros:
- Simple to integrate into Java web applications as a JAR file.
- Provides real-time monitoring metrics on JVM, HTTP sessions, SQL queries, and more.
- Offers basic reports and graphs directly within the application.
Cons:
- Primarily focused on Java web applications.
- Visualization is basic and embedded within the application itself.
- Lacks distributed tracing capabilities for microservices architectures.
Open source and Cloud options:
- Open Source: Free to use and embed in your Java web applications.
- No cloud or enterprise versions are offered as it's designed for in-application monitoring.
GitHub
- Github stars: 2.9k
- Alternative to: New Relic, AppDynamics
- Javamelody on GitHub
Best For
Teams running standalone Java web applications who need simple, in-process monitoring and basic metrics without external infrastructure.
Stagemonitor
An open-source performance monitoring and analysis tool specifically designed for Java web applications running in production.
Pros:
- Provides detailed performance analysis, including call stack tracing and SQL monitoring.
- Offers insights into request processing, resource consumption, and exceptions.
- Integrates well with the Servlet API and common Java web frameworks.
Cons:
- Primarily focused on Java web applications.
- Setup and configuration can be a bit involved.
- Visualization is built-in but might not be as extensive or customizable as dedicated dashboarding tools.
Open source and Cloud options:
- Open Source: Free to use and self-host.
- No official managed cloud offering by the Stagemonitor project.
GitHub
- Github stars: 1.7k
- Alternative to: New Relic, AppDynamics
- Stagemonitor on GitHub
Best For
Teams running Java web applications needing detailed performance insights, call stack analysis, and SQL monitoring specifically within that context.
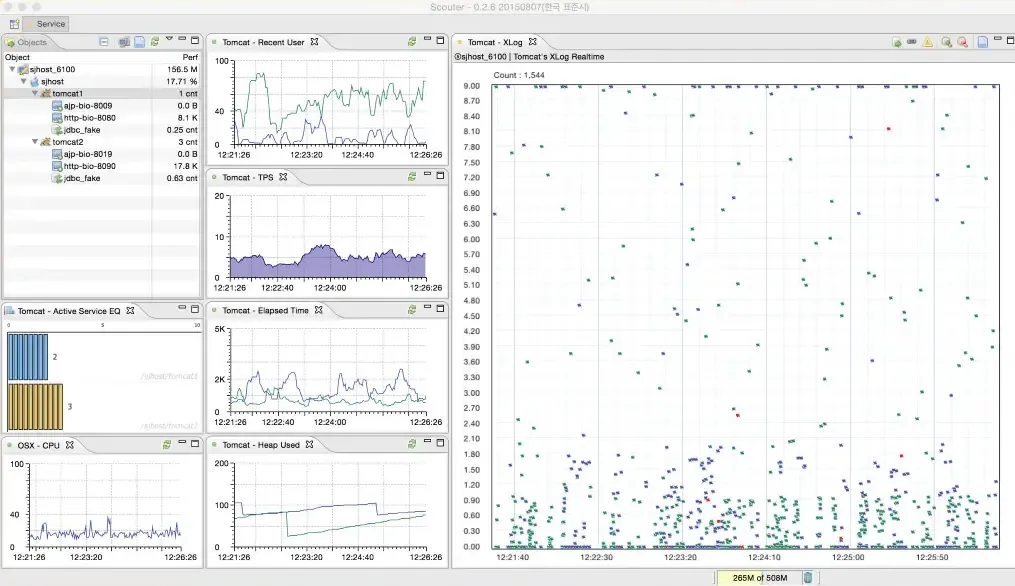
Scouter
An open-source application performance monitoring tool with a focus on providing real-time monitoring and historical data analysis for Java applications, with some support for other languages and infrastructure components.
Pros:
- Offers real-time monitoring of key metrics like CPU, memory, and network.
- Provides historical data analysis for identifying trends and performance issues over time.
- Supports monitoring of Java applications, databases (like MySQL and Oracle), and the underlying OS.
Cons:
- Primarily focused on Java, with support for other components being less comprehensive.
- User interface might not be as modern or feature-rich as some other APM tools.
- Community support might be smaller compared to more widely adopted tools.
Open source and Cloud options:
- Open Source: Free to use and self-host.
- No official managed cloud offering by the Scouter project.
GitHub
- Github stars: 2.6k
- Alternative to: New Relic, AppDynamics
- Scouter on GitHub
Best For
Teams primarily running Java applications who need real-time and historical performance monitoring of their applications and related infrastructure.
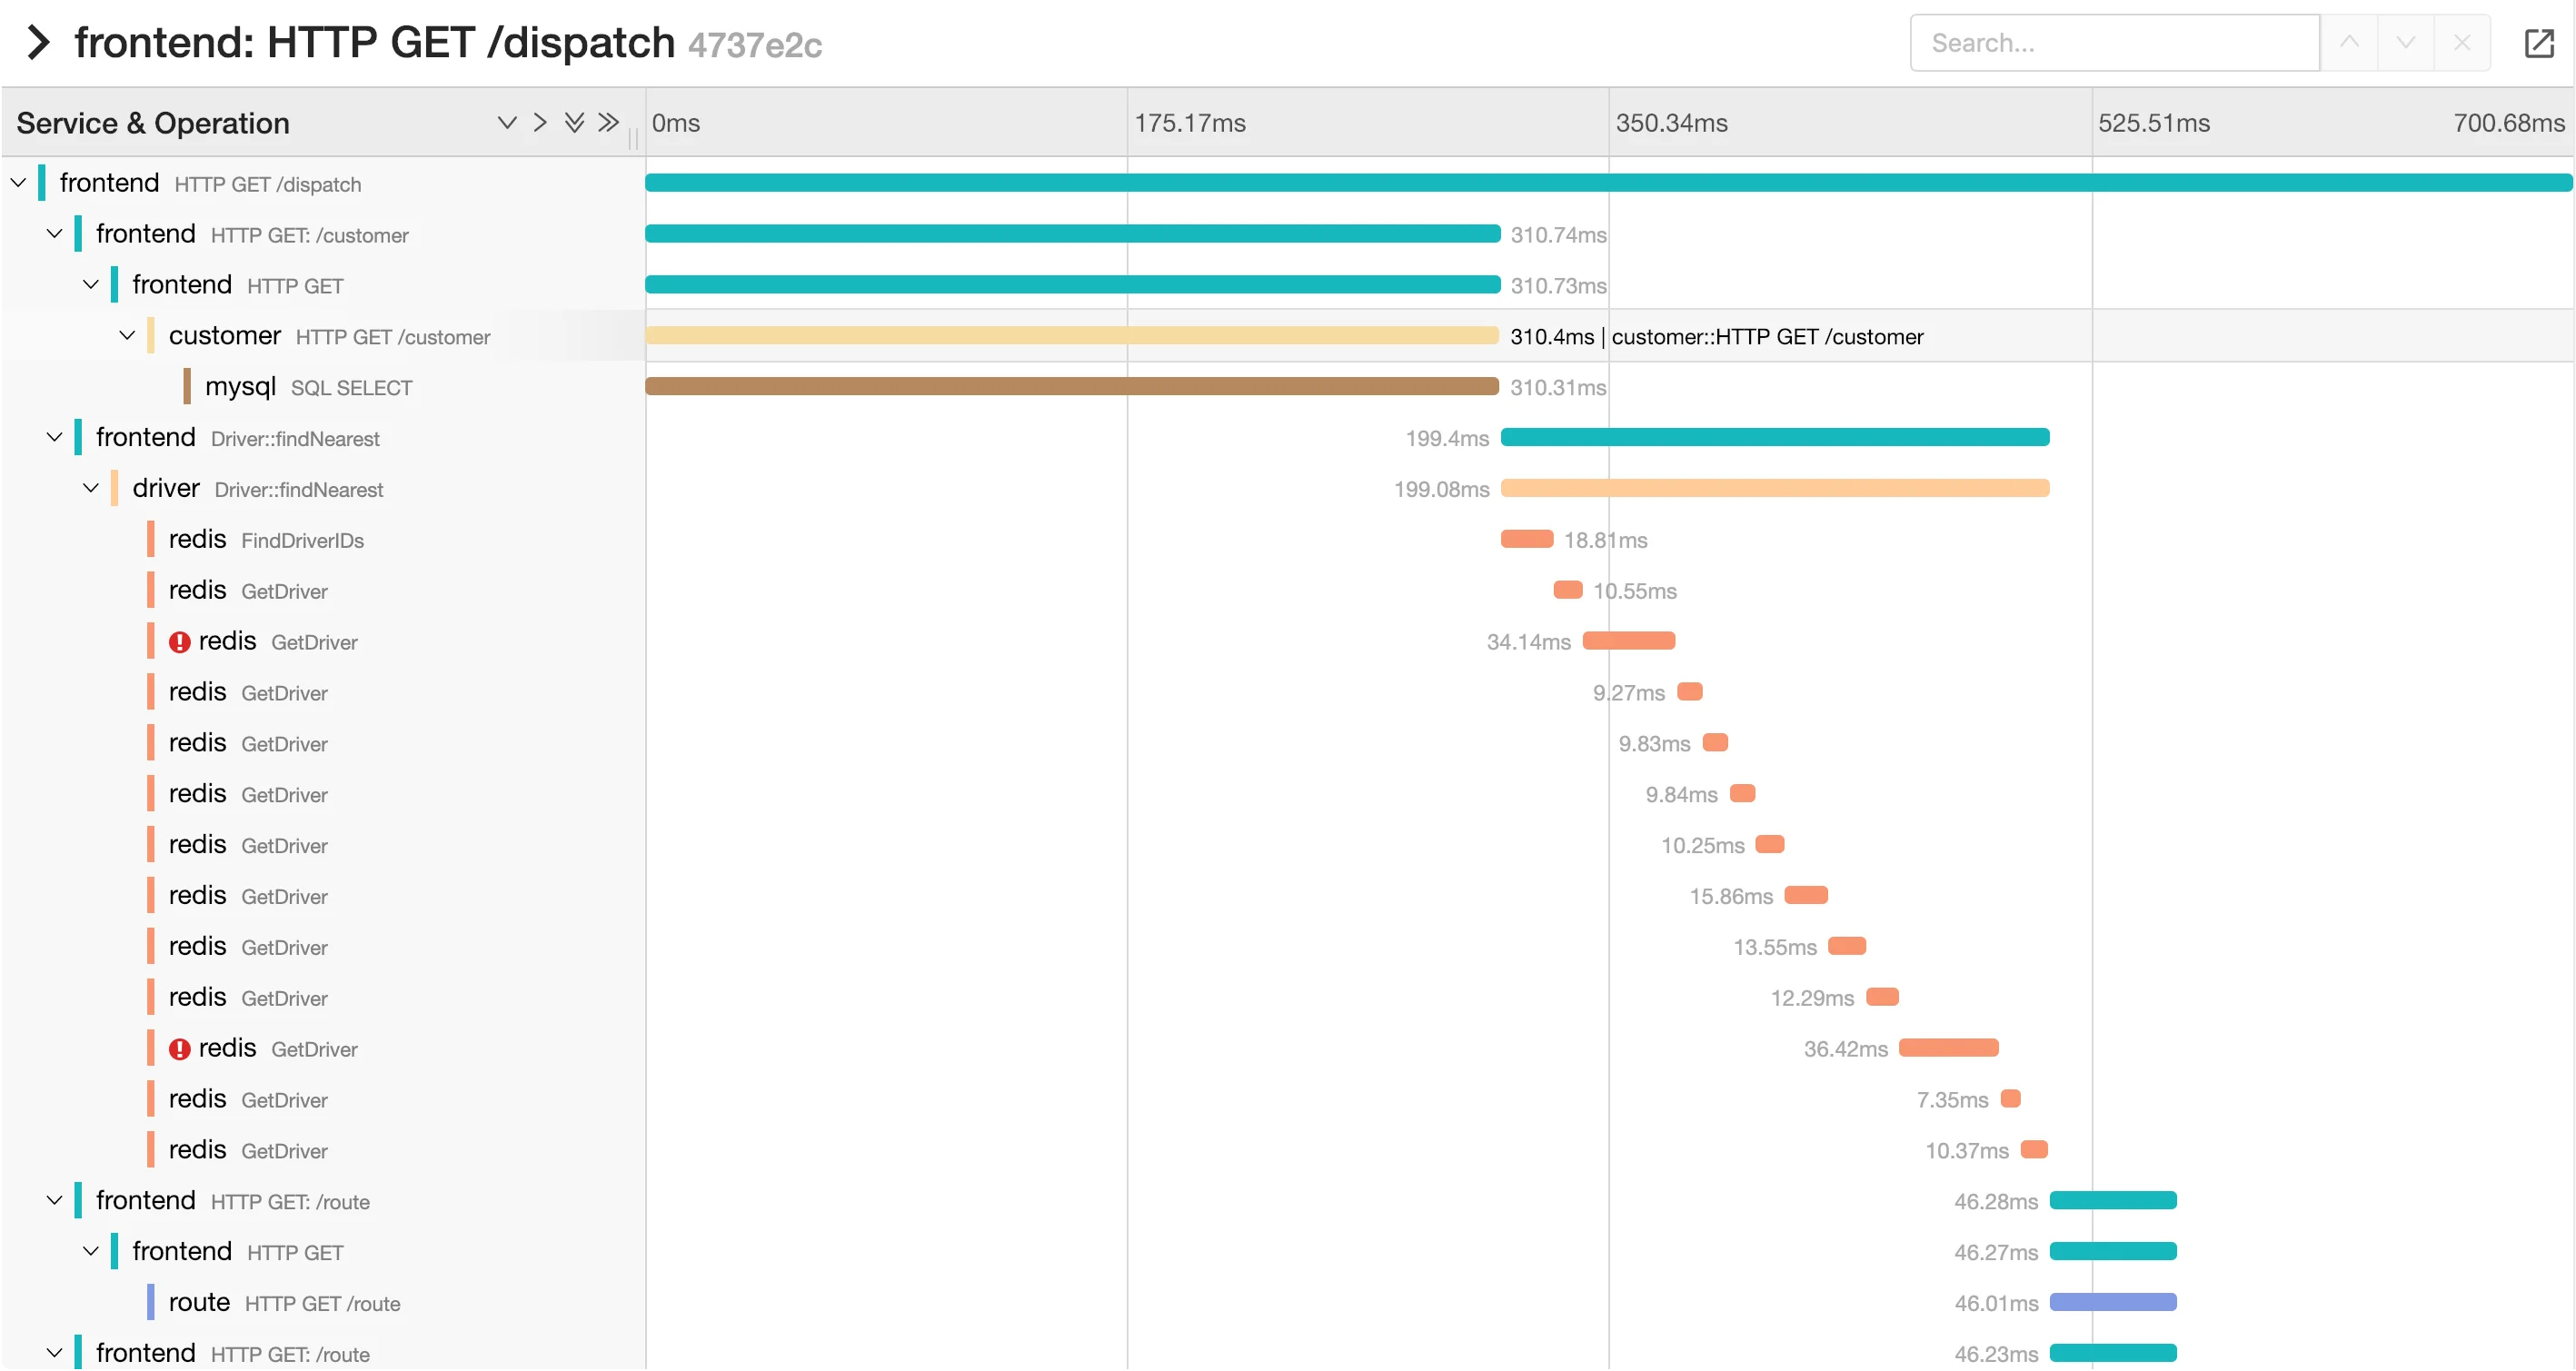
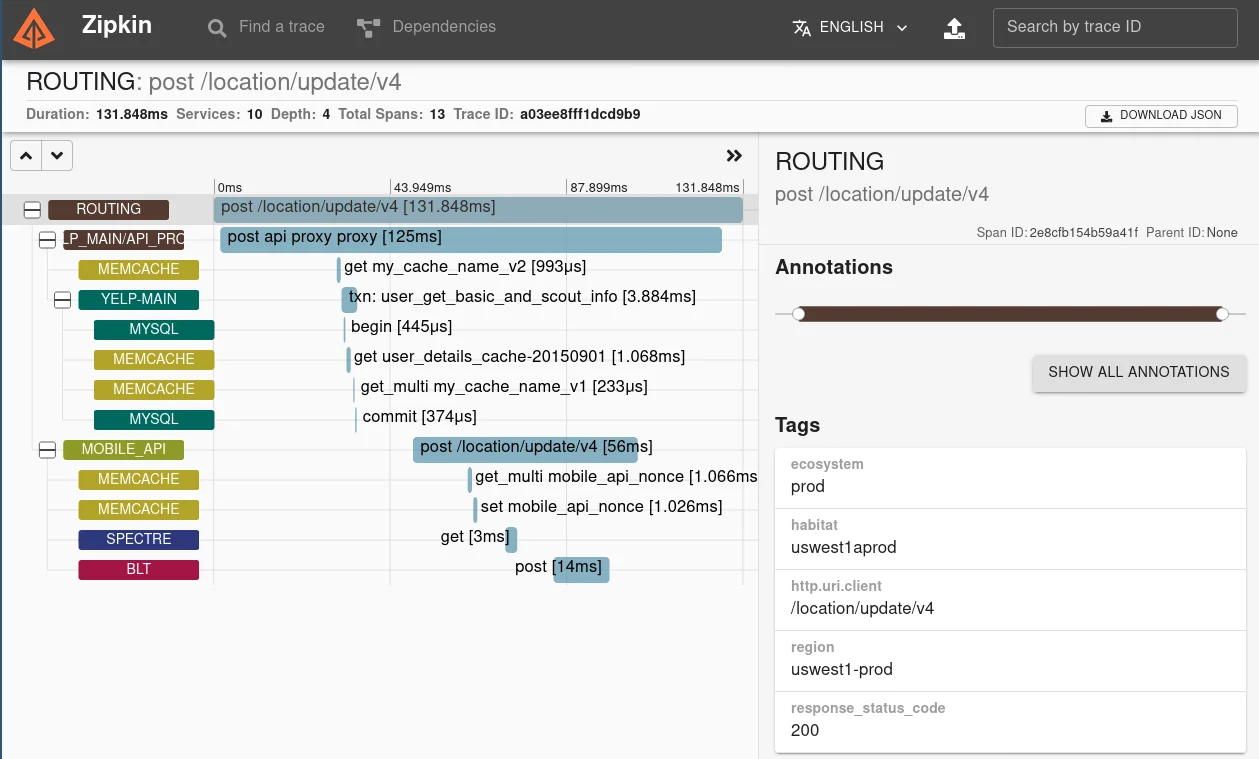
Zipkin
An open-source distributed tracing system that helps gather timing data needed to troubleshoot latency problems in service architectures.
Pros:
- Specifically designed for distributed tracing in microservices.
- Provides a clear visualization of request paths across services.
- Helps identify latency bottlenecks in complex service interactions.
Cons:
- Primarily focused on tracing; requires integration with other tools for metrics and logs.
- Setting up and managing the Zipkin infrastructure can add operational overhead.
- Visualization is centered around traces and might require integration with dashboarding tools for broader context.
Open source and Cloud options:
- Open Source: Free to use and self-host.
- No official managed cloud offering by the core Zipkin project (third-party options may exist).
GitHub
- Github stars: 17.1k
- Alternative to: Jaeger, Datadog APM
- Zipkin on GitHub
Best For
Teams operating microservices architectures who need a dedicated solution for understanding and troubleshooting distributed transaction latency.
App Metrics
An open-source library for .NET applications used to collect and report various application metrics.
Pros:
- Provides a straightforward way to instrument .NET applications with metrics.
- Supports various metric types (counters, gauges, histograms, etc.).
- Integrates with different reporting sinks (e.g., Prometheus, Graphite, InfluxDB).
Cons:
- Primarily a metrics collection library, not a full APM solution.
- Requires integration with separate visualization and alerting tools.
- Focused solely on .NET applications.
Open source and Cloud options:
- Open Source: Free to use within your .NET applications.
- No dedicated cloud offering as it's a library.
GitHub
- Github stars: 2.2k
- Alternative to: Application Insights, New Relic .NET agent
- App Metrics on GitHub
Best For
.NET development teams looking for a flexible library to instrument their applications with metrics for monitoring purposes.
How to choose the right open source APM tool for you?
Choosing the right open-source APM tool is critical to your team's ability to monitor and troubleshoot issues in your deployed application. If you are going for an open source tool, you must ensure that the tool is being actively developed on GitHub. You can ask yourself the following questions before choosing any open source tool:
- How recent was the last commit made?
- Are the maintainers of the repo responsive?
- How active is the community around the tool?
- Is the tool based on the latest industry-standard components?
But this is just one aspect. Another aspect is whether the tool serves all your needs for application monitoring or not. You don't want your team to manage multiple tools for end-to-end visibility into the performance of your apps.
Logs, metrics, and traces form the three cornerstones of full-stack APM tools. I will ofcourse recommend SigNoz as the tool of choice. It has everything that you will need for end-to-end monitoring of your application & infrastructure. But I hope this list proves helpful in making the right choice for you.
Further Reading
Kubernetes Monitoring Tools
New Relic Alternatives
Log Monitoring
