Observability is essential for maintaining and scaling modern applications. With .NET 8, Microsoft has enhanced support for observability using OpenTelemetry. In this post, we explore how to monitor .NET 8 applications logs with SigNoz, an open-source observability platform, using the OpenTelemetry Protocol (OTLP) exporter.
OpenTelemetry in .NET 8
OpenTelemetry (OTel) is a vendor-neutral standard for collecting telemetry data (logs, metrics, and traces) from cloud-native applications. In .NET 8, OpenTelemetry is natively supported through the System.Diagnostics namespace and enhanced via the OpenTelemetry NuGet packages. It allows for:
- Automatic instrumentation of ASP.NET Core and HTTP clients
- Manual instrumentation with activities and tags
- Exporters to send data to backend systems like SigNoz

.NET 8 supports native logging correlation with OpenTelemetry, making it easier to link logs with traces automatically.
What is SigNoz?
SigNoz is an open-source observability tool that helps you monitor logs, metrics, and traces in one place. Built on OpenTelemetry, SigNoz helps you with:
- Unified Observability: Collect logs, traces and metrics in one place.
- Correlates Logs and Traces: Helps track requests across microservices.
- Visualizes Latency and Errors: Provides heatmaps and dependency graphs.
- Detect Performance Bottlenecks: Enables root cause analysis with distributed tracing.
For example, consider a user encounters a 500 Internal Server Error. You want to view the log and trace together to debug the issue.

- Exception is logged using
ILogger<T>with OpenTelemetry context. - Trace ID and Span ID are automatically included (if
OTEL_LOGS_INCLUDE_TRACE_CONTEXT=true). - SigNoz shows trace-log correlation for fast debugging.
SigNoz cloud is the easiest way to run SigNoz. Sign up for a free account and get 30 days of unlimited access to all features.

You can also install and self-host SigNoz yourself since it is open-source. With 20,000+ GitHub stars, open-source SigNoz is loved by developers. Find the instructions to self-host SigNoz.
OTLP Exporter vs. OpenTelemetry Collector
You can export telemetry from a .NET 8 application to SigNoz using either the OTLP exporter or the OpenTelemetry Collector.
Option 1: OLTP Exporter
OLTP exporter sends telemetry data directly from your app to SigNoz over HTTPS or gRPC. It’s simple to configure and ideal for quick setups.
Pros:
- Minimal configuration
- No extra components
- Faster setup for development or testing
Cons:
- Tight coupling between your app and the observability backend
- Less control over telemetry flow and performance
Recommended use case: Local development or lightweight apps where infrastructure simplicity matters.
Option 2: OpenTelemetry Collector
The OpenTelemetry Collector acts as a gateway to receive, process, and forward telemetry data. It adds flexibility, supports batching, retries, filtering, and transformation.
Pros:
- Central control over all telemetry
- Supports advanced features like filtering, sampling, and multi-destination export
- Decouples instrumentation from backend
Cons:
- Requires additional infrastructure
- More setup complexity
Recommended use case: Production environments or Multi-service architectures with high telemetry needs.
| Use Case | OTLP Exporter | OpenTelemetry Collector |
|---|---|---|
| Fast setup for dev/test | ✅ Yes | ❌ No |
| Production-scale apps | ⚠ Limited | ✅ Recommended |
| Centralized pipeline control | ❌ No | ✅ Yes |
| Advanced filtering/sampling | ❌ No | ✅ Yes |
In this guide, you'll use the OTLP exporter to get started quickly. You can switch to using the collector later as your architecture evolves.
Prerequisites
Before you begin, ensure you have the following:
- .NET 8 SDK installed on your system
- SigNoz Cloud account with OTLP endpoint and ingestion key
- (Optional) Visual Studio Code or any code editor of your choice
Configuring OpenTelemetry in .NET 8
This section shows how to build a minimal Web API using ASP.NET Core with OpenTelemetry instrumentation.
📁 File Structure
/CoffeeApi
  ├── Program.cs
  ├── Controllers/
  │   └── CoffeeController.cs
  ├── Logs/
  │   └── ApplicationLogs.cs
1.Install Required NuGet Packages
dotnet add package OpenTelemetry.Extensions.Hosting
dotnet add package OpenTelemetry.Exporter.OpenTelemetryProtocol
dotnet add package OpenTelemetry.Instrumentation.AspNetCore
dotnet add package OpenTelemetry.Instrumentation.Http
2. Configure OpenTelemetry
In your Program.cs , consider the following variables:
serviceName: Configured usingResourceBuilder, this identifies the service in SigNoz. For more information, refer to Resources.- This helps group telemetry by service and helps you filter or correlate logs and traces from the same logical service.
otlpOptions.Endpoint: The URL to which OTLP exporters send telemetry data.signoz-ingestion-key: A token required to authenticate and send data to SigNoz Cloud.
For more information, refer to :
For this blog, consider building an API that orders coffee and updates the existing order.
Program.cs
using Microsoft.AspNetCore.Builder;
using Microsoft.Extensions.DependencyInjection;
using Microsoft.Extensions.Logging;
using OpenTelemetry.Logs;
using OpenTelemetry.Resources;
using OpenTelemetry.Trace;

var builder = WebApplication.CreateBuilder(args);

// Set up OpenTelemetry tracing
builder.Services.AddOpenTelemetry()
    .WithTracing(tpb =>
    {
        tpb.SetResourceBuilder(ResourceBuilder.CreateDefault().AddService("coffee-api")) // Service name used in SigNoz dashboard
           .AddAspNetCoreInstrumentation() // Auto-instrument ASP.NET Core middleware
           .AddHttpClientInstrumentation() // Auto-instrument HTTP client requests
           .AddOtlpExporter(otlp =>
           {
               otlp.Endpoint = new Uri("https://<your-signoz-endpoint>:4318"); // Replace with SigNoz OTLP endpoint
               otlp.Headers = "signoz-ingestion-key=<your-signoz-key>"; // Replace with your SigNoz ingestion key
           });
    });

// Set up OpenTelemetry logging
builder.Logging.ClearProviders();
builder.Logging.AddOpenTelemetry(opt =>
{
    opt.IncludeFormattedMessage = true; // Include the formatted log message
    opt.IncludeScopes = true; // Include scope information
    opt.ParseStateValues = true; // Enable structured log parsing
    opt.SetResourceBuilder(ResourceBuilder.CreateDefault().AddService("coffee-api")); // Match the trace service name
    opt.AddOtlpExporter(otlp =>
    {
        otlp.Endpoint = new Uri("https://<your-signoz-endpoint>:4318");
        otlp.Headers = "signoz-ingestion-key=<your-signoz-key>";
    });
});

// Add support for controllers (API endpoints)
builder.Services.AddControllers();

var app = builder.Build();

// Map API routes
app.MapControllers();

app.Run();
Implement the Controller in CoffeeController.cs
using Microsoft.AspNetCore.Mvc;
using System.Diagnostics;

namespace CoffeeApi.Controllers;

[ApiController]
[Route("api/[controller]")]
public class CoffeeController : ControllerBase
{
    private readonly ILogger<CoffeeController> _logger;
    private static readonly ActivitySource ActivitySource = new("CoffeeApi.Order");

    public CoffeeController(ILogger<CoffeeController> logger)
    {
        _logger = logger;
    }

    [HttpPost("order")]
    public IActionResult OrderCoffee()
    {
        // Start a custom trace span for ordering coffee
        using var activity = ActivitySource.StartActivity("OrderCoffeeOperation");

        // Log a structured message within the trace context
        ApplicationLogs.OrderingCoffee(_logger);

        return Ok("✅ Coffee order placed.");
    }

    [HttpPost("update-order")]
    public IActionResult UpdateOrder()
    {
        // Start a custom trace span for updating the order
        using var activity = ActivitySource.StartActivity("UpdateOrderOperation");

        // Log a structured message within the trace context
        ApplicationLogs.UpdatingOrder(_logger);

        return Ok("🔄 Coffee order updated.");
    }
}
Implement structured logs in ApplicationLogs.cs
namespace CoffeeApi;

public static partial class ApplicationLogs
{

    [LoggerMessage(EventId = 2001, Level = LogLevel.Information, Message = "Ordering coffee...")]
    public static partial void OrderingCoffee(ILogger logger);

    [LoggerMessage(EventId = 2002, Level = LogLevel.Information, Message = "Updating coffee order...")]
    public static partial void UpdatingOrder(ILogger logger);
}
3.Correlate Logs with Traces
To enhance observability, include TraceId and SpanId in log messages. Correlating logs with traces helps:
- Understand request lifecycles across distributed services
- Debug faster with complete observability context
- Identify which operation a log entry belongs to
OpenTelemetry automatically correlates logs with traces when configured correctly. Here's how it works:
- When you start an activity i.e span with
ActivitySource.StartActivity(), the SDK tracks theTraceIdandSpanIdof the current request. - When logging using
ILogger<T>, OpenTelemetry includes this trace context in log messages automatically. - When you use
AddOpenTelemetry()for logging, and you've set the environment variableOTEL_LOGS_INCLUDE_TRACE_CONTEXT=true(enabled by default) to ensure trace context is included in logs.
This integration allows you to trace logs directly in SigNoz without manually passing trace identifiers. This is especially useful in ASP.NET Core apps, where incoming HTTP requests are already traced via the OpenTelemetry.Instrumentation.AspNetCore package.
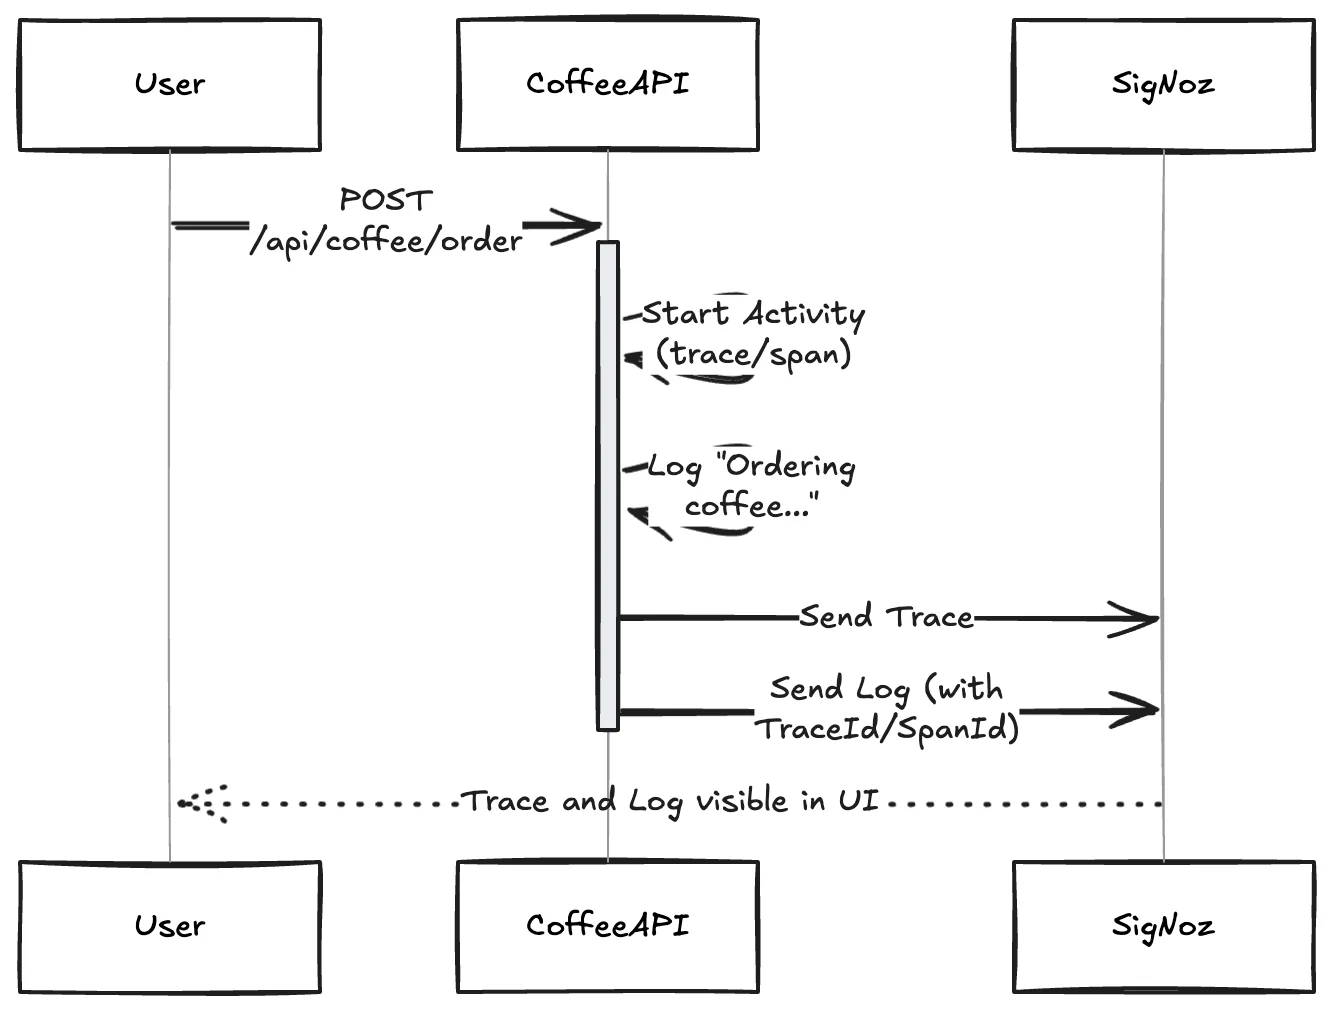
Log and Trace correlation workflow:
Activity Creation
using var activity = ActivitySource.StartActivity("BrewOperation");Starts a span with a unique TraceId and SpanId.
Emit Logs Within Activity Context
ApplicationLogs.OrderingCoffee(_logger);This log is emitted with the active trace context attached.
Export to SigNoz
- Both logs and traces are sent using OTLP Exporter.
- SigNoz links them using shared
TraceIdandSpanId.
Troubleshooting Log-Trace Correlation
If logs and traces aren't correlating in SigNoz:
- Ensure
ActivitySourceis used correctly when creating spans. - Verify logging occurs inside an active
Activityscope. - Check that the OTLP exporter is configured for both logs and traces.
- Confirm the
TraceIdandSpanIdare present in logs. - Use the console exporter temporarily to verify enrichment.
Key Takeaways
By combining OpenTelemetry with SigNoz in your .NET 8 apps, you gain:
- Automatic instrumentation for traces and logs.
- Seamless correlation between logs and traces.
- Centralised observability for improved troubleshooting.
Next Steps:
- Explore traces and correlated logs in SigNoz.
- Join the SigNoz Slack community for help and best practices.
