OpenTelemetry can be used to trace Rust applications for performance issues and bugs. OpenTelemetry is an open-source project under the Cloud Native Computing Foundation (CNCF) that aims to standardize the generation and collection of telemetry data. Telemetry data includes logs, metrics, and traces.
Rust is a multi-paradigm, general-purpose programming language designed for performance and safety, especially safe concurrency. In this tutorial, we will demonstrate how to use the OpenTelemetry to generate end-to-end tracing.
Before we demonstrate how to implement the OpenTelemetry libraries, let’s have a brief overview of OpenTelemetry.
What is OpenTelemetry?
OpenTelemetry is an open-source vendor-agnostic set of tools, APIs, and SDKs used to instrument applications to create and manage telemetry data(logs, metrics, and traces). It aims to make telemetry data(logs, metrics, and traces) a built-in feature of cloud-native software applications.
The telemetry data is then sent to an observability tool for storage and visualization.
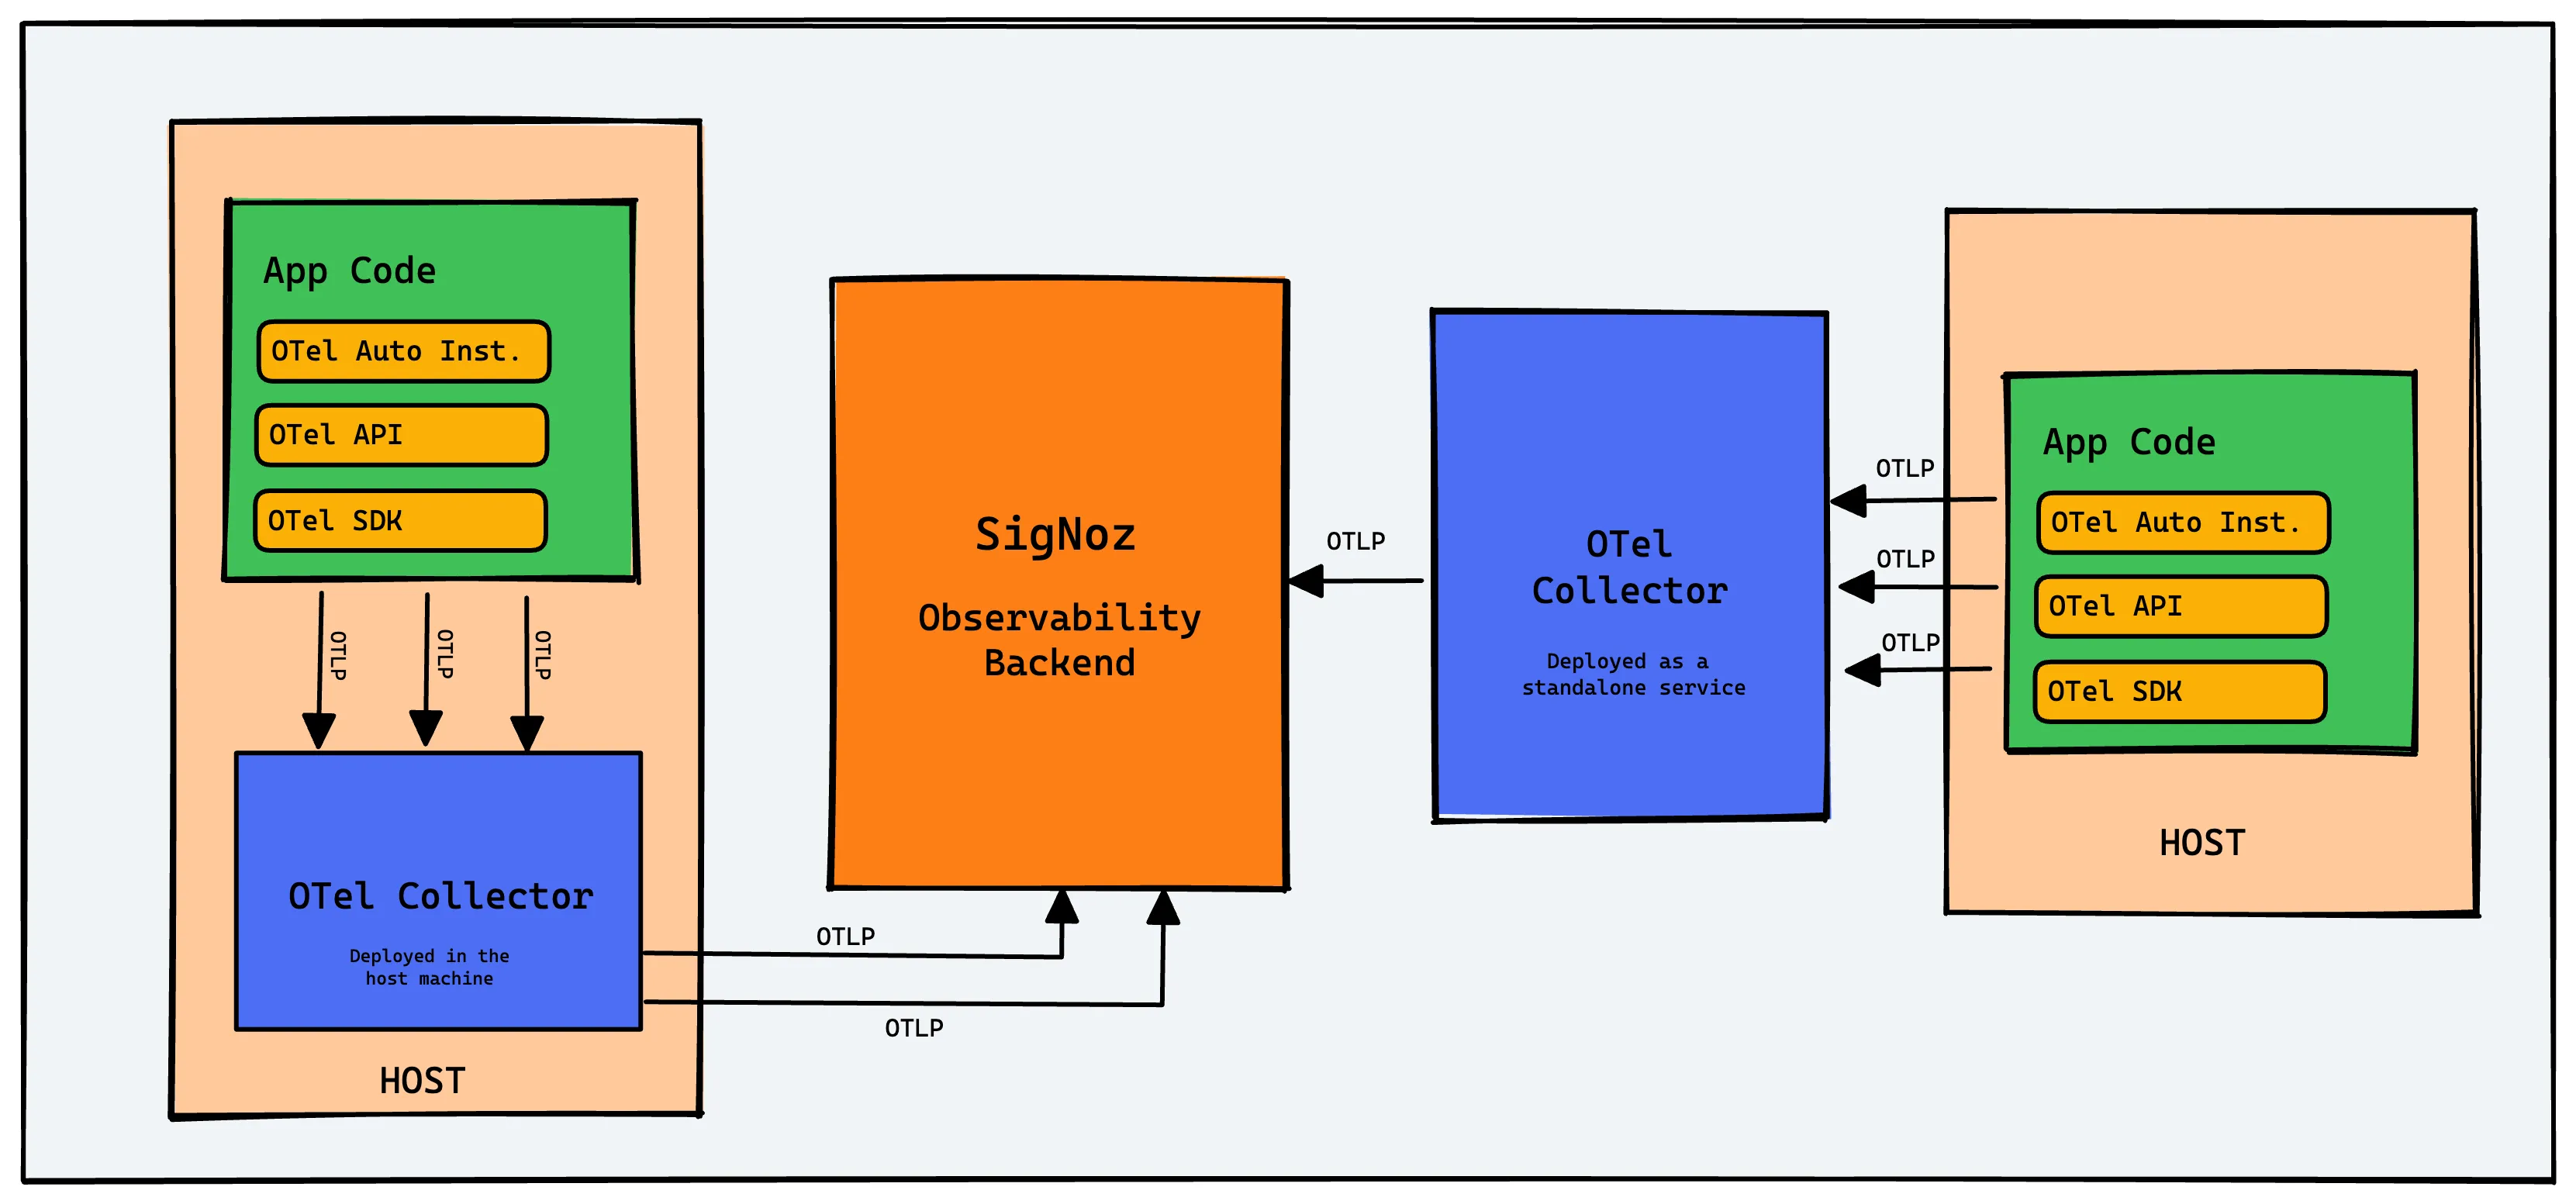
OpenTelemetry is the bedrock for setting up an observability framework. It also provides you the freedom to choose a backend analysis tool of your choice.
OpenTelemetry and SigNoz
In this tutorial, we will use SigNoz as our backend analysis tool. SigNoz is a full-stack open-source APM tool that can be used for storing and visualizing the telemetry data collected with OpenTelemetry. It is built natively on OpenTelemetry and works on the OTLP data formats.
SigNoz provides query and visualization capabilities for the end-user and comes with out-of-box charts for application metrics, logs and traces.
Now let’s get down to how to implement OpenTelemetry in Rust applications and then visualize the collected data in SigNoz.
Running Rust application with OpenTelemetry
In this section, you’ll learn to instrument your Rust application with OpenTelemetry, enabling you to collect and send telemetry data to SigNoz for monitoring and performance insights.
Create a SigNoz cloud account
To begin monitoring your applications, create a SigNoz Cloud account. SigNoz cloud is the easiest way to run SigNoz. Sign up for a free account and get 30 days of unlimited access to all features.
You can also install and self-host SigNoz yourself since it is open-source. With 19,000+ GitHub stars, open-source SigNoz is loved by developers. Find the instructions to self-host SigNoz.
Once your account setup is complete, you’ll receive an email with a URL to access the SigNoz UI. Use this URL to log in and access your personalized dashboard.
Get a sample Rust application
If you already have a Rust application, you can skip this step and move on to the next section. However, if you don't have a Rust application or want to quickly get started, we have provided a sample Rust application that is already instrumented with OpenTelemetry.
Instrument your application with OpenTelemetry
To integrate OpenTelemetry into your Rust application, follow these steps:
Step 1: Update your Cargo.toml file
To enable OpenTelemetry in your Rust application, you need to include the necessary dependencies in the Cargo.toml file. These crates, provided by OpenTelemetry, will help collect and send telemetry data from your application.
Add the following dependencies under the [dependencies] section of your Cargo.toml file:
opentelemetry = { version = "0.18.0", features = ["rt-tokio", "metrics", "trace"] }
opentelemetry-otlp = { version = "0.11.0", features = ["trace", "metrics"] }
opentelemetry-semantic-conventions = { version = "0.10.0" }
opentelemetry-proto = { version = "0.1.0"}
tokio = { version = "1", features = ["full"] }
tonic = { version = "0.8.2", features = ["tls-roots"] }
Explanation:
opentelemetry: This crate provides core OpenTelemetry functionality for tracing, metrics, and more.opentelemetry-otlp: The OpenTelemetry Protocol (OTLP) exporter, which sends trace data to SigNoz or other monitoring tools.opentelemetry-semantic-conventions: Defines standard attribute names for traces, such asservice.nameandservice.version.tokio: A runtime for asynchronous Rust code, required for OpenTelemetry's asynchronous operations.tonic: Used to send trace data over gRPC.dotenv: Loads environment variables from a.envfile to keep sensitive information secure and easily configurable.
After adding these dependencies, you need to use them in your application.
Step 2: Import required modules in main.rs
In the entry point of your application, which is usually the main.rs file, import the added dependencies (OpenTelemetry crates):
use opentelemetry::global::shutdown_tracer_provider;
use opentelemetry::sdk::Resource;
use opentelemetry::trace::TraceError;
use opentelemetry::{
    global, sdk::trace as sdktrace,
    trace::{TraceContextExt, Tracer},
    Context, Key, KeyValue,
};
use opentelemetry_otlp::WithExportConfig;
use tonic::metadata::{MetadataMap, MetadataValue};
Step 3: Initialize the tracer
Now, create a function to initialize OpenTelemetry. This function sets up the OTLP exporter to send the telemetry data to SigNoz, adds metadata, and configures the trace settings.
Add the below init_tracer function in your main.rs file:
fn init_tracer() -> Result<sdktrace::Tracer, TraceError> {
    let signoz_ingestion_key = std::env::var("SIGNOZ_INGESTION_KEY").expect("SIGNOZ_INGESTION_KEY not set");
    let mut metadata = MetadataMap::new();
    metadata.insert(
        "signoz-ingestion-key",
        MetadataValue::from_str(&signoz_ingestion_key).unwrap(),
    );
    opentelemetry_otlp::new_pipeline()
        .tracing()
        .with_exporter(
            opentelemetry_otlp::new_exporter()
                .tonic()
                .with_metadata(metadata)
                .with_endpoint(std::env::var("SIGNOZ_ENDPOINT").expect("SIGNOZ_ENDPOINT not set")),
        )
        .with_trace_config(
            sdktrace::config().with_resource(Resource::new(vec![
                KeyValue::new(
                    opentelemetry_semantic_conventions::resource::SERVICE_NAME,
                    std::env::var("APP_NAME").expect("APP_NAME not set"),
                ),
            ])),
        )
        .install_batch(opentelemetry::runtime::Tokio)
}
Explanation:
signoz_ingestion_key: Retrieves the SigNoz ingestion key from your environment variables.MetadataMap: Adds custom metadata (such as the ingestion key) to the telemetry data.opentelemetry_otlp::new_pipeline(): Creates a new telemetry pipeline with the OTLP exporter.with_exporter: Configures the exporter to send data to SigNoz.with_trace_config: Configures additional trace settings, including setting the service name.install_batch: Installs the tracer in batch mode, which uses Tokio as the async runtime.
Step 4: Create a .env file
Create a .env file in the root of your project to store sensitive information, such as the SigNoz endpoint, ingestion key, and app name. The .env file structure should look like this:
project_root/
|-- Cargo.toml
|-- src/
|   |-- main.rs
|-- .env
Paste these in .env file:
PORT=1337
APP_NAME=rust-sample
SIGNOZ_ENDPOINT=https://ingest.[region].signoz.cloud:443/v1/traces
SIGNOZ_INGESTION_KEY=XXXXXXXXXX
Where:
PORT: The port your application runs onAPP_NAME: The name you want to give your rust applicationSIGNOZ_INGESTION_KEY: This is an ingestion key provided by SigNoz that authenticates your application with your SigNoz cloud account and ensures that data is sent securely. Follow this guide to generate your SigNoz ingestion key.SIGNOZ_ENDPOINT: The endpoint where trace data will be sent. The full URL format ishttps://ingest.[region].signoz.cloud:443/v1/traces. Depending on the choice of your region for SigNoz cloud, the ingest endpoint will vary according to this table.Region Endpoint US ingest.us.signoz.cloud:443/v1/traces IN ingest.in.signoz.cloud:443/v1/traces EU ingest.eu.signoz.cloud:443/v1/traces
Step 6: Add the dotenv crate
The dotenv crate helps load environment variables from the .env file into the Rust application. This is crucial because it allows you to manage sensitive information securely and dynamically, without hardcoding values into the source code.
Open your Cargo.toml file and paste these below [dependencies]:
dotenv = "0.15.0"
In your main.rs file, import it at top so you can use variables from the .env file
use dotenv::dotenv;
Step 7: Initialize the environment and tracer
After adding the dotenv crate in your Cargo.toml file , you need to call it inside the main() function in your main.rs file to load the environment variables from the .env file. The init_tracer() function is then called to initialize the OpenTelemetry pipeline, enabling the application to start collecting telemetry data and sending it to SigNoz:
dotenv().ok();
let _ = init_tracer();
Also change:
fn main(){
    *//rest of the code*}
to
*#[tokio::main]*async fn main() {
    *//rest of the code*}
Step 8: Add span creation for telemetry data
To trace operations, you need to create spans in your application. Add the below just after the let _ = init_tracer();:
  let tracer = global::tracer("global_tracer");
    let _cx = Context::new();

    tracer.in_span("operation", |cx| {
        let span = cx.span();
        span.set_attribute(Key::new("KEY").string("value"));

        span.add_event(
            format!("Operations"),
            vec![
                Key::new("SigNoz is").string("Awesome"),
            ],
        );
    });
    shutdown_tracer_provider()
tracer.in_span: This creates a new span named"operation", which represents an operation being performed within the application. Spans are the core of tracing, as they record the details of operations as they occur.span.set_attribute: This sets additional attributes on the span, such as"KEY": "value". These attributes help provide more context to your traces and can be used for filtering or grouping in the monitoring tool.span.add_event: This adds an event to the span, which can include custom messages or metadata. Events can help track specific points in time during the span's lifecycle.shutdown_tracer_provider: This shuts down the tracer and sends any remaining data to the configured exporter. This is important for ensuring all trace data is sent before the application exits.
Step 9: Run your application
Run the application by executing the following command:
cargo run
Open localhost:1337 in your browser and you should see your application running.

Generate Telemetry Data
To monitor your Rust application with SigNoz, you need to generate telemetry data. Visit your application's homepage at http://localhost:1337 and enter some details, or send a curl request like this:
curl -d "name=Baymax&number=42" \
-H "Content-Type: application/x-www-form-urlencoded" \
-X POST http://localhost:1337/post
Monitor and Visualize your application in SigNoz
After instrumenting your Rust application with OpenTelemetry, you can access the SigNoz UI to monitor and visualize your application's performance in real-time.
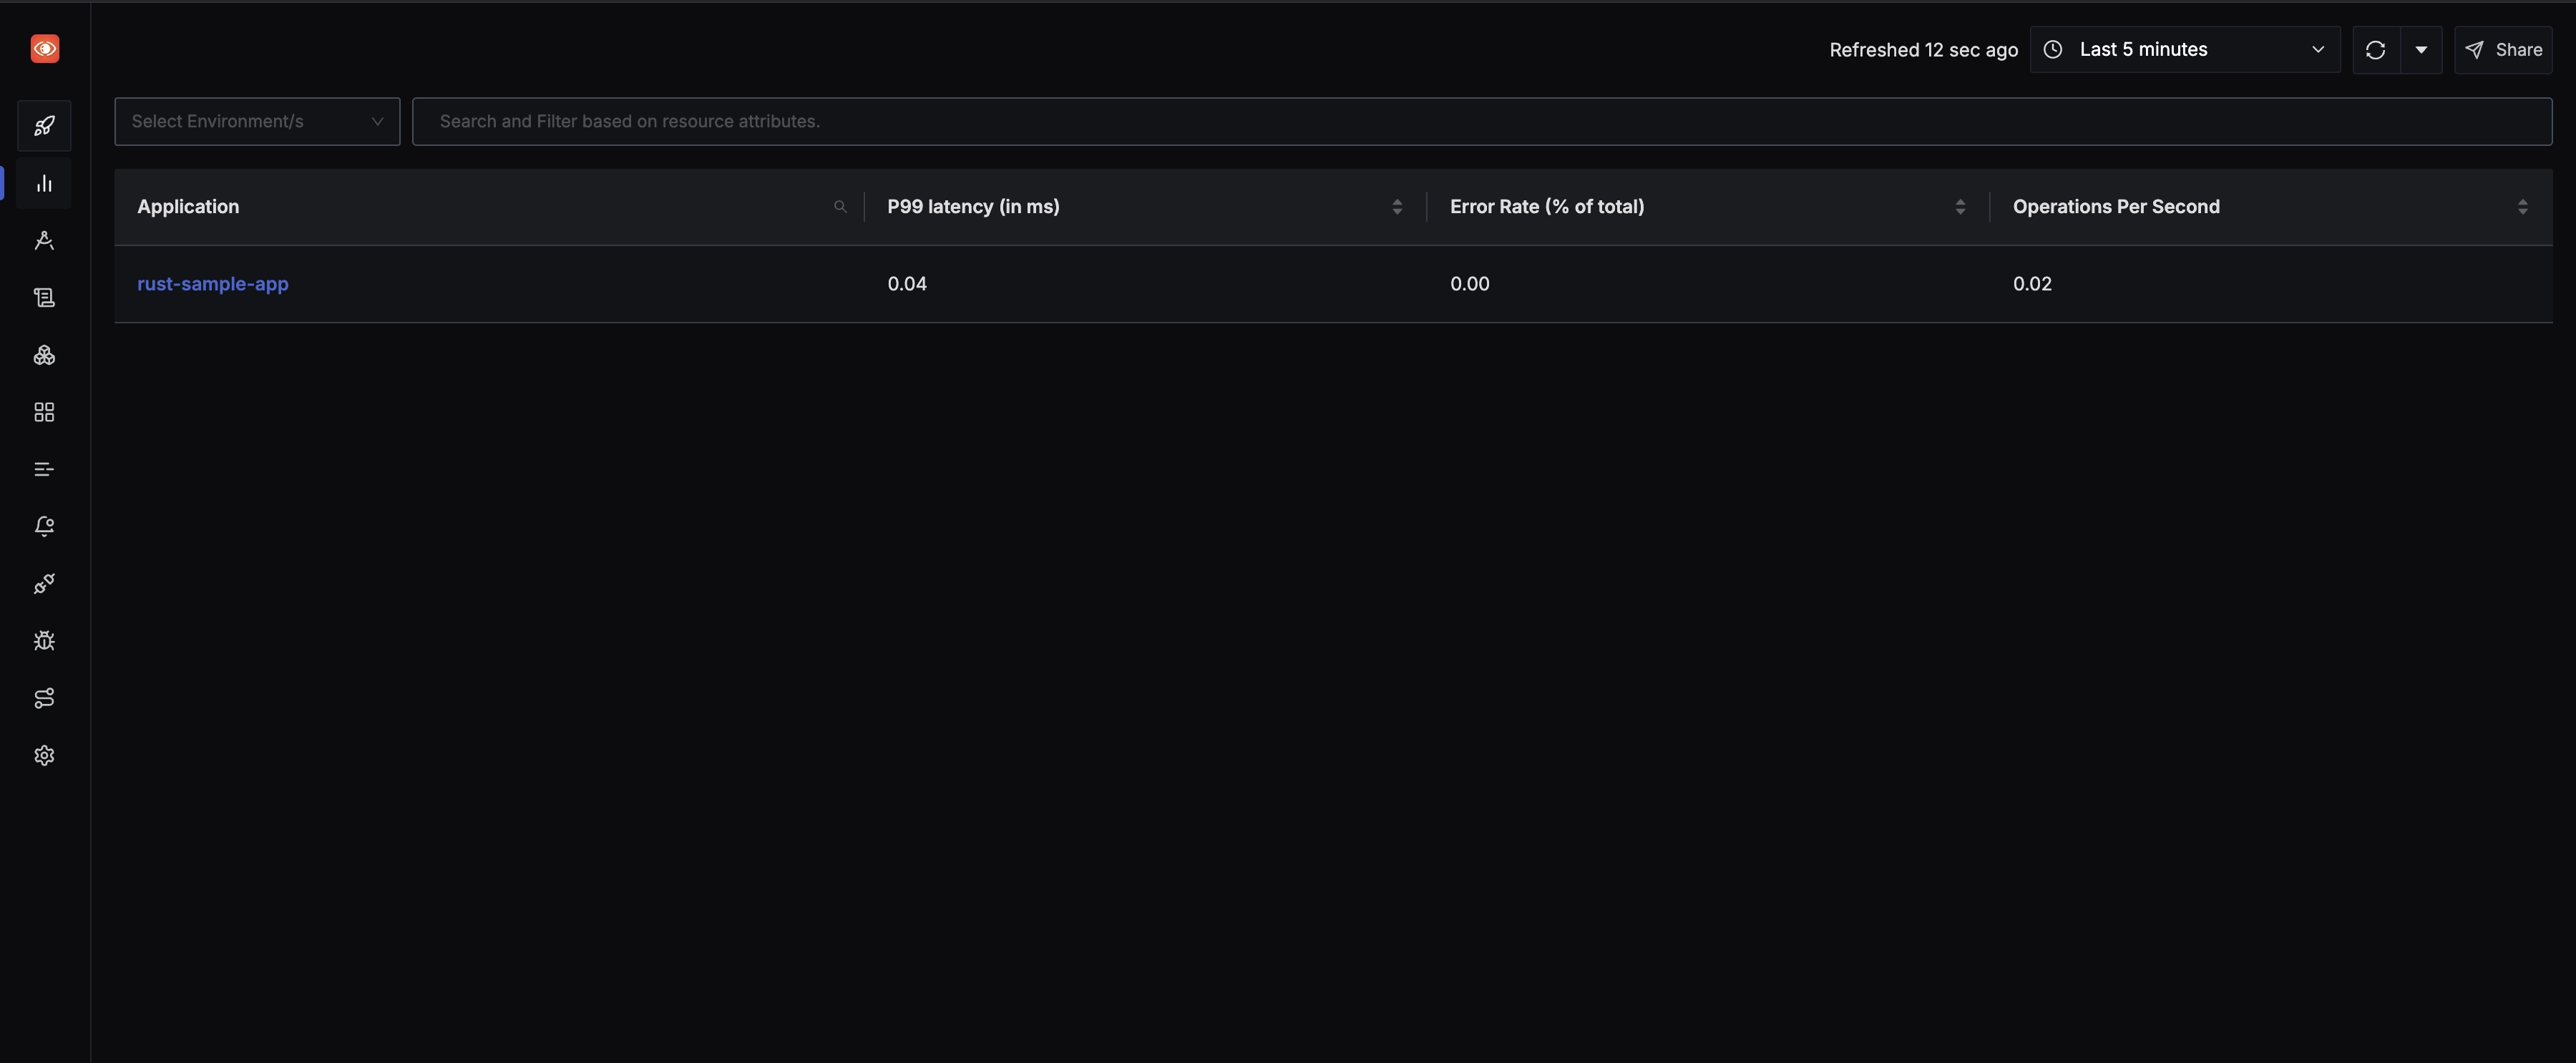
Under the Services tab, you will find your sample Rust application in the list of applications being monitored by SigNoz.
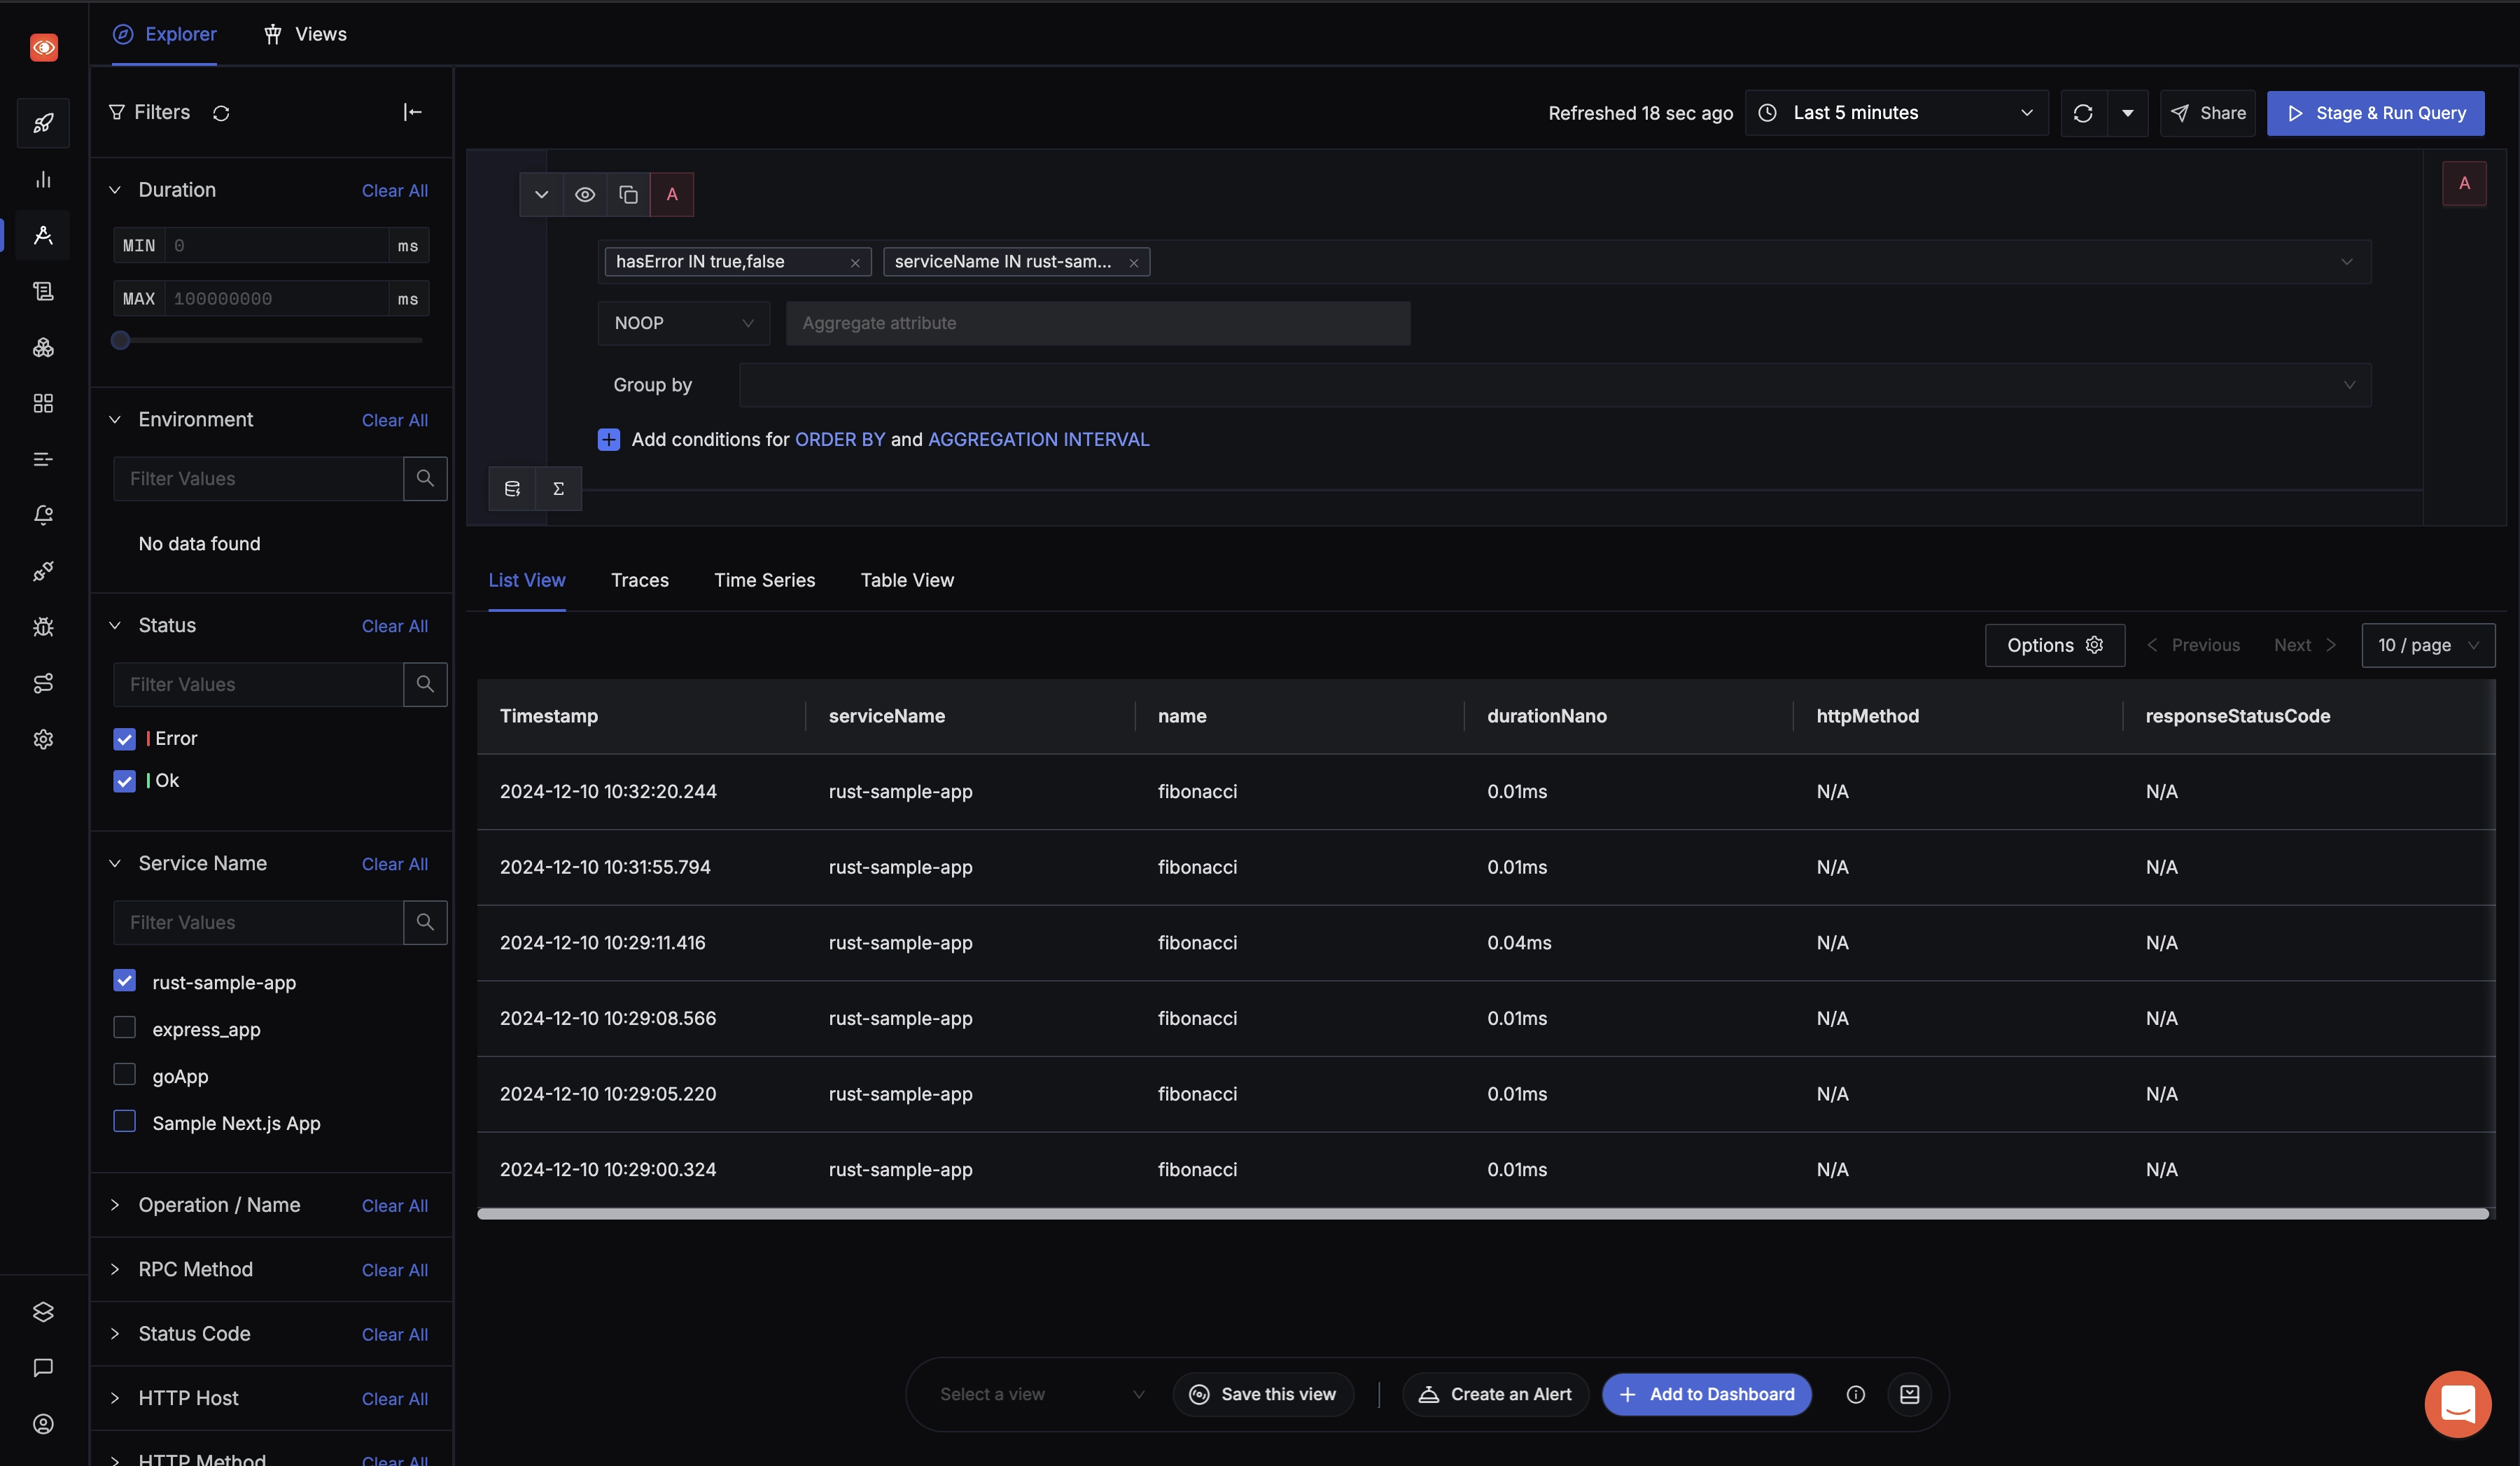
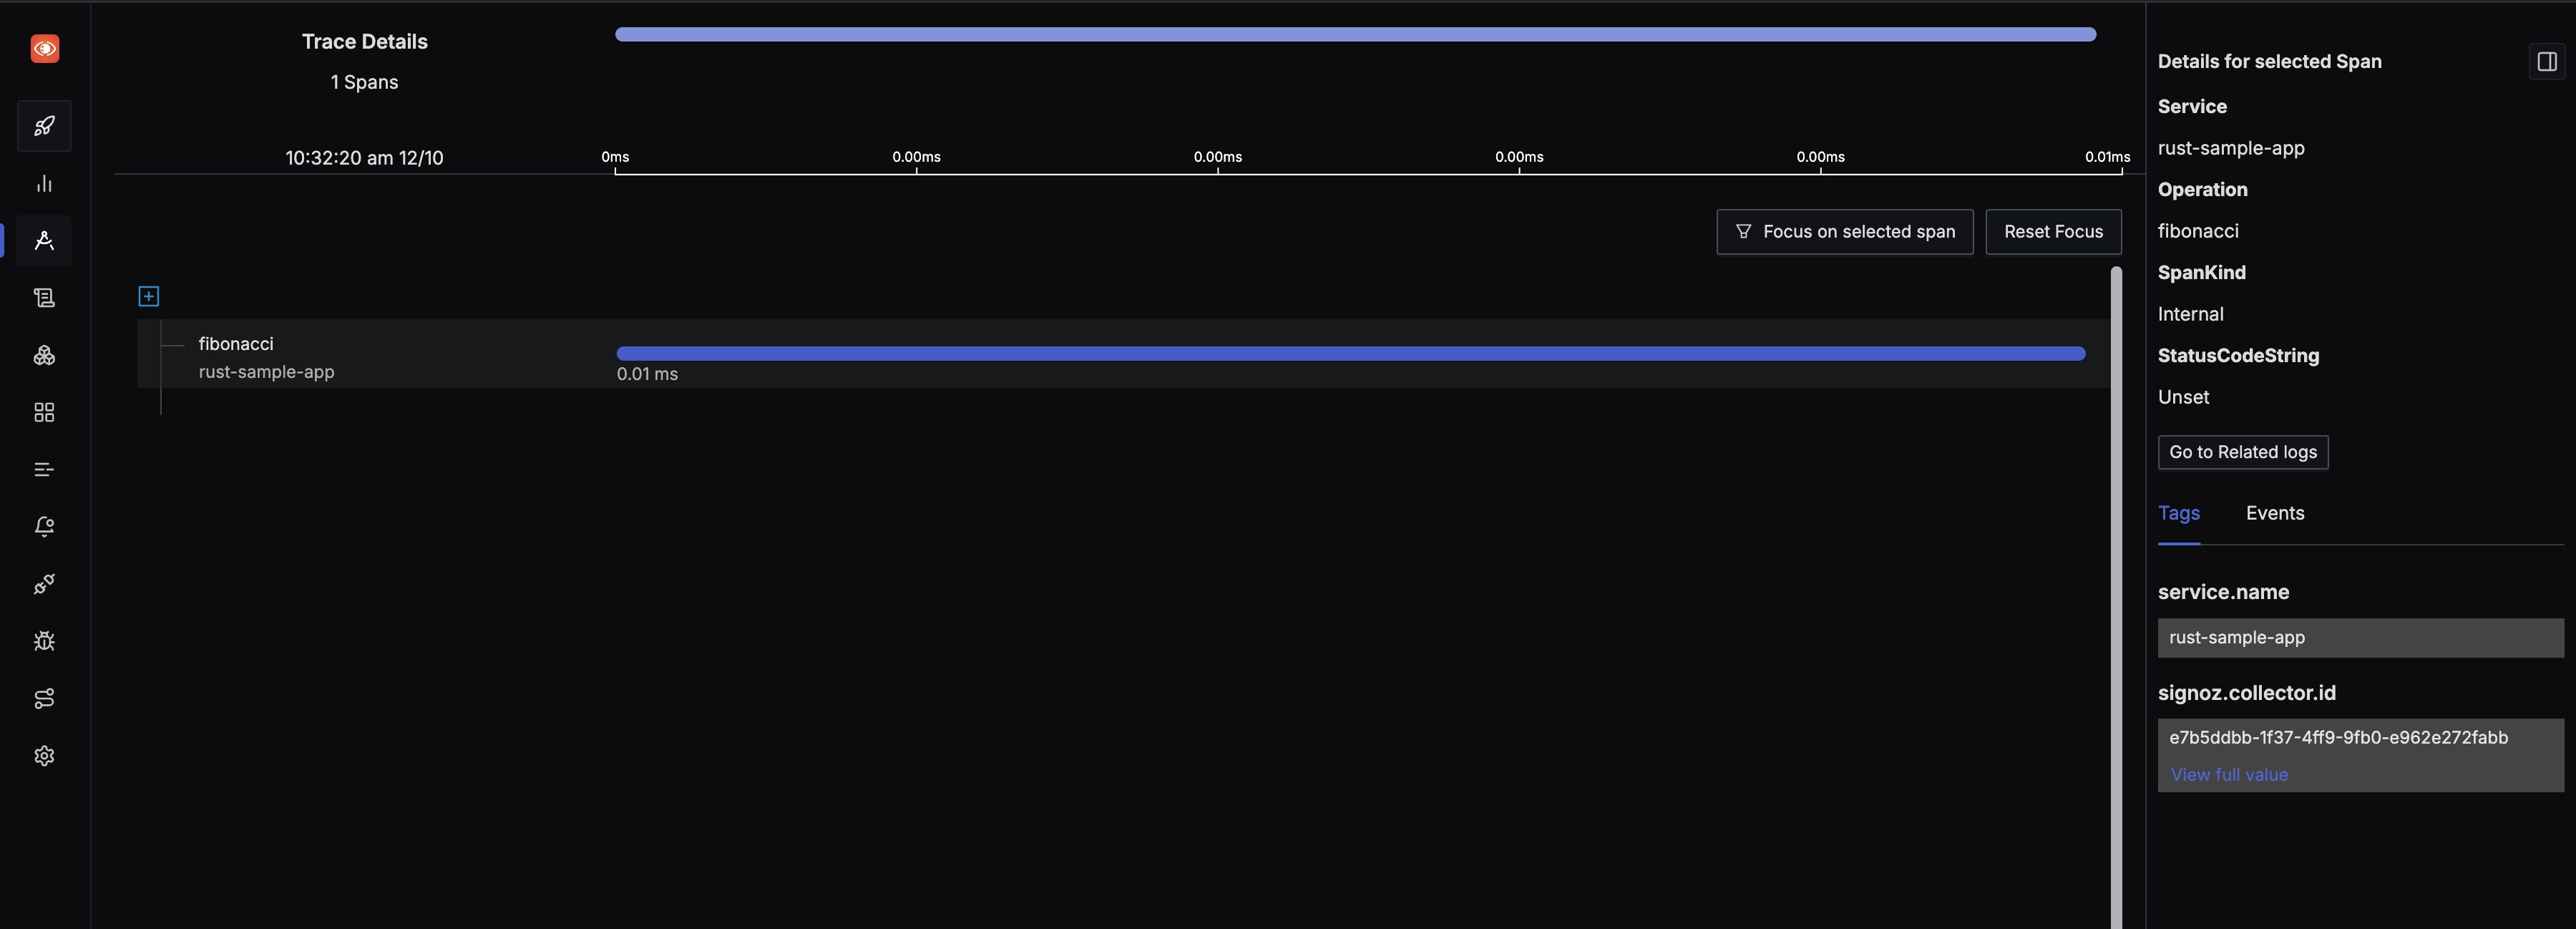
Navigate to the Traces tab in SigNoz and select your rust-app from the list of services to view trace data. Tracing data can help you visualize how user requests perform across services in a multi-service application. You can use various filters such as tags, status codes, service names, and operations to drill down into specific aspects of your application's tracing data.
Additionally, SigNoz provides Flamegraphs and Gantt charts for a detailed breakdown of request execution, including the time taken by each operation and span attributes.
By clicking on any span in the Spans table, you can dive deeper into the trace details and get a clearer view of your application's performance across different operations and services.
Conclusion
Using OpenTelemetry libraries, you can instrument your Rust applications for end-to-end tracing. You can then use an open-source APM tool like SigNoz to ensure the smooth performance of your applications.
OpenTelemetry is the future for setting up observability for cloud-native apps. It is backed by a huge community and covers a wide variety of technology and frameworks. Using OpenTelemetry, engineering teams can instrument polyglot and distributed applications with peace of mind.
Getting started with SigNoz
SigNoz cloud is the easiest way to run SigNoz. Sign up for a free account and get 30 days of unlimited access to all features.
You can also install and self-host SigNoz yourself since it is open-source. With 19,000+ GitHub stars, open-source SigNoz is loved by developers. Find the instructions to self-host SigNoz.
Further Reading
OpenTelemetry Collector - Complete Guide
OpenTelemetry Tracing - things you need to know

