Splunk is known for its powerful features — but it’s not the only option out there. Whether you're looking for something more affordable, easier to scale, or better aligned with your team’s workflow, there are plenty of alternatives worth exploring in 2025. In this guide, we’ll walk you through the top Splunk alternatives — including free, open-source, and enterprise-ready tools — to help you find the right fit for your needs
Why Teams Look for Splunk Alternatives
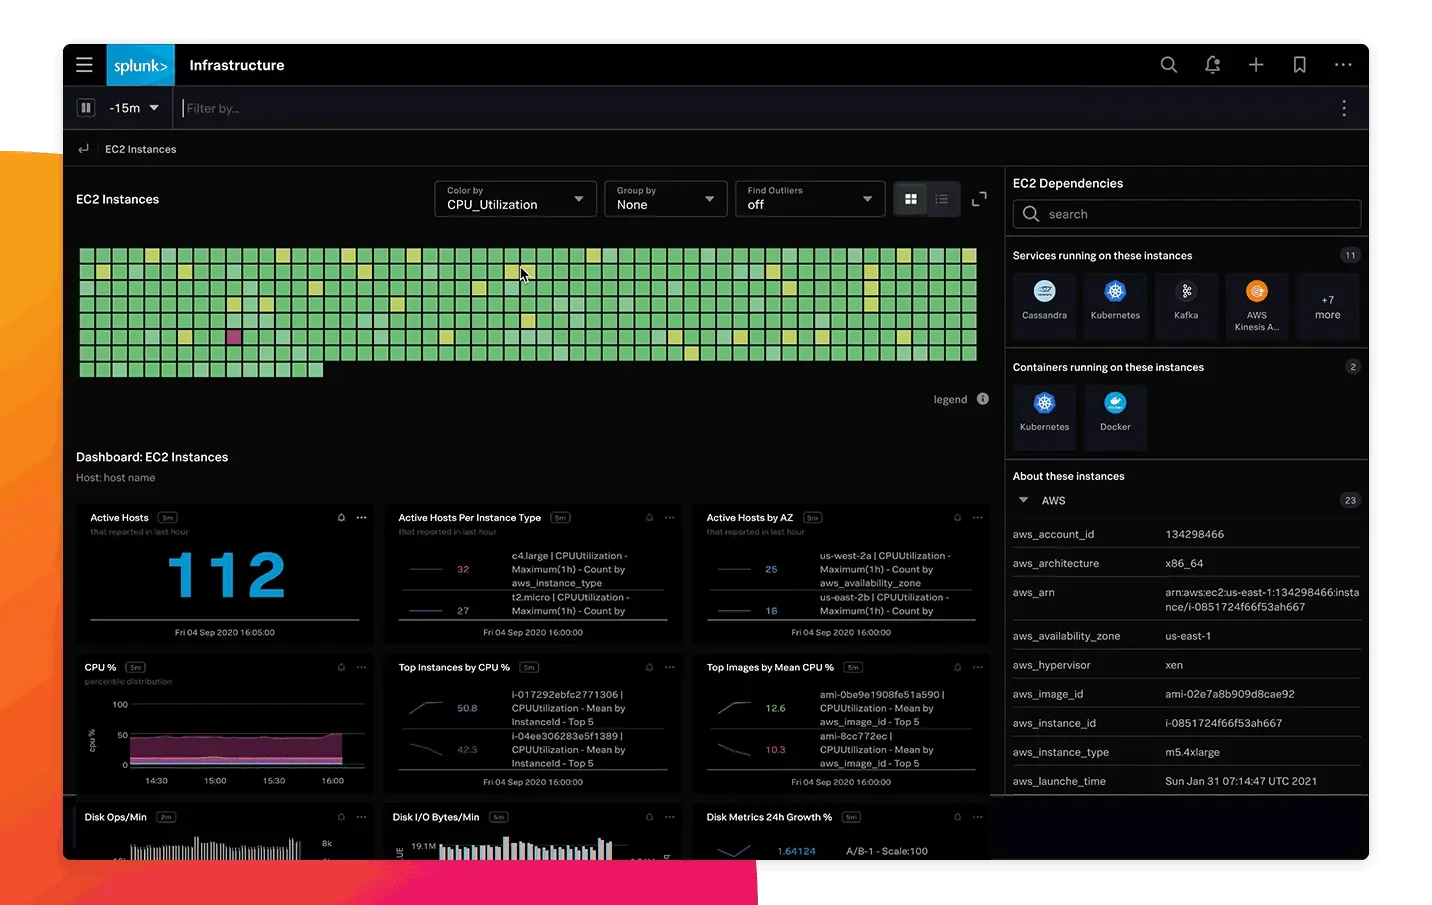
Despite Splunk's powerful capabilities, organizations are increasingly seeking alternatives due to several key challenges:
1. Vendor Lock-in
Splunk's proprietary formats and agents create significant barriers to migration, limiting flexibility and potentially increasing long-term costs.
2. High Infrastructure Costs
Splunk requires substantial computing resources and storage (2-3× ingestion volume), making scaling prohibitively expensive, even in cloud deployments.
3. Performance Issues
At high data volumes, indexing lags and search performance degrades without extensive query optimization, causing delayed insights.
4. Complex Scaling
Petabyte-scale deployments demand specialized expertise and continuous tuning, with configurations that work at smaller scales often failing at larger ones.
5. Cloud Limitations
Splunk's cloud offering typically underperforms compared to on-premises deployments, with slower historical searches and more complicated integrations with internal systems.
Top 11 Splunk Alternatives
Before diving into the detailed analysis of each Splunk competitor, here is a summary table to give you a quick overview of the top 11 tools along with their cost considerations.
| Tool | Deployment Model Type | Why Choose Over Splunk | Cost |
|---|---|---|---|
| SigNoz | Self-hosted / Cloud | Offers open-source transparency, built-in OpenTelemetry support, and greater pricing flexibility. | Free (Open Source); Cloud version available with additional features |
| Graylog | Self-hosted / Cloud | Scalable and cost-effective with strong alerting and log correlation capabilities. | Free (Open Source); Cloud version available with additional features |
| Loggly | SaaS-based | Easy SaaS setup and smooth integrations | Free Lite tier; Paid plans available |
| Dynatrace | Cloud-based | AI-powered automation and full-stack observability streamline complex monitoring needs. | Usage-based pricing with annual commitment |
| New Relic | Cloud-based | Generous free tier and transparent usage-based pricing model reduce long-term costs. | Free tier with 100GB/month; Usage-based pricing beyond that |
| Datadog | Cloud-based | Highly extensible with broad integrations and real-time analytics. | Usage-based pricing; Free trial available |
| Logz.io | Cloud-based | Built on open-source tools with AI-assisted analysis and flexible data optimization. | Usage-based pricing; Free trial available |
| Logstash | Self-hosted | Ideal for data parsing and routing in custom logging pipelines. | Free (Open Source); Paid support available |
| Fluentd | Self-hosted | Lightweight, efficient, and flexible for unified logging. | Free (Open Source); Enterprise support available |
| AppDynamics | Cloud-based / On-prem | Combines application performance monitoring with business insights and user analytics. | Paid; Pricing varies based on deployment and features |
| Mezmo (Formerly LogDNA) | Cloud-based | Simple, scalable, and developer-friendly with strong real-time search features. | Free Community tier; Paid plans with additional features |
Now, let's dive deep into the detailed features and benefits of each of these top Splunk alternatives to help you find the best fit for your needs.
SigNoz
SigNoz is an open-source observability platform that unifies logs, metrics, and traces within a single interface. Built natively on OpenTelemetry, it offers developers and DevOps teams a vendor-neutral, cost-effective alternative to proprietary tools like Splunk. SigNoz leverages Columnar Database for high-performance data storage and querying, making it suitable for monitoring modern distributed systems.
Splunk Use Cases You Can Replace with SigNoz
- Log Aggregation and Analysis: SigNoz supports log collection through OpenTelemetry, providing structured querying capabilities via its Query Builder. This allows for efficient log analysis and visualization, similar to Splunk's log management features.
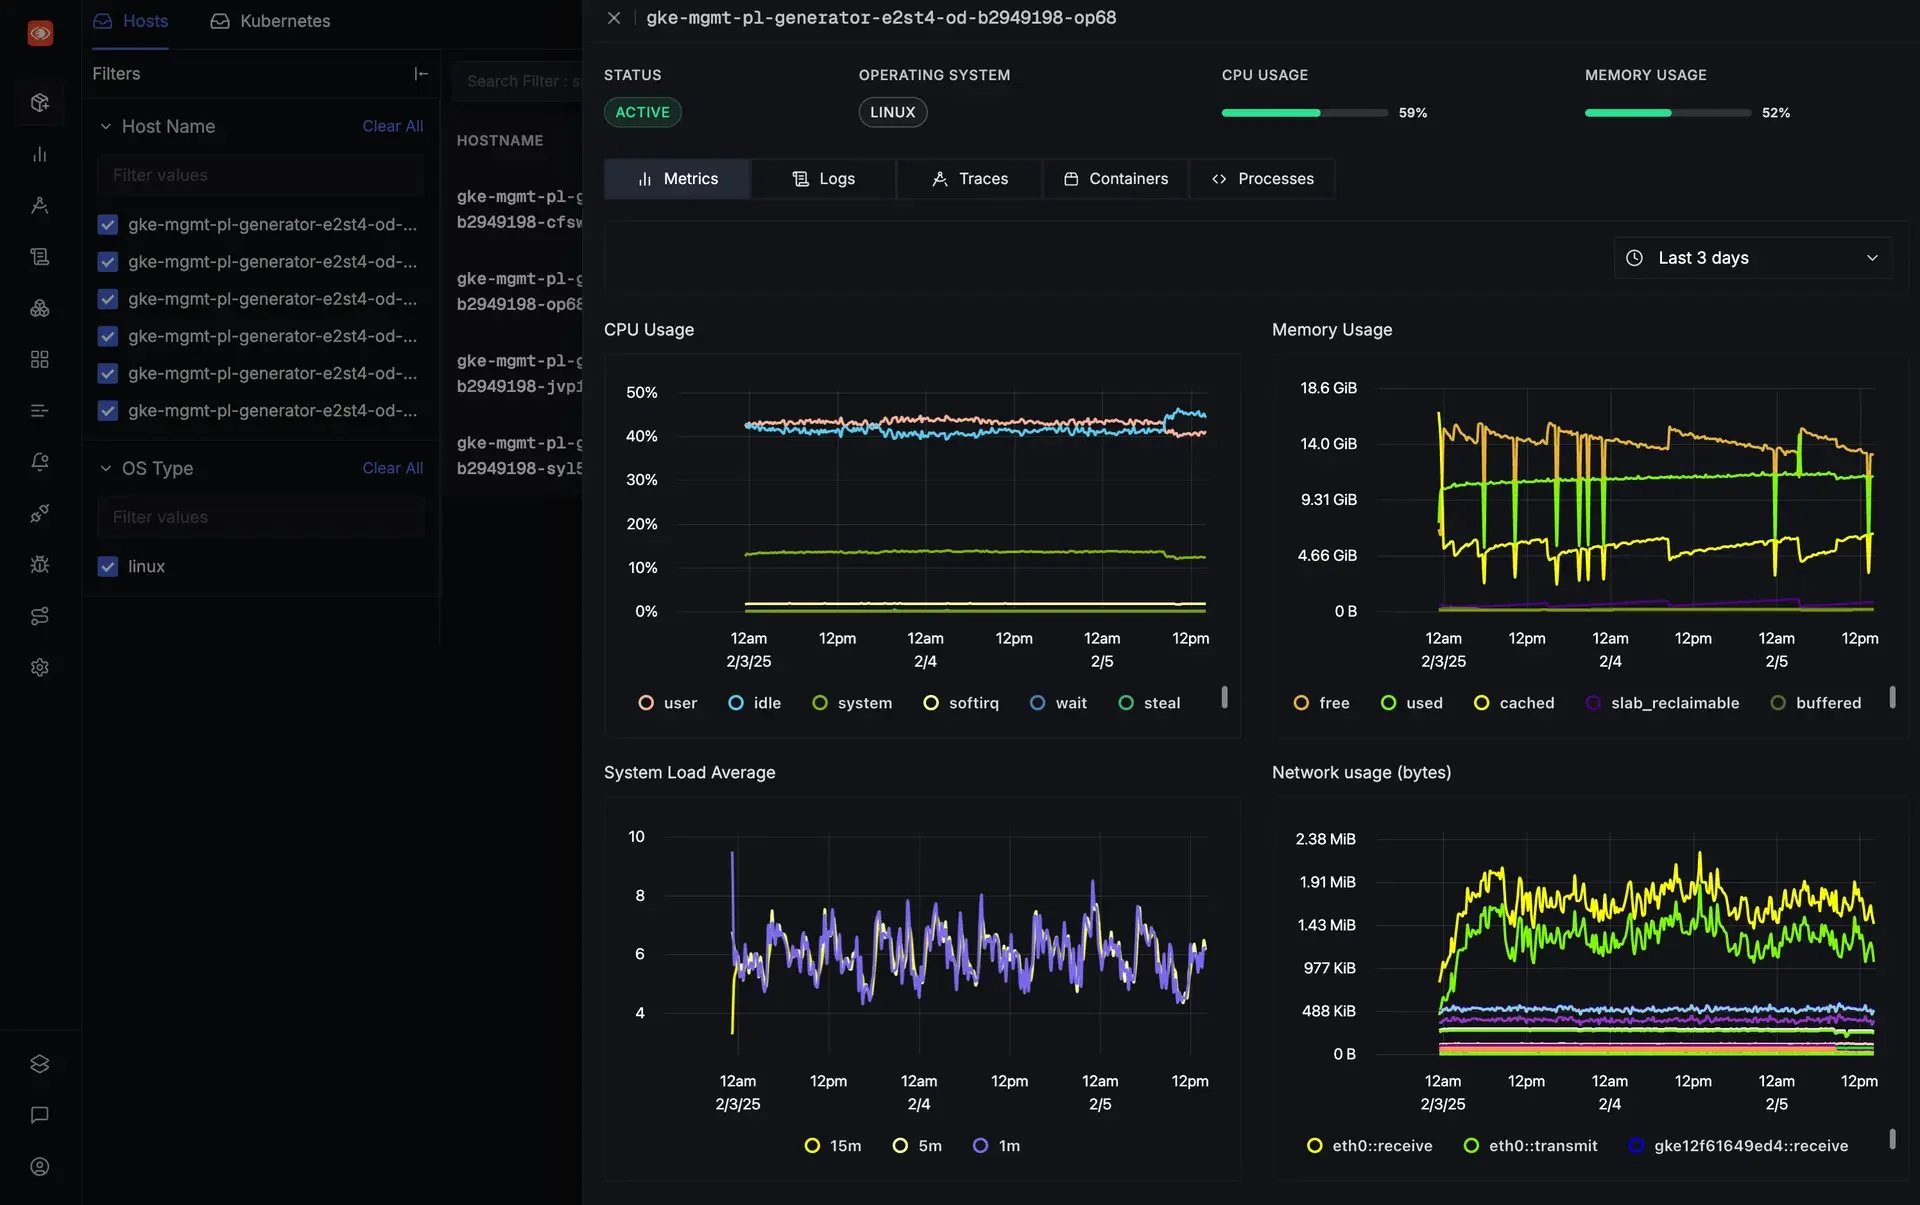
- Infrastructure Monitoring: With pre-built dashboards, SigNoz enables monitoring of host metrics, including CPU usage, memory consumption, and network activity. This functionality parallels Splunk's infrastructure monitoring capabilities.
- Application Performance Monitoring (APM) and Distributed Tracing: SigNoz offers distributed tracing and APM features, allowing users to trace requests across services and identify performance bottlenecks. This mirrors Splunk's APM functionalities.
- OpenTelemetry-Native Pipelines: Unlike Splunk, which may require proprietary agents, SigNoz is built to work seamlessly with OpenTelemetry. This design choice facilitates flexible telemetry data pipelines and reduces vendor lock-in.
SigNoz cloud is the easiest way to run SigNoz. Sign up for a free account and get 30 days of unlimited access to all features.

You can also install and self-host SigNoz yourself since it is open-source. With 20,000+ GitHub stars, open-source SigNoz is loved by developers. Find the instructions to self-host SigNoz.
Graylog
Graylog is an open-source log management platform designed for centralized log collection, storage, and analysis. It provides an easy-to-use interface for searching and analyzing logs, and it supports custom dashboards, alerting, and integration with various data sources, making it suitable for large-scale environments.
Splunk Use Cases You Can Replace with Graylog
- Log collection and aggregation: Like Splunk, Graylog serves as a centralized platform for aggregating logs from various sources (servers, network devices, applications, etc.). It supports a wide range of input plugins, including syslog, GELF, and Beats, making it a powerful alternative to Splunk’s forwarders for log collection.
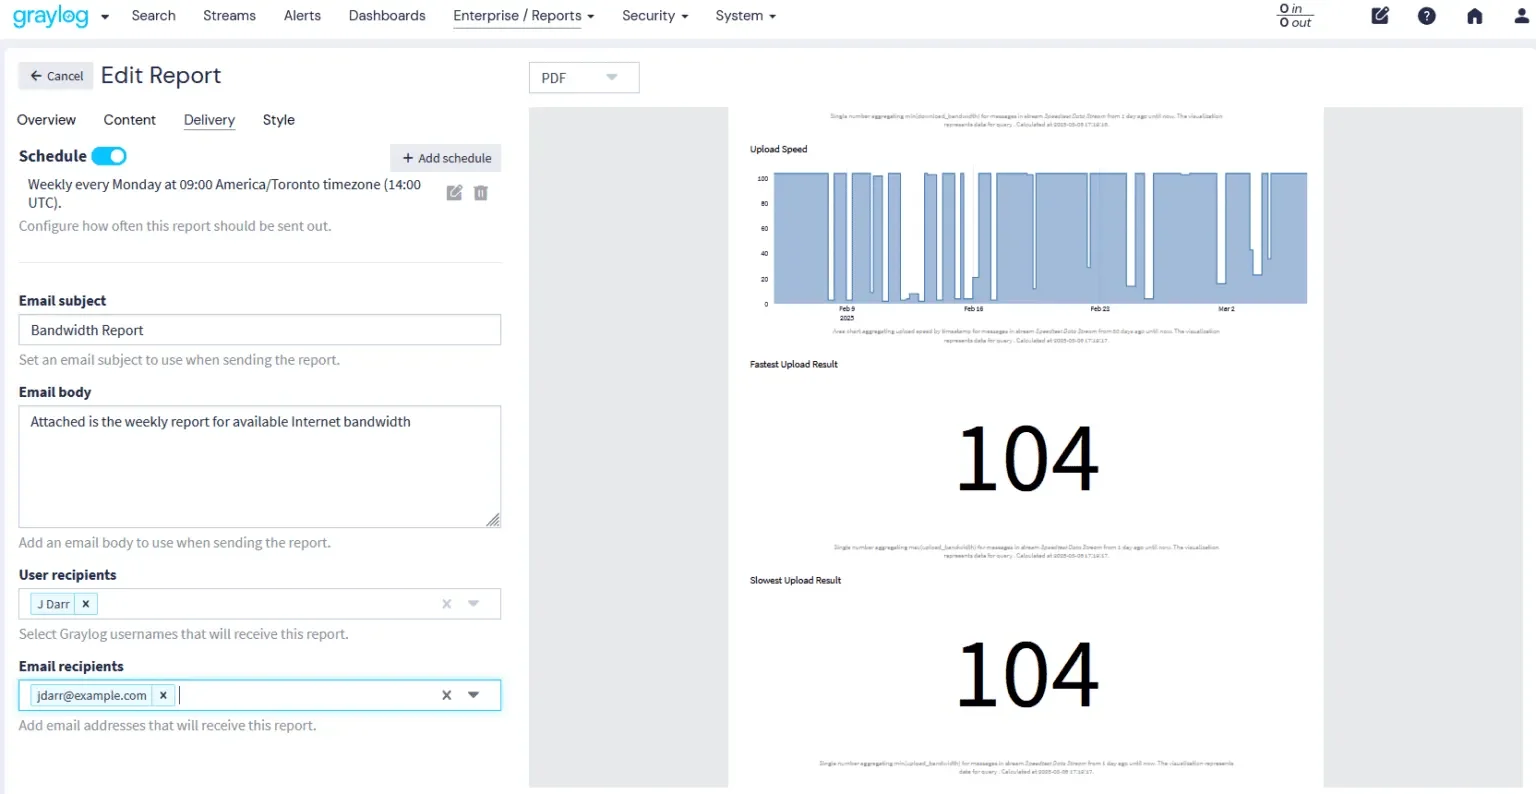
- Alerting and notification: Graylog offers alerting and notification capabilities, allowing teams to set up real-time alerts on log data. This can replace Splunk’s alerting features, providing users with notifications for specific log patterns, errors, or anomalies.
- Custom dashboards and visualization: Graylog allows users to create custom dashboards to visualize log data and key metrics. Its interface, built on top of Elasticsearch, supports powerful visualizations similar to Splunk’s dashboard capabilities, although it’s more lightweight.
- Cost-effective log management: For users concerned with Splunk’s high data ingestion costs, Graylog provides a more cost-effective solution. Since it’s open-source and supports flexible scaling, it can help teams control their costs while still offering powerful log management capabilities.
Loggly
Loggly is a cloud-based log management and monitoring tool that simplifies the process of collecting, aggregating, and analyzing log data. Known for its fast search capabilities and user-friendly interface, Loggly helps teams quickly identify and troubleshoot issues within their applications and infrastructure. It integrates easily with cloud environments, containers, and various third-party tools, making it a popular choice for teams looking for a straightforward log management solution.
Splunk Use Cases You Can Replace with Loggly
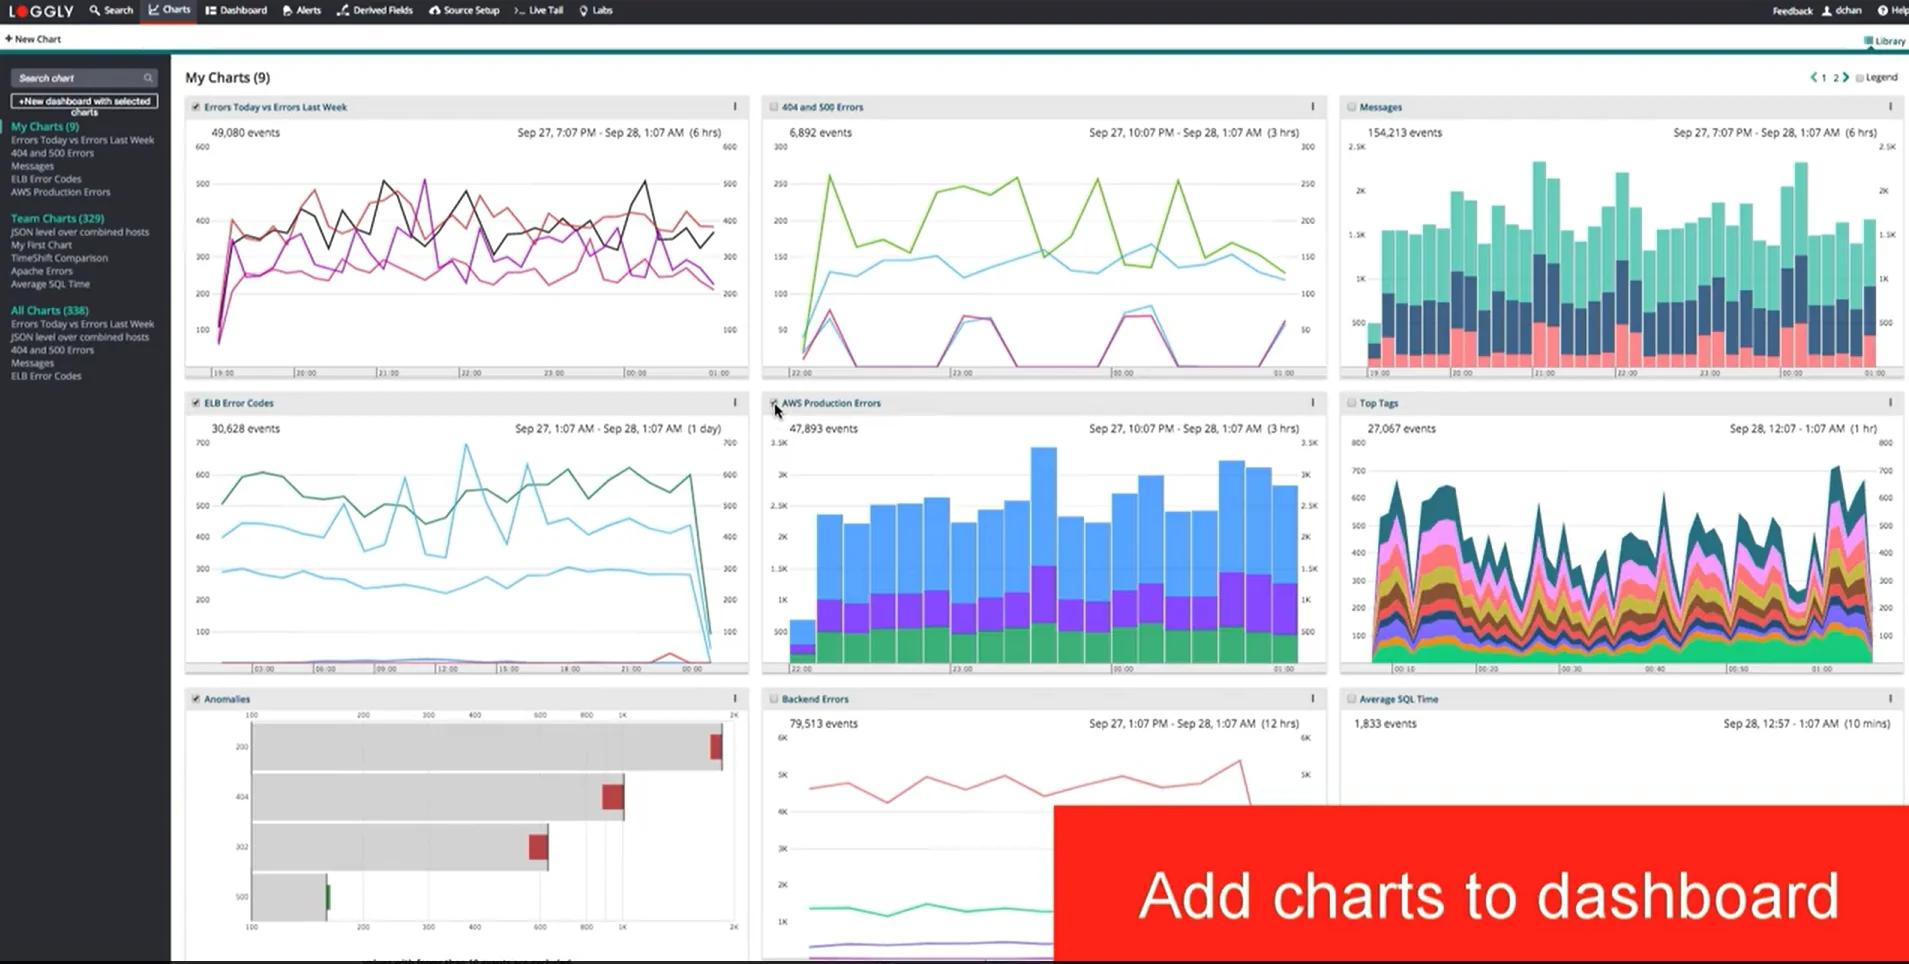
- Log Search and Analysis: With powerful search features and a simplified query interface, Loggly enables teams to search and analyze logs in real time. While Splunk offers a more advanced query language (SPL), Loggly’s search capabilities, while not as deep as Splunk's, are more accessible for teams looking for an easy-to-use log search tool with less complexity.
- Real-time Log Monitoring and Alerts: Loggly offers real-time log monitoring with the ability to set up custom alerts based on specific log events, thresholds, or patterns. This feature can replace Splunk's log alerting system, offering simpler and more intuitive configurations while still providing essential notifications for critical events.
- Cloud-Native Log Management: Loggly is designed to work seamlessly in cloud-native environments and integrates easily with cloud services and containerized environments like Kubernetes. It can replace Splunk for cloud-first organizations that require a lightweight, cost-effective solution for log management without needing the complexity of Splunk's enterprise-grade features.
- Cost-Effective Log Management: Loggly is known for its affordable pricing model, particularly when compared to Splunk’s usage-based pricing, which can become costly at scale. Loggly’s pay-per-use model provides flexibility for teams with moderate log volumes, making it an attractive alternative for organizations looking for a more cost-effective solution.
Dynatrace
Dynatrace is an all-in-one observability platform that combines application performance monitoring (APM), infrastructure monitoring, log management, and user experience monitoring into a single solution. Known for its AI-powered analytics, Dynatrace provides deep insights into complex cloud-native environments, offering automatic discovery and monitoring of applications and services.
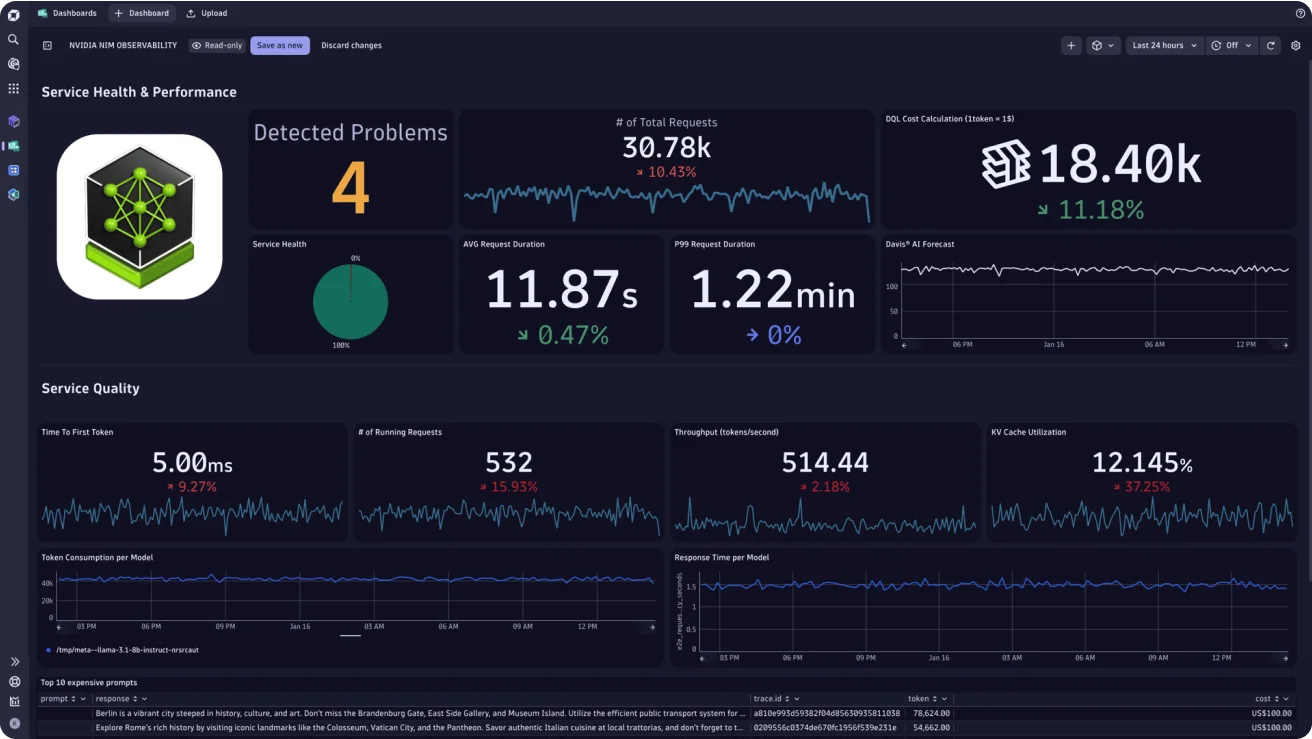
Splunk Use Cases You Can Replace with Dynatrace
- Application Performance Monitoring (APM): Dynatrace delivers robust APM features with AI-powered root cause analysis, automated tracing, and full-stack observability. It can replace Splunk’s APM by offering deeper automation and faster issue resolution.
- Infrastructure and Cloud Monitoring: With support for AWS, Azure, GCP, and Kubernetes, Dynatrace’s OneAgent auto-discovers and monitors infrastructure components, making it a strong alternative to Splunk’s infrastructure monitoring.
- Dashboards and visualizations: Dynatrace offers customizable dashboards that integrate closely with its AI-driven insights. Compared to Splunk, the visualizations are more automated and context aware.
- Alerting and anomaly detection: Dynatrace’s Davis Engine uses AI to detect anomalies and trigger alerts based on dynamic baselines, offering smarter, noise-reduced alerting compared to Splunk’s rule-based approach.
New Relic
New Relic is a comprehensive cloud-based observability platform that combines real-time application performance monitoring (APM), infrastructure monitoring, logs, and user experience analytics. It is known for its deep application insights, ease of use, and tight integration with cloud environments, making it a preferred choice for developers and DevOps teams.
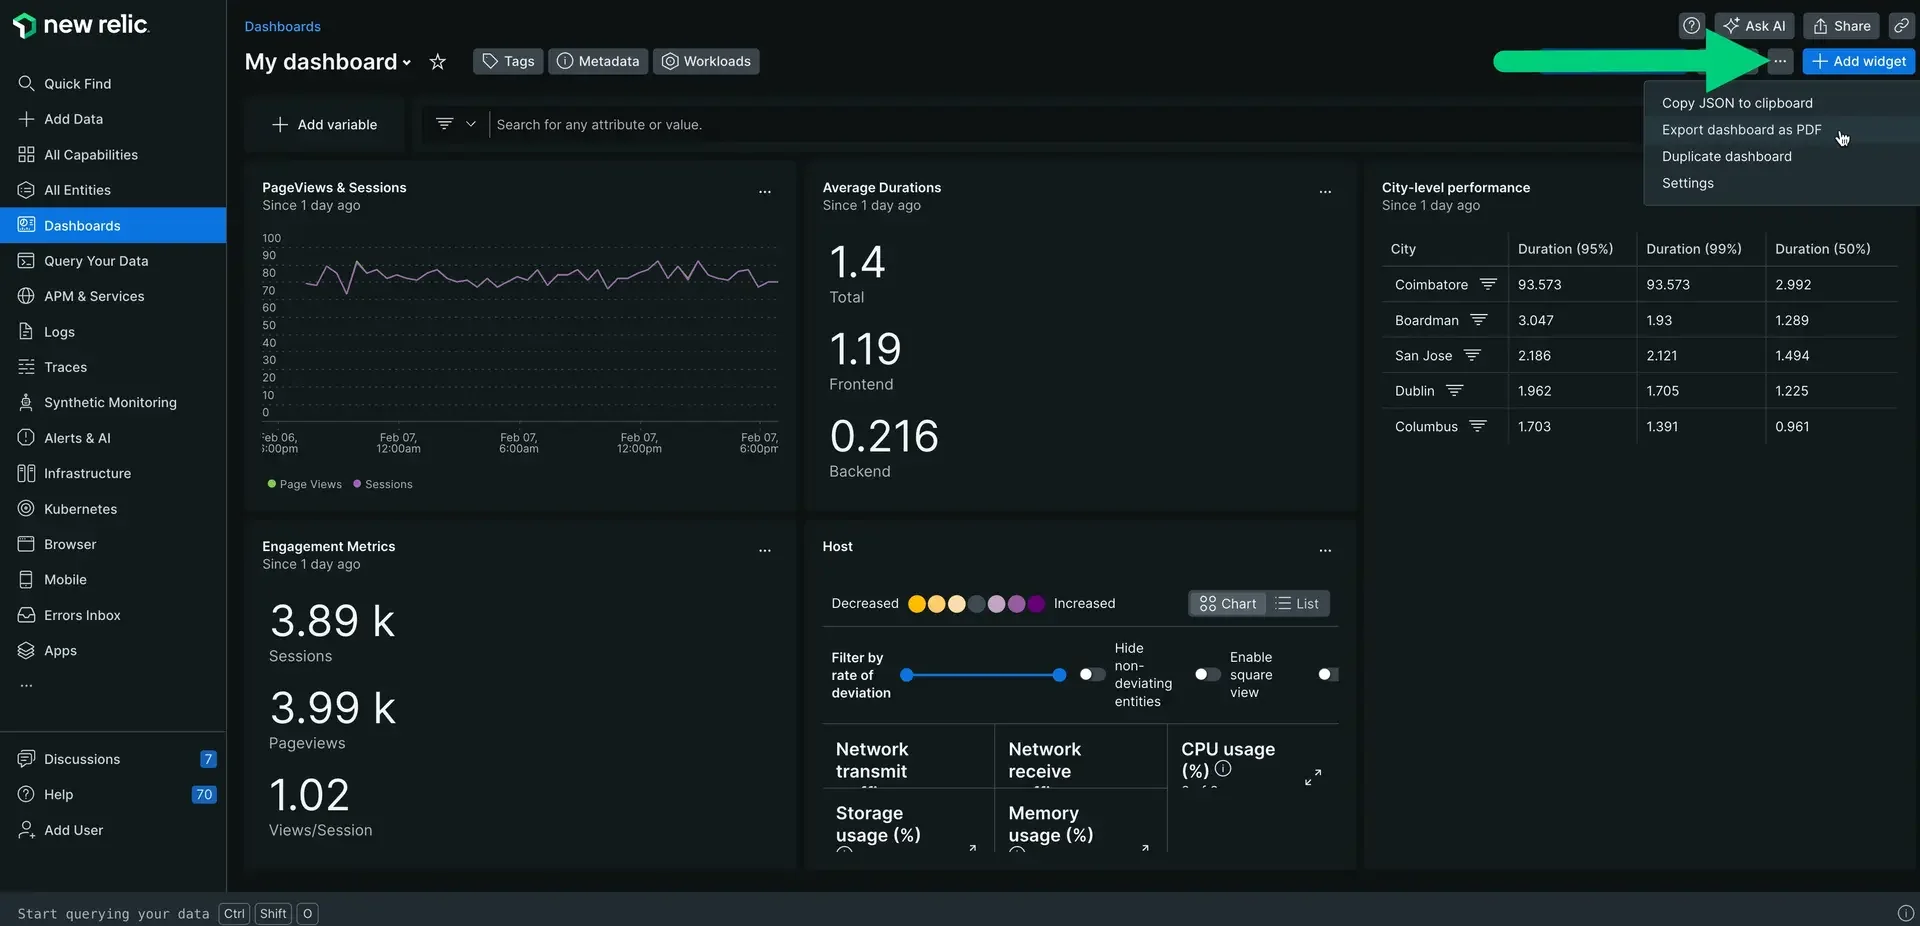
Splunk Use Cases You Can Replace with New Relic
- Application Performance Monitoring (APM): New Relic offers detailed transaction traces, error analytics, and slow transaction breakdowns, making it a capable replacement for Splunk’s APM to monitor application health and spot bottlenecks in real time.
- Infrastructure monitoring: It tracks server, container, and cloud resource performance across AWS, GCP, and Azure—serving as an alternative to Splunk for unified cloud infrastructure visibility.
- Dashboards and Visualization: New Relic provides customizable dashboards for logs, metrics, and traces. While comparable to Splunk, its dashboards are more application-focused and integrated across the observability stack.
- Alerting and Anomaly Detection: With machine learning–powered anomaly detection, New Relic offers smarter, noise-reduced alerts compared to Splunk’s threshold-based system—helping teams focus on what matters.
Datadog
Datadog is a cloud-native observability platform that provides end-to-end monitoring across logs, metrics, traces, infrastructure, and security. It offers a unified dashboard experience with powerful built-in analytics, machine learning-based alerting, and seamless integrations for cloud providers, CI/CD tools, and container platforms.
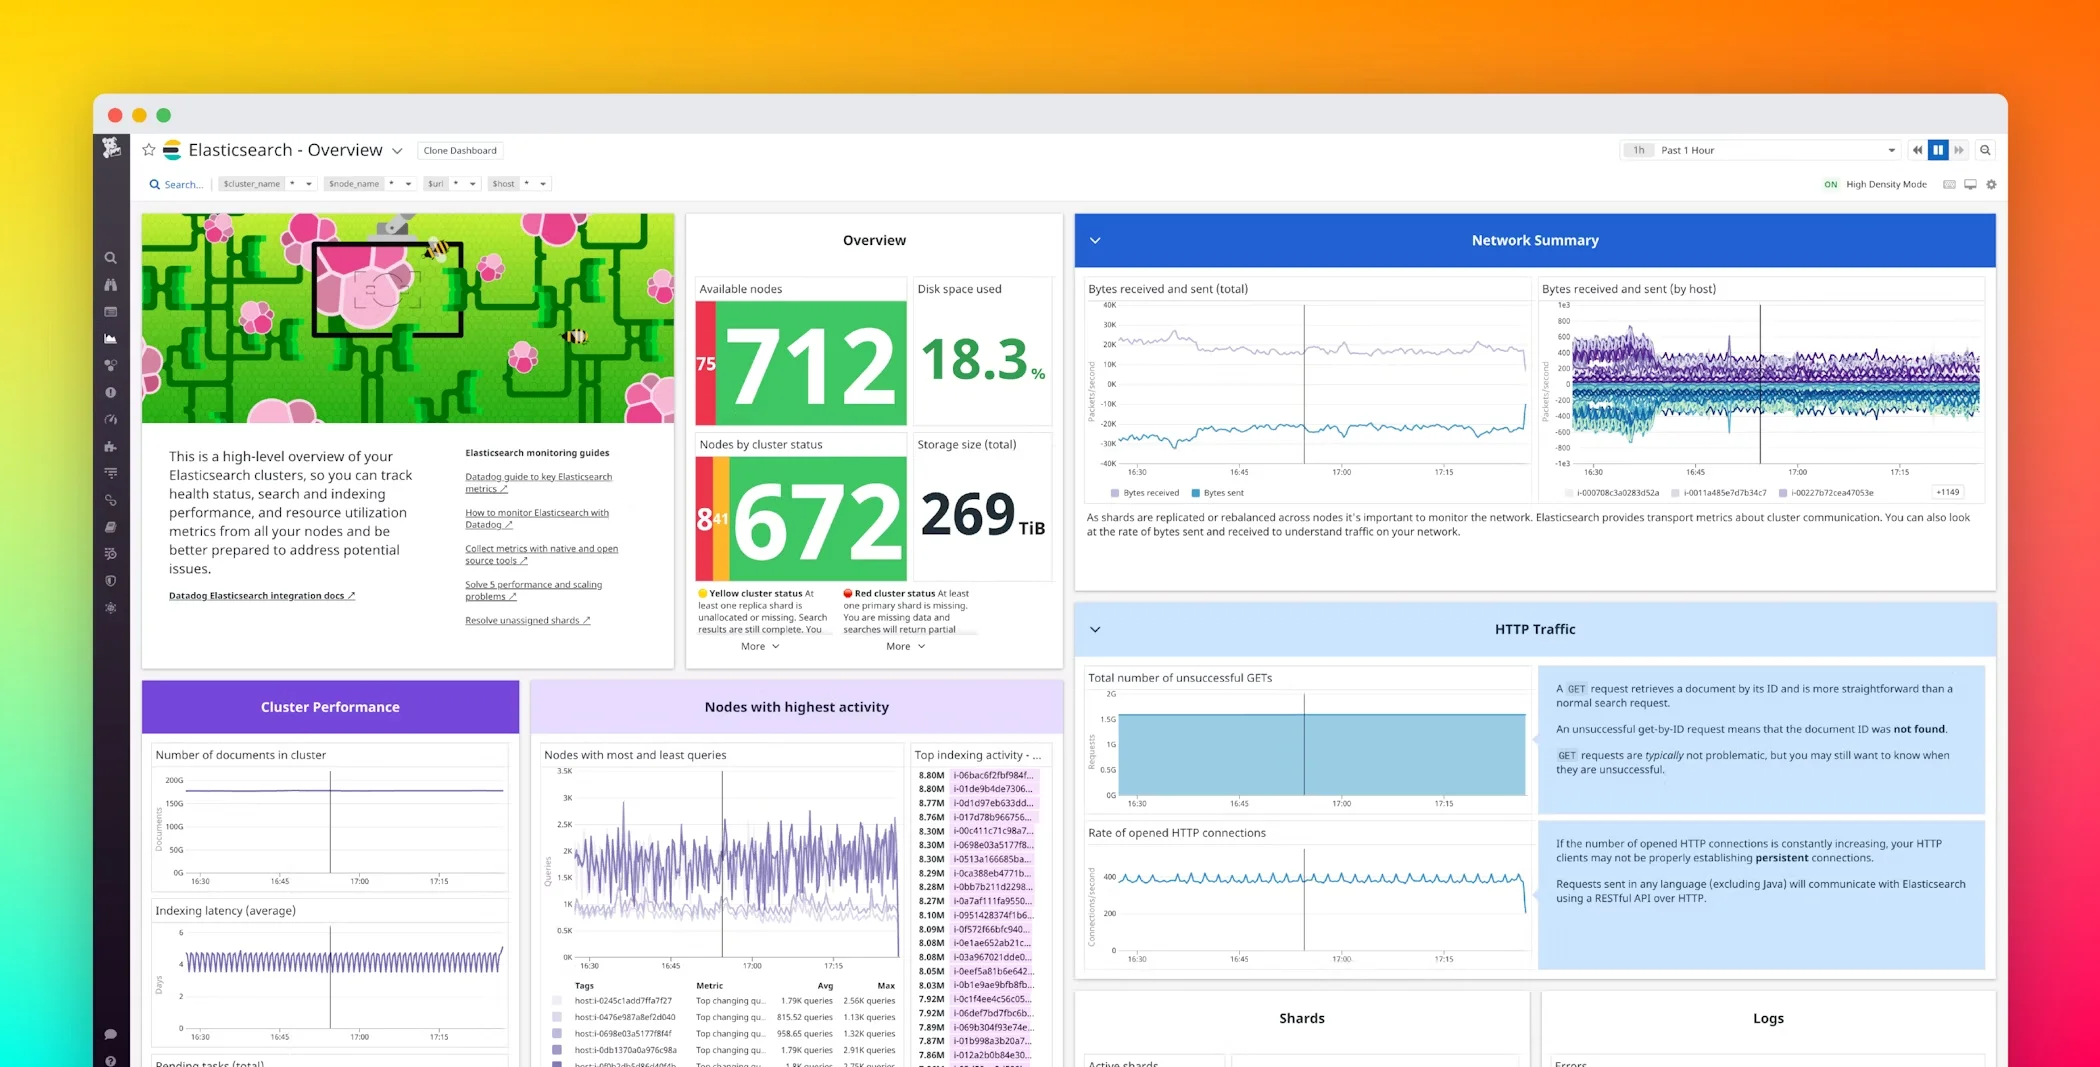
Splunk Use Cases You Can Replace with Datadog
- Full-Stack Observability: Unlike Splunk’s separate tools for infrastructure and APM, Datadog unifies logs, metrics, traces, and RUM into one platform—simplifying workflows and improving end-to-end visibility.
- APM and Distributed Tracing: Datadog provides service maps, flame graphs, and latency insights, making it a strong replacement for Splunk’s APM, especially for teams that want a more intuitive and developer-friendly interface.
- Dashboards and Alerting: Both tools excel here, but Datadog adds built-in ML-powered anomaly and outlier detection. Its real-time, interactive dashboards can effectively mirror or improve upon those in Splunk.
- Cloud-Native Integrations: Datadog offers seamless, out-of-the-box support for AWS, Azure, GCP, Kubernetes, and serverless environments—making it easier to adopt than Splunk, which may require more custom configuration.
Logz.io
Logz.io is a cloud-based observability platform built on top of popular open-source tools like Elasticsearch, Logstash, Kibana, Prometheus, and OpenTelemetry. It provides log management, metrics, traces, and security analytics in a managed, scalable SaaS environment with an open-source feel.
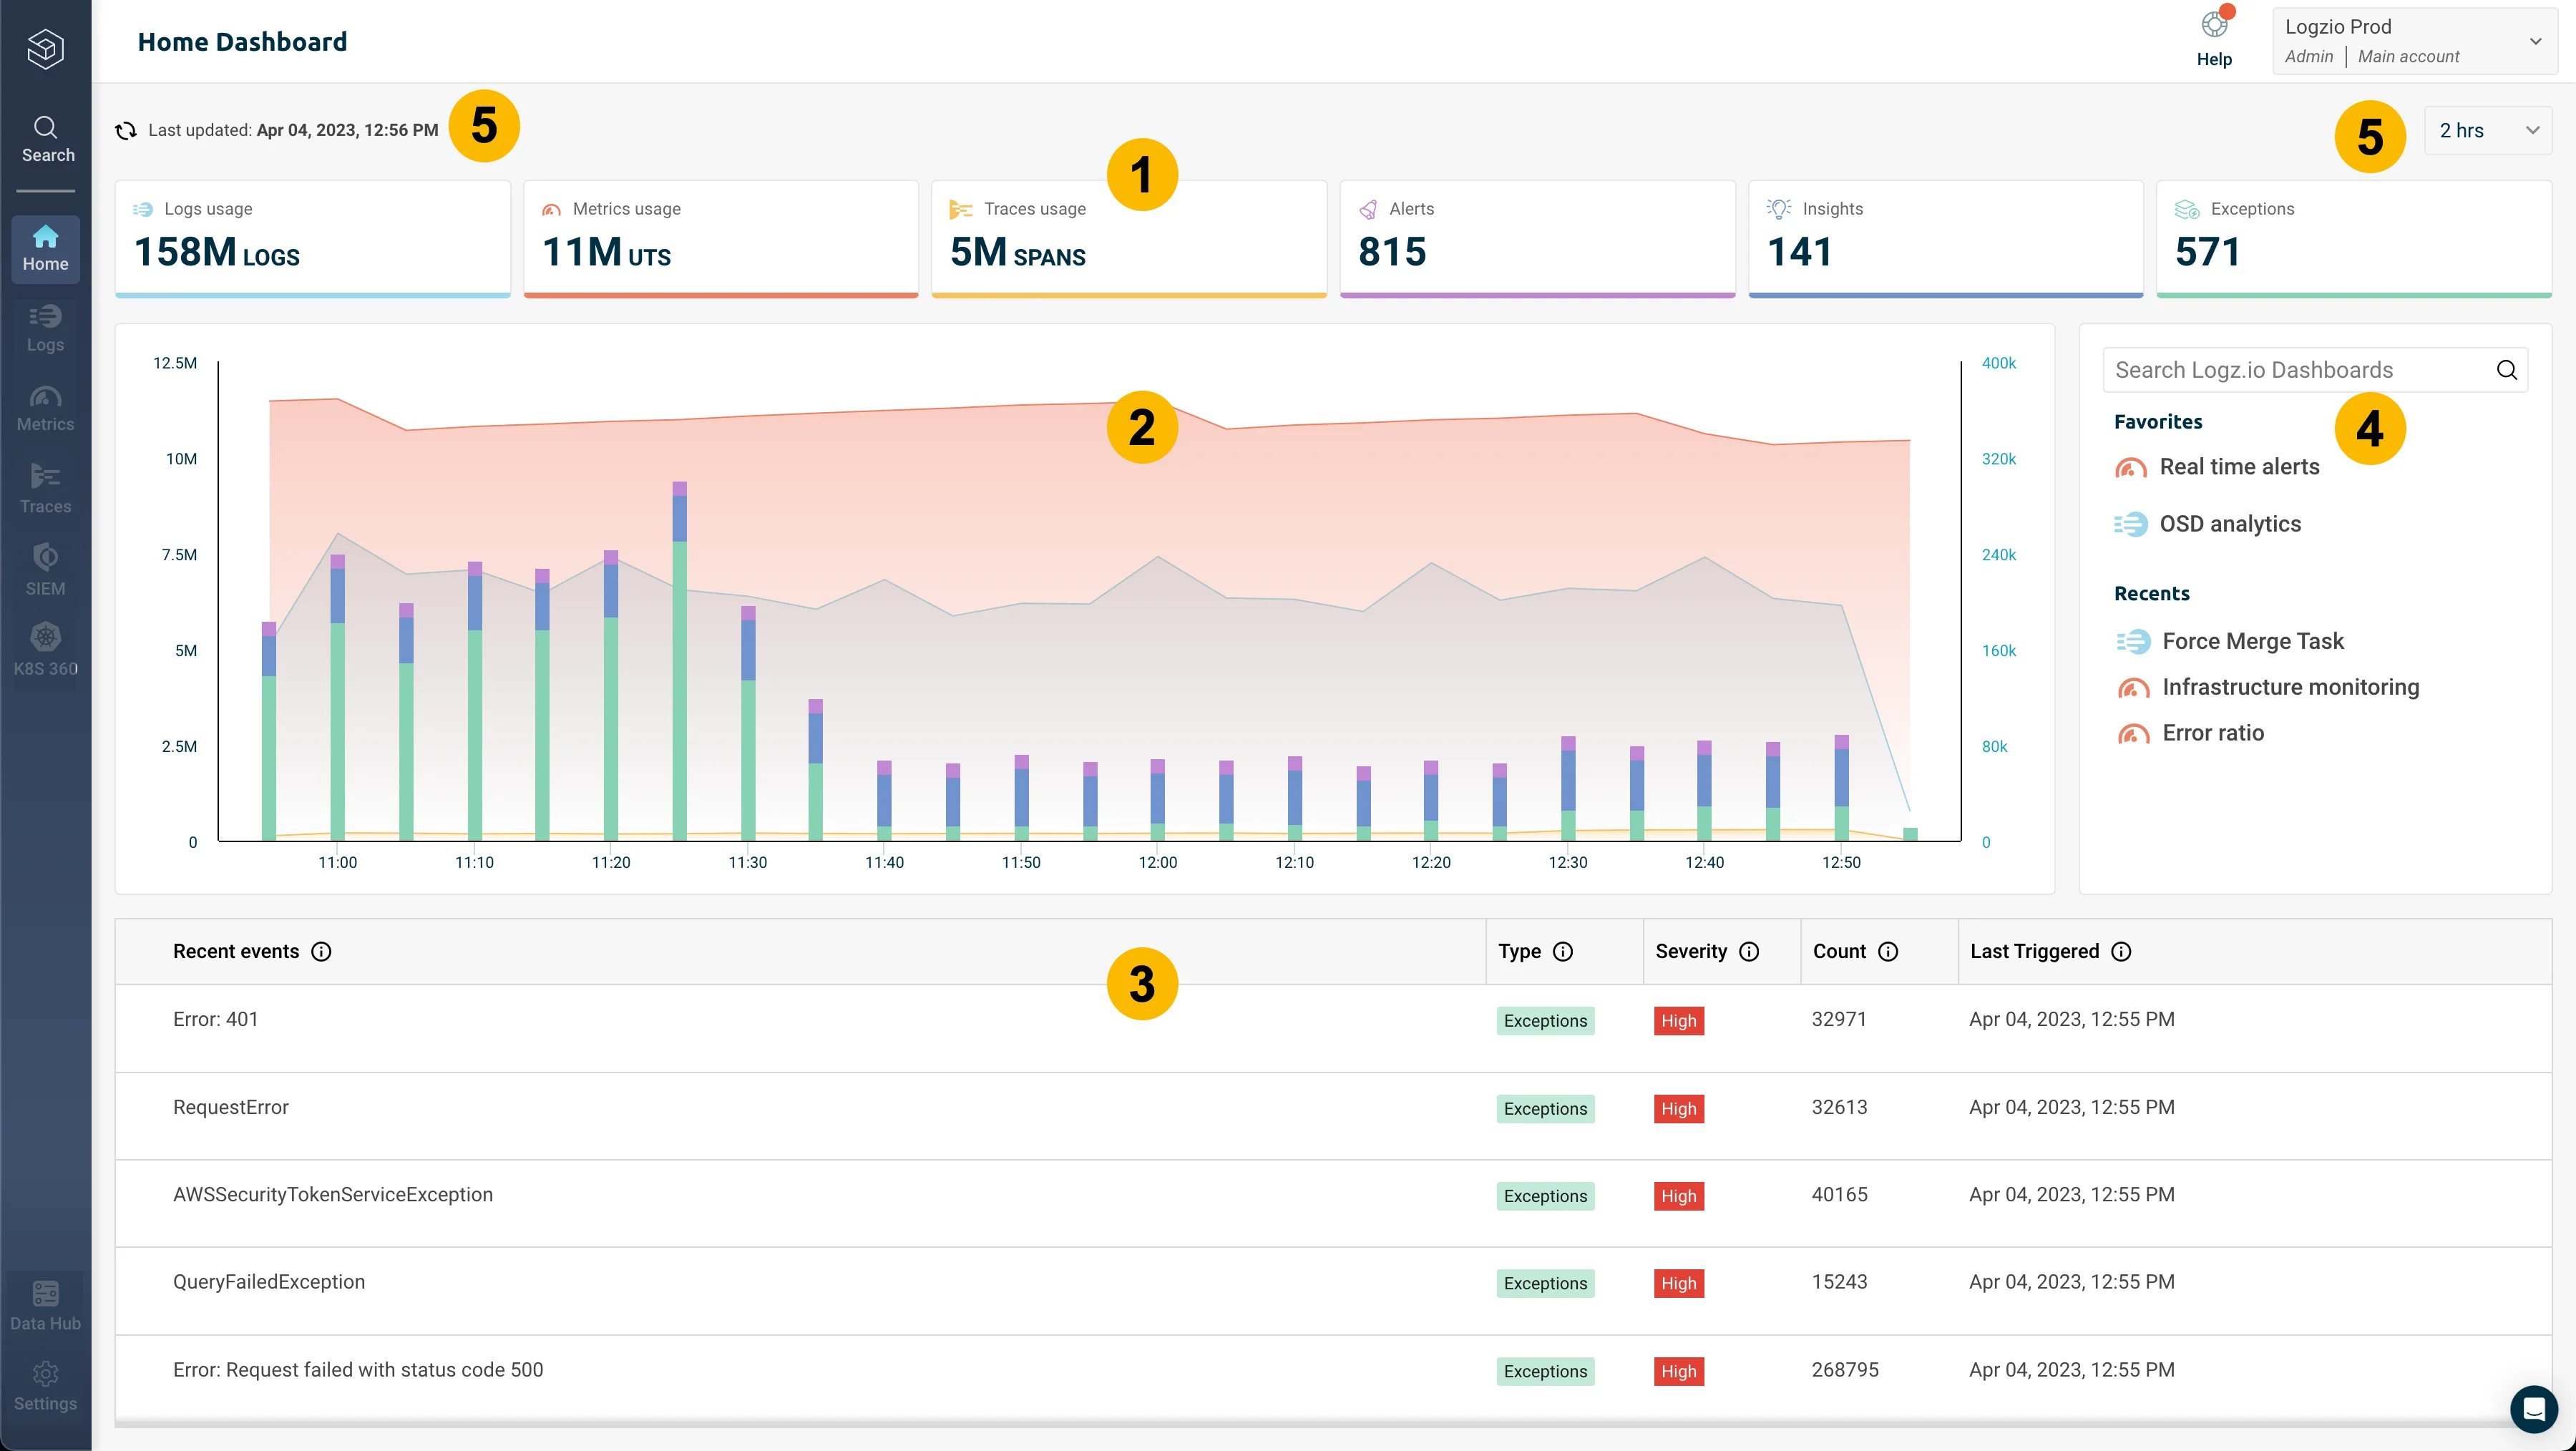
Splunk Use Cases You Can Replace with Logz.io
- Security Information and Event Management (SIEM): Logz.io’s Cloud SIEM offers real-time threat detection, alerting, and incident investigation, similar to Splunk's Enterprise Security. It’s cost-effective for smaller teams and leverages open-source rule sets like Sigma for security insights.
- OpenTelemetry-Based Tracing and Metrics: Logz.io supports OpenTelemetry natively, allowing users to replace Splunk's Observability Cloud for distributed tracing and Prometheus-compatible metrics in a unified platform.
- Lower Cost and Predictable Pricing: Logz.io offers more transparent, predictable pricing compared to Splunk, with features like indexing tiers and data retention policies to help control costs, making it an appealing alternative for teams looking to avoid steep data scaling costs.
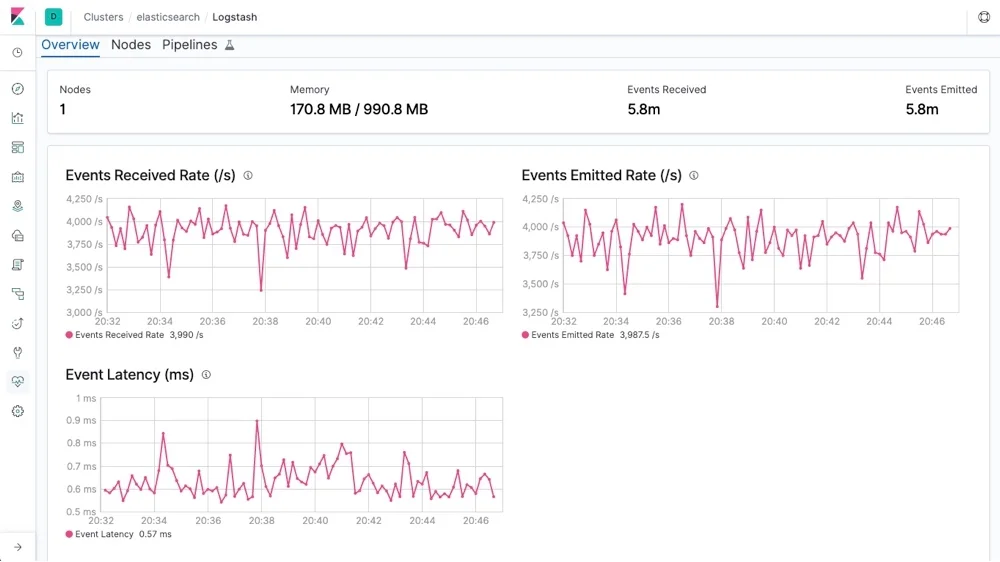
Logstash
Logstash is an open-source data processing pipeline from the Elastic Stack that ingests, transforms, and sends data from a variety of sources to your preferred destination—most commonly Elasticsearch. It excels at real-time log and event data collection, transformation, and routing, making it a powerful tool in observability and SIEM pipelines.
Splunk Use Cases You Can Replace with Logstash
- Ingesting and Transforming Logs from Multiple Sources: If you're using Splunk's forwarders or ingestion pipelines, Logstash can replace them by supporting a variety of input plugins (e.g., syslog, file, beats) and offering log enrichment and parsing through its filter plugins before sending data to storage backends like Elasticsearch.
- Centralized Log Processing Pipeline: Logstash can replicate Splunk's unified ingestion pipeline, offering more transparency and flexibility. It allows you to preprocess data (e.g., mask sensitive info, format timestamps, drop noise) before indexing, much like Splunk's
props.confandtransforms.conf. - SIEM Data Routing: In security data pipelines, Logstash ingests logs from sources like firewalls, IDS/IPS, and cloud environments, forwarding them to Elasticsearch, Kafka, or even Splunk in hybrid setups. This makes it a lightweight alternative for Splunk's data ingestion layer in SIEM use cases.
- Cost-Effective ETL for Observability: Unlike Splunk, which charges based on ingestion volume, Logstash can be part of a fully open-source Elastic stack setup, giving teams more control over scaling and costs, especially when paired with Elasticsearch and Kibana.
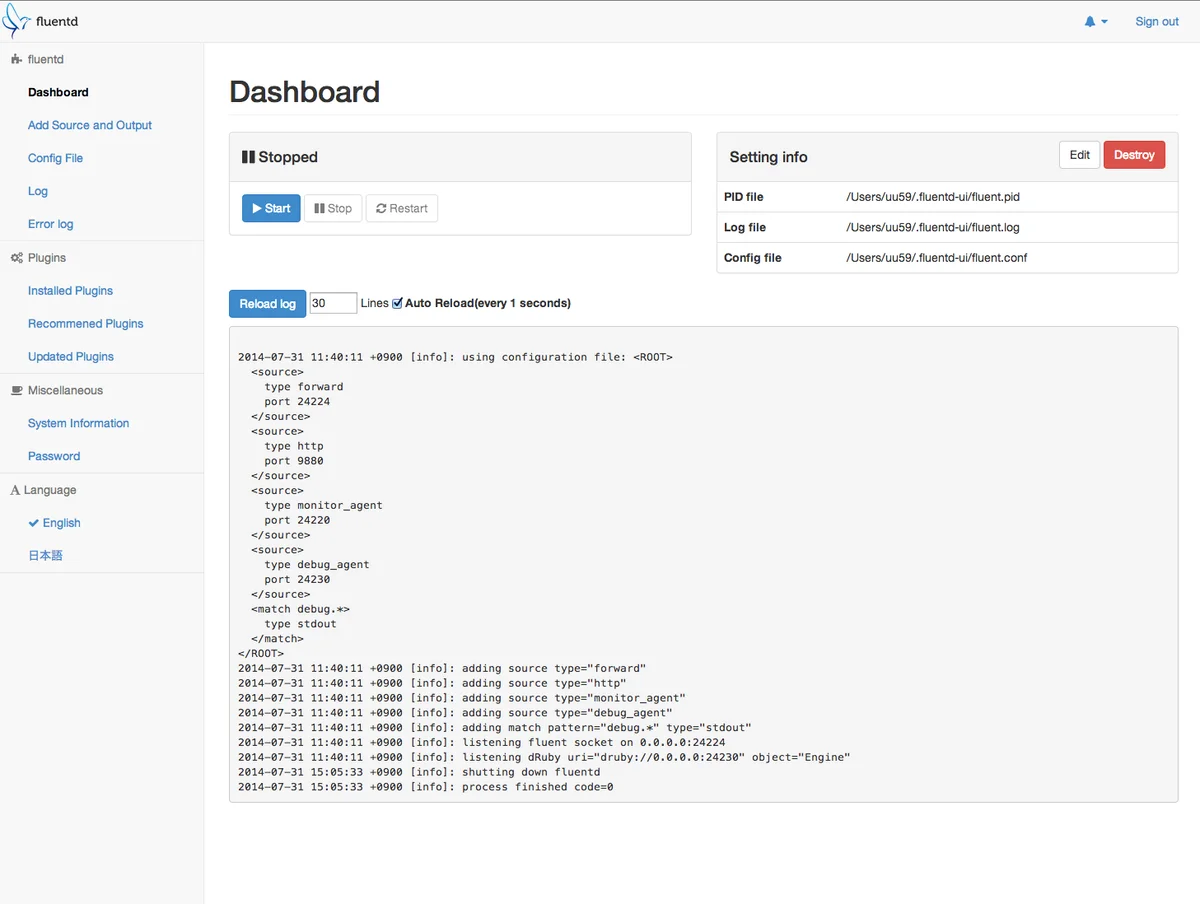
Fluentd
Fluentd is an open-source data collector that helps unify log data from multiple sources, normalize it, and route it to various outputs such as databases, cloud services, or file systems. Designed for high performance and minimal resource usage, Fluentd is widely adopted in cloud-native environments and supports a rich plugin ecosystem.
Splunk Use Cases You Can Replace with Fluentd
- Data Enrichment and Transformation: Fluentd enables on-the-fly log transformation, filtering, and formatting using its built-in plugins, similar to Splunk's field extractions and transforms, allowing you to enrich data before it’s sent to storage or indexing backends.
- Routing Logs to Multiple Destinations: Fluentd can send logs to various backends like Elasticsearch, OpenSearch, Kafka, or cloud services (e.g., Google Cloud Logging, Amazon CloudWatch), offering flexibility in environments where Splunk's tight coupling with its own stack may be limiting.
- Kubernetes-native Logging: Fluentd is widely used in Kubernetes for aggregating container logs and sending them to storage or analysis backends, often replacing Splunk’s HEC (HTTP Event Collector) or forwarders in cloud-native setups.
AppDynamics
AppDynamics is an application performance management (APM) and IT operations monitoring platform. It provides full-stack observability with real-time performance monitoring, deep application insights, infrastructure monitoring, and end-user experience analytics. AppDynamics is widely used for tracking application performance and identifying bottlenecks across cloud, on-premises, and hybrid environments.
Splunk Use Cases You Can Replace with Appdynamics
- Application Performance Monitoring (APM): AppDynamics offers real-time transaction tracing, bottleneck identification, and error analytics, providing deeper insights into application code-level performance and more granular visibility into transactions and dependencies, similar to Splunk's APM features.
- End-User Experience Monitoring: AppDynamics tracks how end-users interact with applications, providing insights into their journeys—a feature not native to Splunk but included in AppDynamics' suite, making it ideal for monitoring and improving the user experience.
- Log Aggregation and Analysis: AppDynamics integrates log management with APM, associating logs with performance data to create a unified view. This makes troubleshooting more efficient by correlating logs with application performance metrics, replacing Splunk’s separate log aggregation tool.
- Alerting and Automation: AppDynamics' AI-powered anomaly detection and dynamic baselining help teams monitor in real-time, automatically triggering alerts for abnormal behavior, offering smarter, AI-driven alerts and reducing the need for manual threshold tuning.
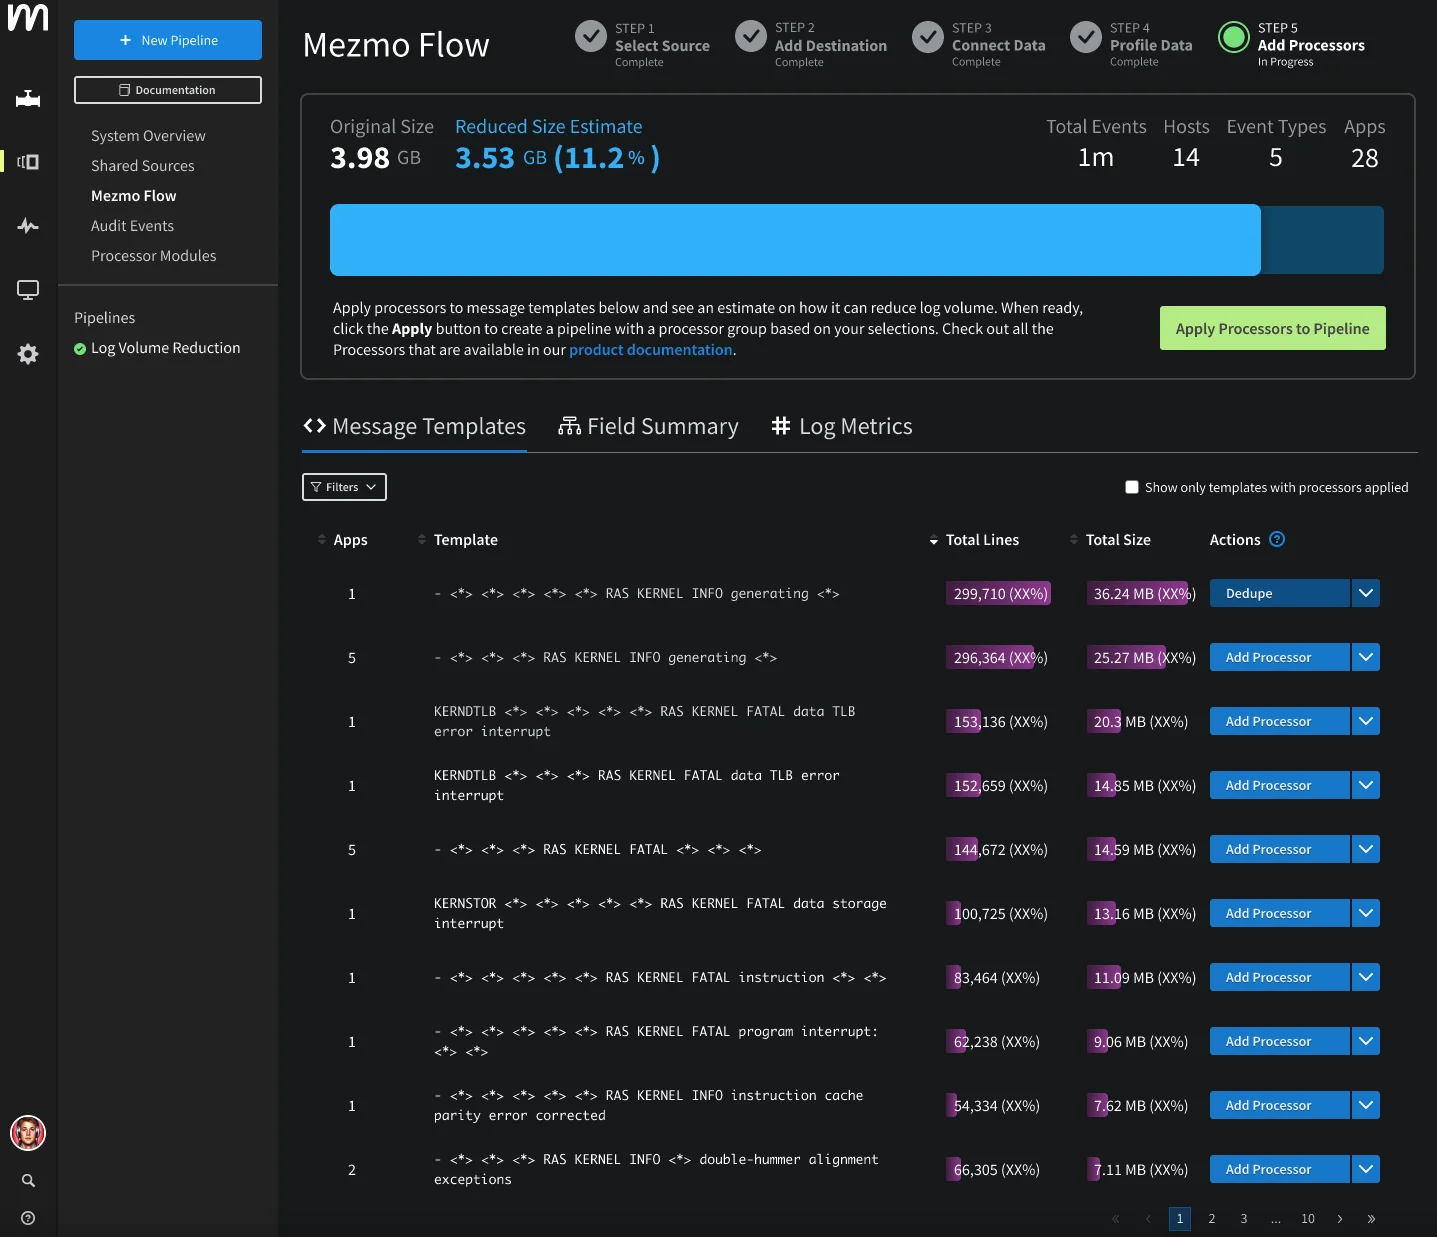
Mezmo (Formerly LogDNA)
Mezmo is a log management and observability platform designed to help teams aggregate, analyze, and visualize logs in real time. It provides scalable log management with cloud-native capabilities, offering integrations with various cloud environments, containers, and microservices. Mezmo's user-friendly interface and powerful search and filtering features make it an appealing choice for teams looking for simplified log aggregation and analysis.
Splunk Use Cases You Can Replace with Mezmo
- Log Search and Filtering: Mezmo offers fast, real-time search and filtering capabilities, allowing teams to search logs by parameters like time, log level, and custom tags. This replaces Splunk’s search functionality with a more intuitive, user-friendly experience while retaining powerful querying capabilities.
- Real-time Log Monitoring and Alerts: Mezmo provides real-time log monitoring with alerting, offering a simpler alternative to Splunk’s alerting system. It’s ideal for teams who don’t require the complexity of Splunk’s extensive alerting configurations.
- Cost-Effective Log Management: Mezmo offers a more cost-effective solution, particularly for smaller teams or those with limited log volume. For teams looking to replace Splunk due to high ingestion costs, Mezmo provides essential log management features at a more affordable price.
- Cloud-Native and Containerized Environments: Mezmo excels in managing logs in cloud-native environments, especially those using containers like Kubernetes. It integrates seamlessly with cloud providers and container orchestration tools, offering a simpler solution than Splunk for managing log data in cloud-native setups.
Key Takeaways
- Splunk has long been a dominant force in the realm of data analytics and observability, providing organizations with powerful tools to search, analyze, and visualize vast amounts of machine-generated data
- Splunk's resource-heavy nature leads to high infrastructure costs, requiring significant computational power for indexing, searching, and visualizing data
- Vendor lock-in is a substantial concern for many organizations using Splunk. Customers increasingly desire interoperability between their various technology platforms and want to avoid being tightly bound to a single vendor's ecosystem
- Organizations generally prefer solutions that grant them greater control over their data and allow for easier transitions between vendors if their needs change.
- SigNoz is an open-source observability platform that unifies logs, metrics, and traces within a single interface. Built natively on OpenTelemetry, it offers developers and DevOps teams a vendor-neutral, cost-effective alternative to proprietary tools like Splunk.
FAQs
What is the alternative of Splunk?
There are several alternatives to Splunk, including SigNoz, Graylog, Loggly, Dynatrace, New Relic, Datadog, Logz.io, Logstash, Fluentd, AppDynamics, and Mezmo.
What is the AWS tool like Splunk?
AWS offers Amazon CloudWatch and Amazon Elasticsearch Service (now known as Amazon OpenSearch Service) as tools similar to Splunk for monitoring and log analysis.
How is Splunk better than other tools?
Splunk excels with its powerful data analysis capabilities, extensive features for log management, real-time monitoring, and a robust ecosystem for integration with various tools and platforms.
Can Grafana replace Splunk?
Grafana is primarily a visualization tool and does not have the same extensive log management and data indexing capabilities as Splunk. However, it can complement tools like Elasticsearch or Prometheus for visualization purposes.
What is equivalent to Splunk in Azure?
In Azure, the equivalent to Splunk is Azure Monitor, which includes features for log analytics, application insights, and monitoring.
Is Splunk better than Elasticsearch?
Splunk and Elasticsearch serve different purposes. Splunk is a complete solution for log management, monitoring, and analysis, while Elasticsearch is a search and analytics engine often used as part of the ELK Stack (Elasticsearch, Logstash, Kibana). The choice depends on specific use cases and requirements.
What is the Microsoft equivalent of Splunk?
The Microsoft equivalent of Splunk is Azure Monitor, which provides similar capabilities for log management, monitoring, and analytics within the Azure ecosystem.
Is Splunk similar to Tableau?
Splunk and Tableau are used for different purposes. Splunk is focused on log management, monitoring, and data analysis, while Tableau is a powerful data visualization and business intelligence tool.
Are SIEM and Splunk the same?
SIEM (Security Information and Event Management) refers to a category of tools used for security monitoring and management, while Splunk is a specific platform that can serve as a SIEM tool among its other capabilities for log management and data analysis.
