Distributed Tracing For Finding Root Cause
of Application Performance Issues Quickly
Implement distributed tracing in your microservices-based applications powered by OpenTelemetry SDKs.
Track user requests across services to help you identify performance bottlenecks.
Correlated your traces with logs for quick debugging.


Distributed Tracing?

Application Metrics to Traces to Logs for Fast Troubleshooting
SigNoz provides logs, metrics, and traces under a single pane of glass. You can go from application metrics to traces to related logs with just 3 clicks. It helps you to debug application issues quickly. Powered by OpenTelemetry SDKs, you can set up tracing in your applications with just a few lines of code.

Quick analysis with Filters, Aggregates & Querying on Trace data
Trace data is full of rich context - that’s why we give you the power of quick analysis on your trace data with the ability to apply quick filters, create aggregates, and write complex queries. Our trace explorer comes packed with powerful features to analyze trace data quickly.

Advanced Trace Analytics powered by ClickHouse Queries
We use ClickHouse as a datastore for traces, and you can really go deep into your trace data by writing ClickHouse queries. For example, you can find out the average latency between two spans of interest in a trace. You can also create alerts on your trace data. With the power of writing ClickHouse Queries on your trace data, the possibilities are limitless.
Exceptions from Trace data
Record exceptions automatically with a stack trace and linked span data. By leveraging OpenTelemetry, we show you exceptions & errors in your application from trace data. OpenTelemetry auto-instrumentation libraries in Python, Java, Ruby, and Javascript can help you capture exceptions automatically.
Tracing Overview
Quick Filters of Spans
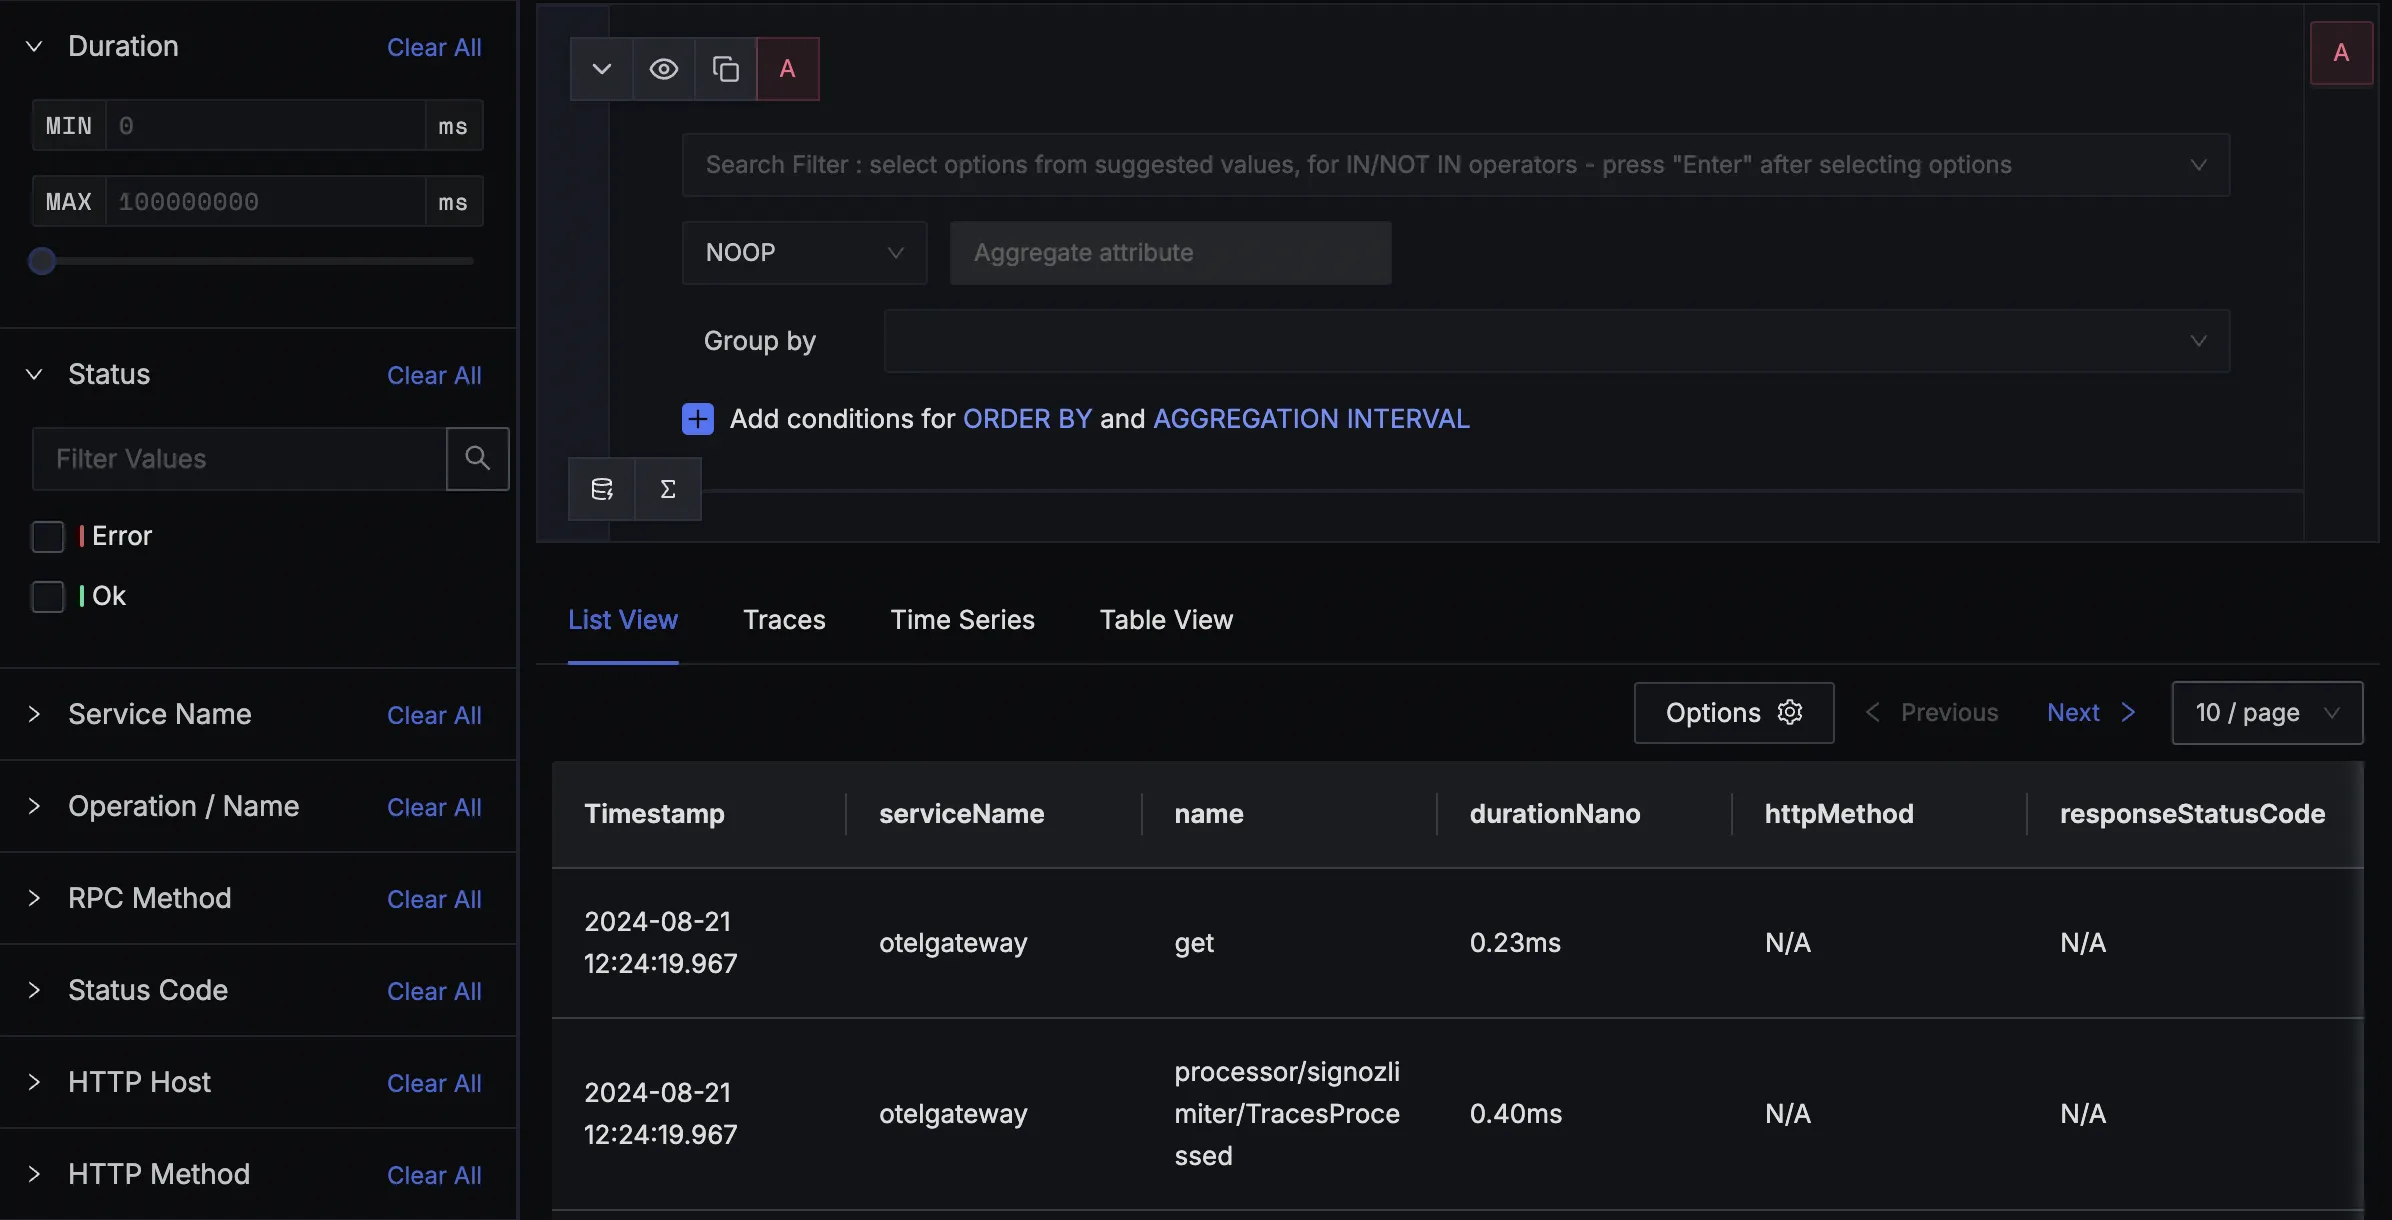
Quick filters let you see spans corresponding to specific status codes, service names, operations, RPC methods, etc.
Trace Query Builder
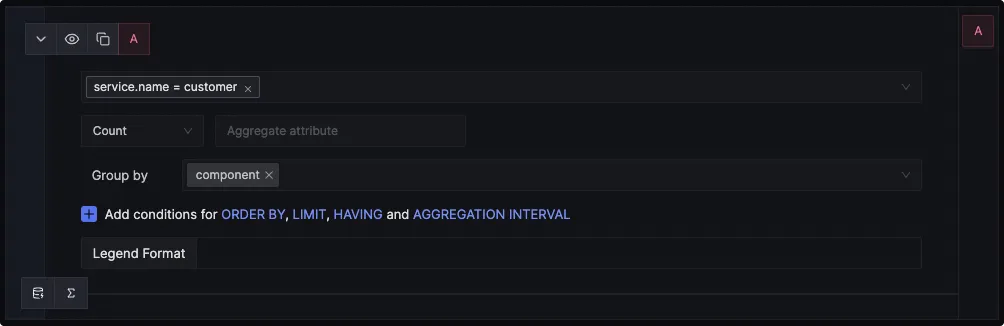
Apply various aggregations, such as count, sum, and average, and group your trace data based on selected attributes. Utilize multiple queries and formulas to dive deeper into your trace data and uncover valuable insights.
Different Compact Views
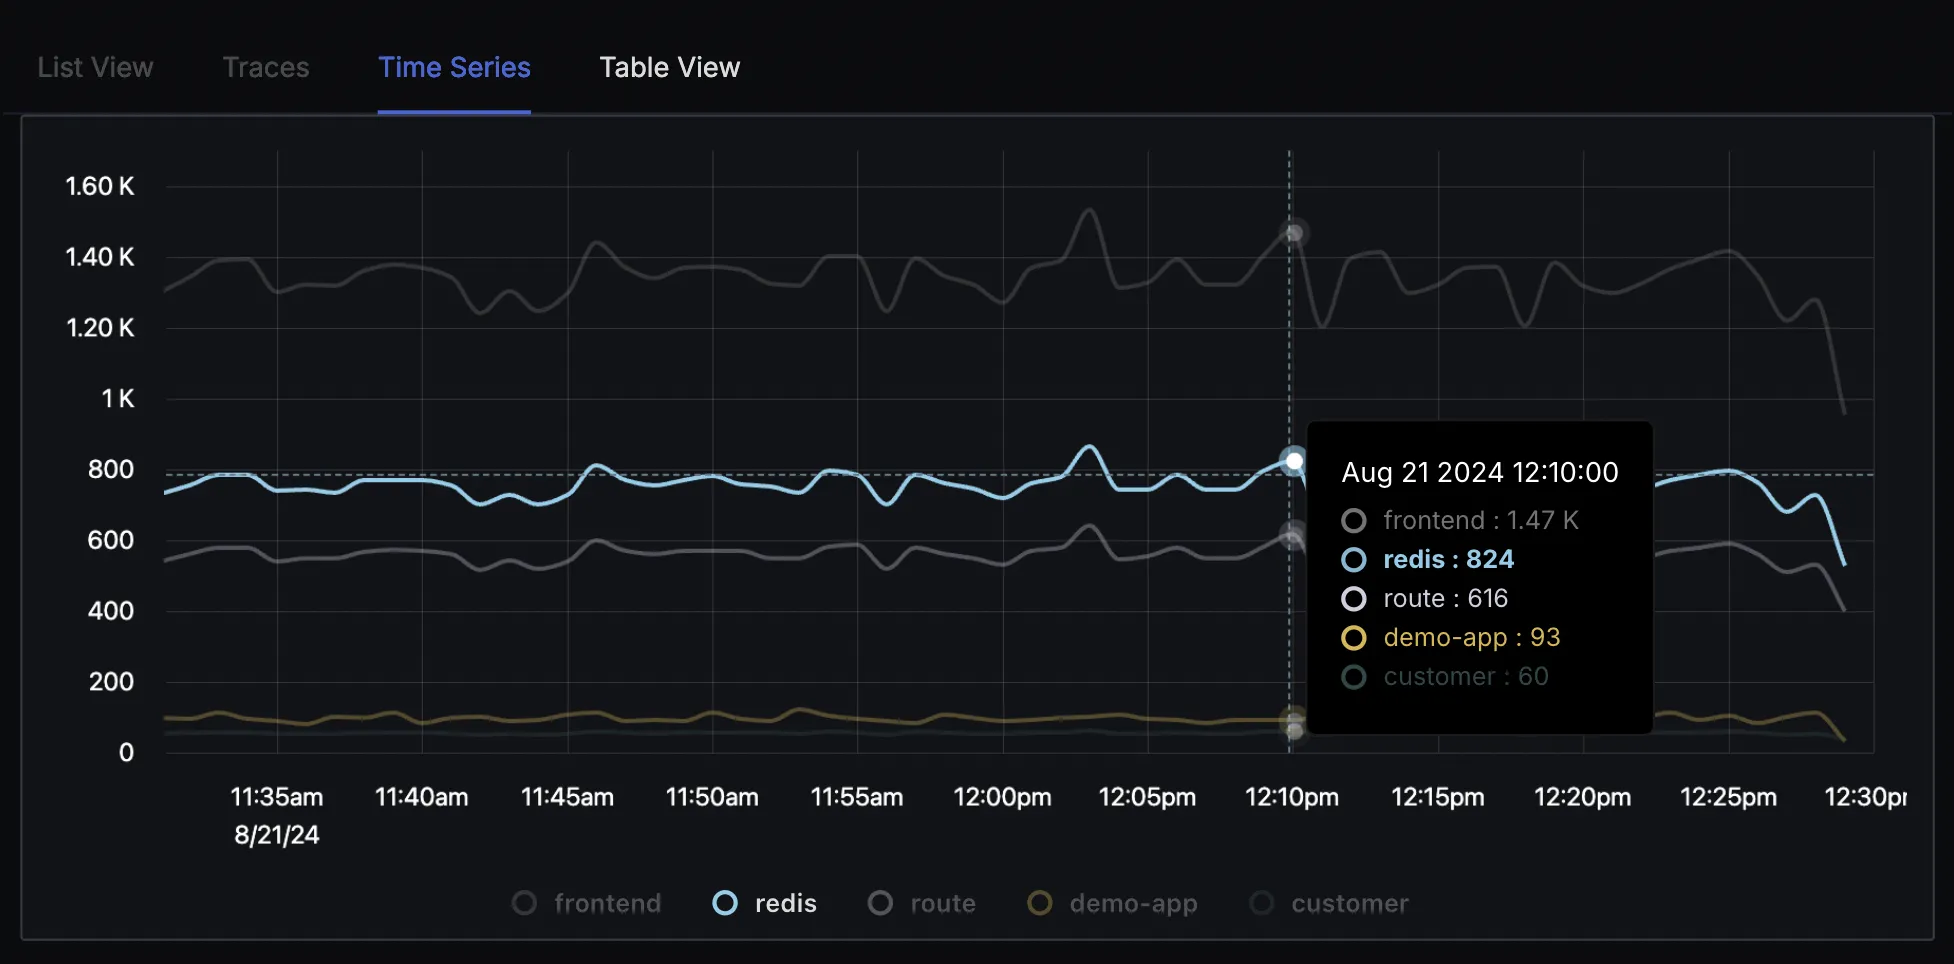
See your trace data in different views based on your use cases, like list view, root spans, time series, and table view.
Saved View
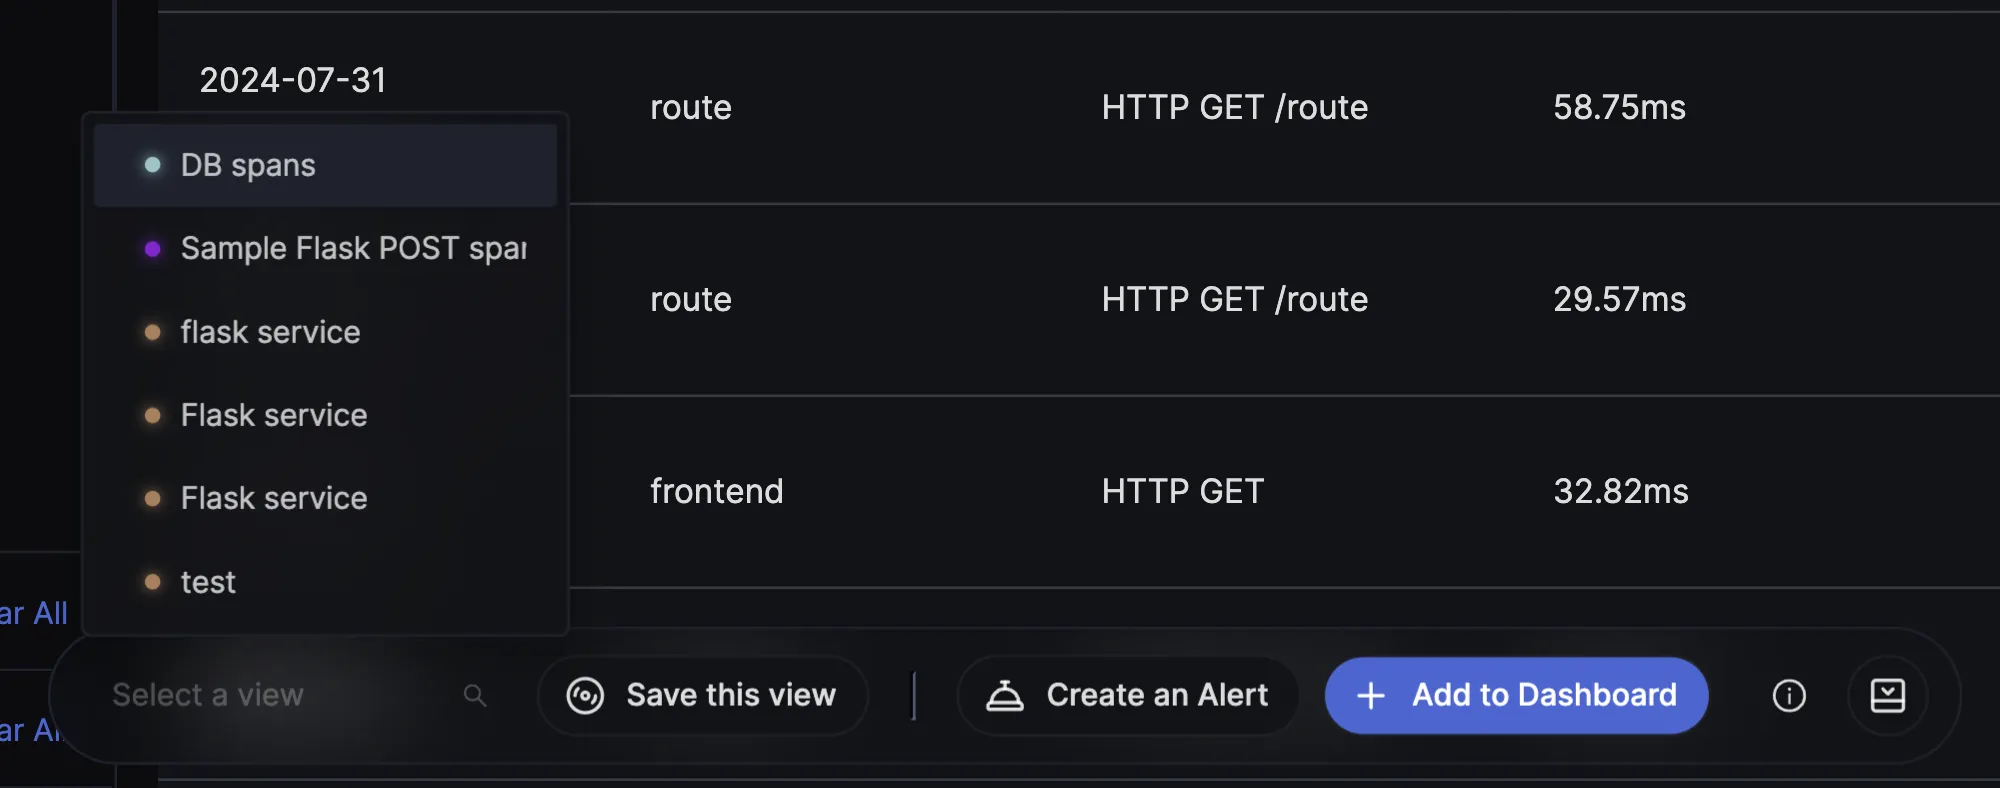
Saved views enable you to access your favorite queries quickly. Create complex queries and save them for future reference.
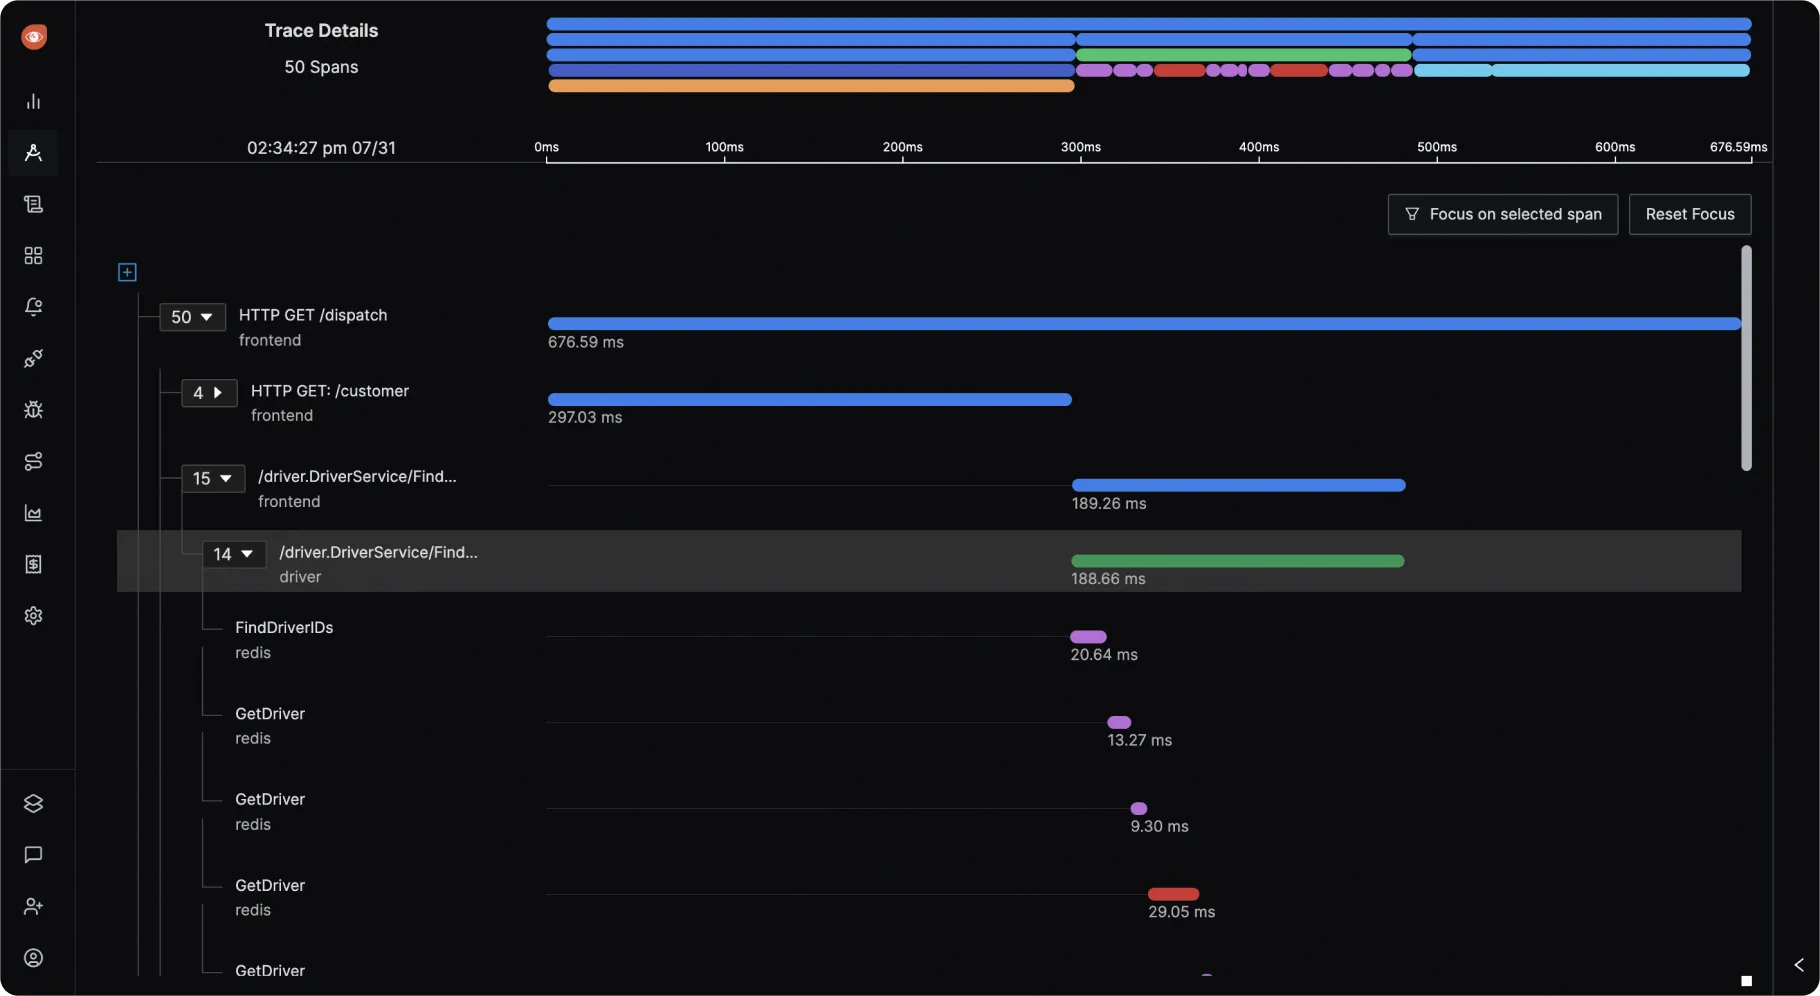
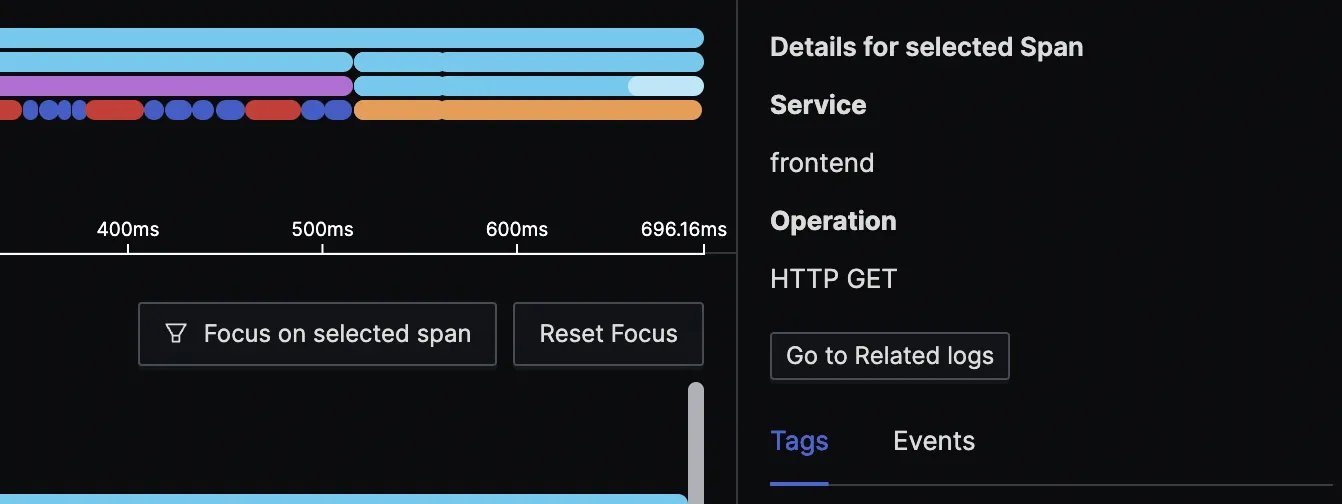
Flamegraphs & Gantt Chart view of Traces
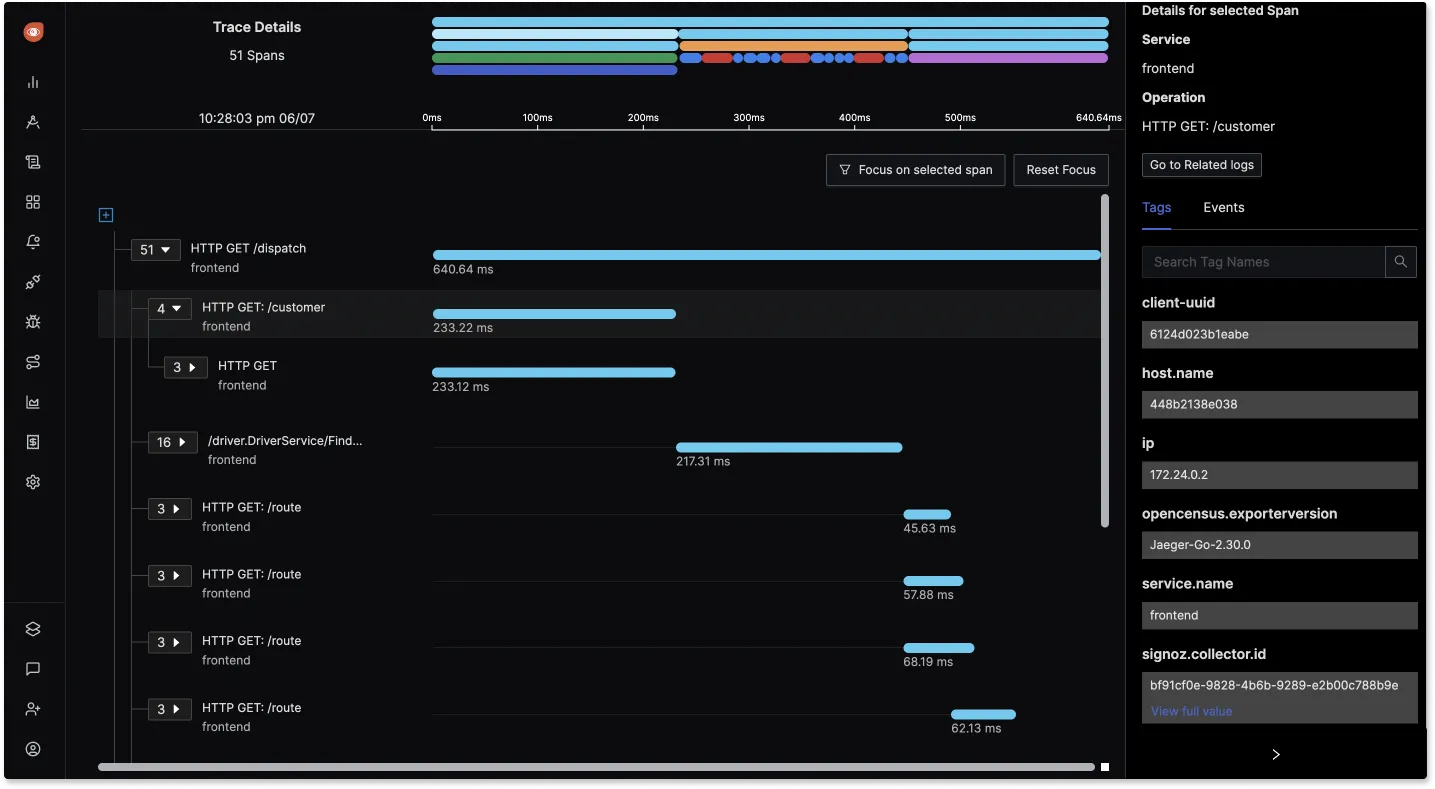
See user requests in a detailed breakdown with the help of Flamegraphs and Gantt Charts. Click on any span to see the entire trace represented beautifully to help you make sense of where it actually occurred in the flow of requests.
Correlation with logs
Correlate your traces with logs to get a much richer context while debugging. Using OpenTelemetry and SigNoz can help you uncover insights faster with correlated signals.
Access to Trace data through API
Accessing trace data through our Trace API allows you to manage and analyze it efficiently. This opens up many opportunities for integration with other tools, programmatic analysis of trace data, and customized data handling.
Use SigNoz
Distributed Tracing for...
Advanced Trace analytics
You can write ClickHouse queries on your trace data. It enables users to write queries for advanced use cases like finding average latency between two spans of interest.
Detecting N+1 Query Problems
Identify N+1 query with the help of traces which can show patterns of single request fanning out multiple database requests
Get logs associated with a particular span
Identify performance bottlenecks quickly with flamegraphs and then debug with associated logs data.
Improve response times
Track and optimize the time taken by each service or database query, ensuring faster response times and better user experiences.
Optimize database queries
Identify slow database queries with quick filters and flamegraphs and then optimize their response times.
Simple
usage-based
pricing
Tired of Datadog’s unpredictable bills or New Relic’s user-based pricing?
We’re here for you.
Pay only for data you send
We don’t have any SKU-based pricing. Get access to all features in the plan selected and only pay for the data you send. Pay only $0.3 per GB of ingested traces.
Add unlimited team members
Observability should be available to every developer at your company. After all, anyone can need debugging. That’s why we don’t charge for user seats, and you can add as many team members as you want.
No Host (container or node) based pricing
For modern cloud-based applications it doesn’t make sense to charge on the basis of number of hosts or containers. You don’t need to worry about auto-scaling during peak hours. Only pay for the amount of data sent no matter the number of hosts.
Developers
Love
SigNoz

10 million+
OSS Downloads

22k+
GitHub Stars

140+
Contributors

4.5k+
Community Members
Get started with
SigNoz Cloud today

