Azure Monitoring Strategy
Introduction
This documentation guides you through an effective full-stack unified monitoring strategy for Azure using SigNoz and Azure Monitoring. By integrating SigNoz with Azure, you can achieve comprehensive observability of your applications and infrastructure, ensuring you have the insights needed to maintain optimal performance and reliability.
Overview of Monitoring Modalities
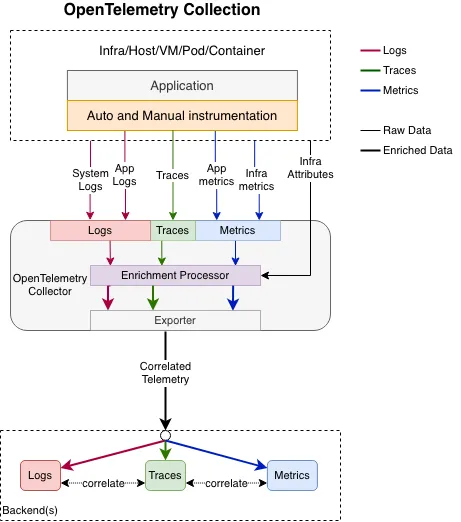
OpenTelemetry Unified Monitoring
Platform-Level Instrumentation
System Logs: Logs generated by the Azure platform itself, providing insights into the underlying infrastructure's state and behavior. These logs can be exported and enriched with additional attributes for better context.
Example:
App Service's HTTP access logs, these are not generated by your application but by the Azure platform.
Collected by:
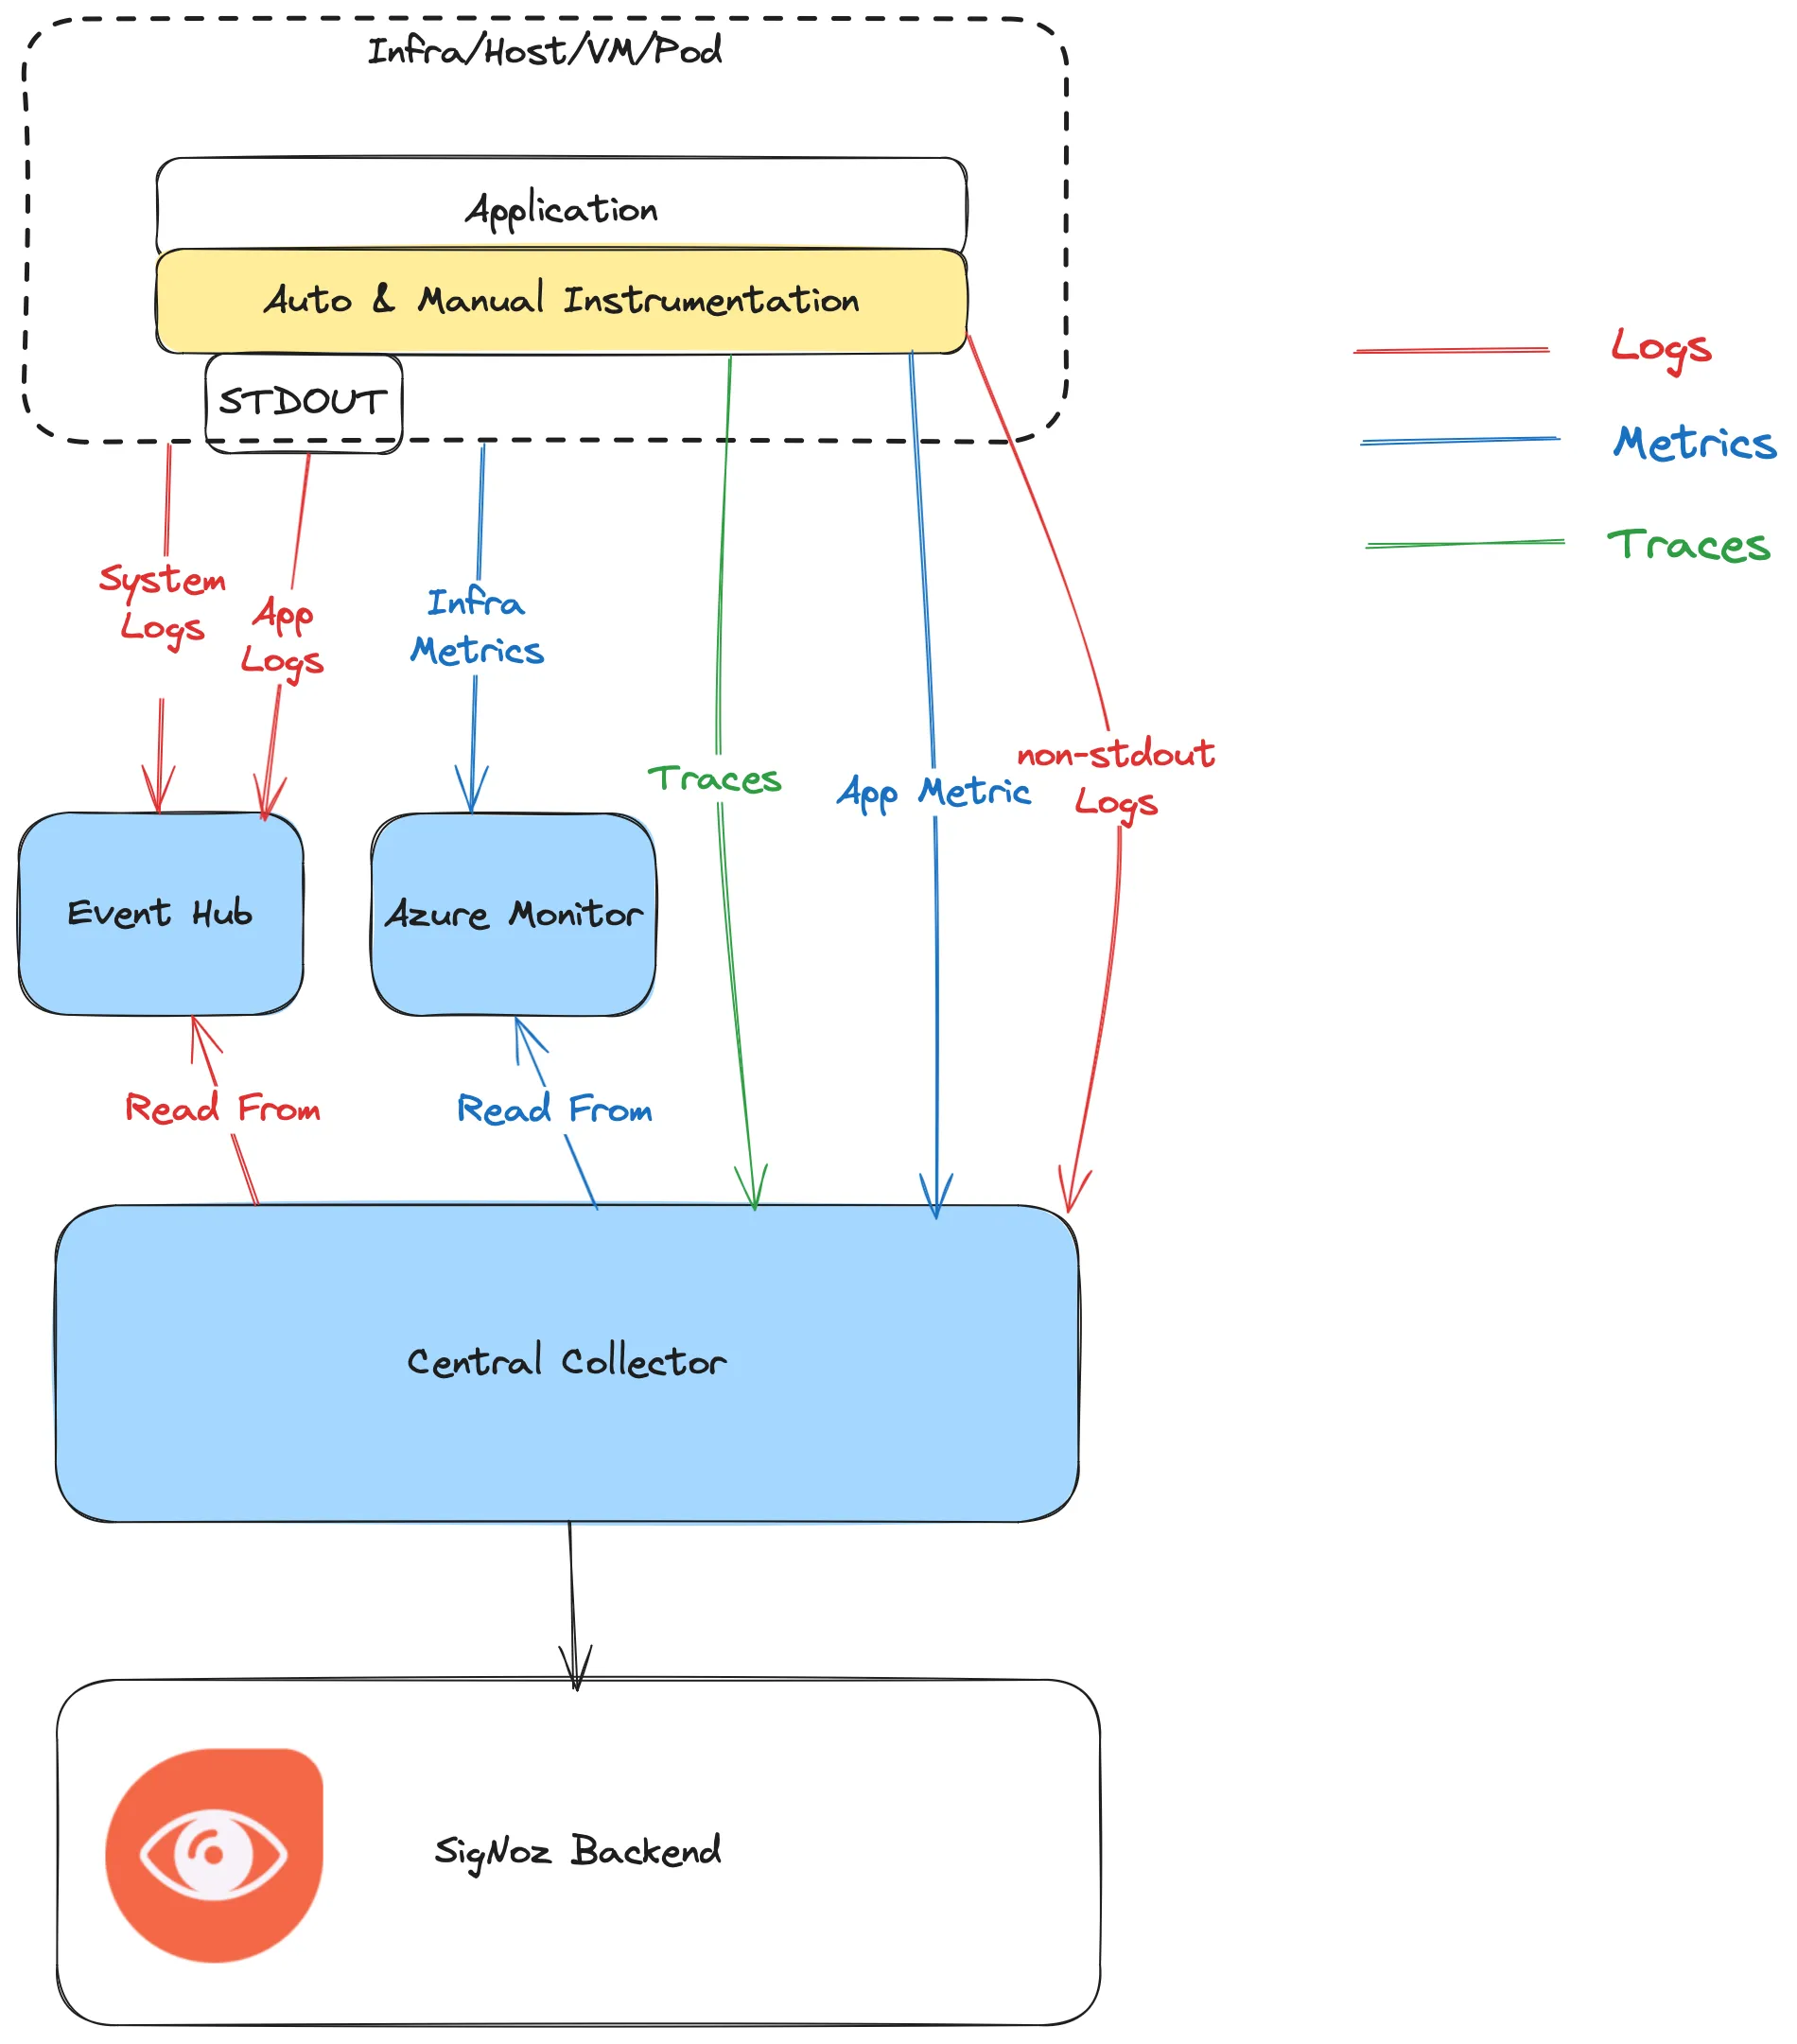
Platform Service streams to Event Hub and SigNoz's Central Collector pushes to SigNoz Cloud
Infra Metrics: Metrics related to the infrastructure, such as CPU usage, memory consumption, and network traffic. These metrics are crucial for understanding the performance and health of your Azure resources.
Example:
App Service's CPU and memory usage metrics.
Collected by:
Platform Service streams to Azure Monitor and SigNoz's Central Collector scrapes and pushes to SigNoz Cloud
Infra Attributes: Additional metadata about your infrastructure, such as resource names, locations, and configurations. These attributes help in correlating and contextualizing logs and metrics.
Example:
App Service's resource name and location attributes.
Collected by:
Central Collector collects and export these attributes..
Application-Level Instrumentation
App Logs: These logs are generated by your application and provide insights into application behavior, errors, and events. In an Azure context, these logs can be streamed to stdout and collected by Azure App Service, Function App, and Container App.
Example:
System.Diagnostics.TraceSourcein .NET,logger.info()in Java,console.log()in JavaScript.Collected by:
Platform Service streams stdout to Event Hub (specific to the service) and SigNoz's Central Collector pushes to SigNoz Cloud.
Alternatively, for unmanaged services or non-stdout logging, you can use Otel SDK to send logs to Central Collector directly.
App Metrics: These are metrics that your application emits, such as request queue length, request counts, error rates, and response times. These metrics can be collected using OpenTelemetry instrumentation SDKs.
Example:
Spring Actuator Metrics like
jvm.gc.pause.seconds_count,http.server.requests.total,process.cpu.usageCollected by:
OpenTelemetry SDKs integrated with your application send metrics to Central Collector
Traces: Traces provide a detailed view of the execution flow within your application. They help you understand the path and timing of requests as they traverse through various services and components.
Collected by:
OpenTelemetry SDKs integrated with your application send traces to Central Collector
Implementation Guide
Azure Unified Monitoring Strategy
Platform-Level Instrumentation
Azure provides the capability to export system logs, infrastructure metrics, and attributes. These can be streamed and collected by Azure services such as App Service, Function App, and Container App.
Please refer to the Azure Monitoring documentation for detailed information on how to export logs and metrics to SigNoz for your particular service.
Application-Level Instrumentation
For application metrics and traces, use the OpenTelemetry instrumentation SDK. For example, in a Node.js application, you can install the necessary packages using npm:
npm install @opentelemetry/api
npm install @opentelemetry/auto-instrumentations-node
Please refer to our Blog or SigNoz Tutorials for detailed information on how to instrument your application like Spring, FastAPI, NextJS, Langchain, Node.js, Flask, Django, etc. with OpenTelemetry.
Next Steps
Please complete the bootstrapping process to get started with monitoring your application running on Azure.
Frequently Asked Questions (FAQ)
How do I monitor traces in Azure?
To monitor traces in Azure, you need to instrument your application using the OpenTelemetry SDK. Once instrumented, the traces can be collected and exported to a SigNoz Cloud for analysis.
- Instrument Your Application: Use the OpenTelemetry SDK to add tracing to your application code.
- Configure Exporter: Set up the OpenTelemetry Collector to export traces to your Central Collector in SigNoz Cloud.
By following these steps, you can achieve comprehensive trace monitoring in Azure, helping you to identify and resolve performance issues effectively.
