External API Monitoring
Overview
The External API Monitoring provides visibility into all external API calls made by your internal services. this feature automatically tracks and visualizes these calls to give you a complete view of your external API ecosystem.
Unlike traditional monitoring that shows only aggregate metrics, SigNoz correlates external API data (domains, endpoints, errors, latency) with your internal services and traces, helping you identify the root cause of issues faster.
When to Use & Key Benefits
External API Monitoring can deliver specific benefits in these common scenarios:
- During incident response: Quickly identify if external dependencies are causing issues through unified visibility of all API calls and instant identification of error-prone domains and endpoints.
- When investigating performance bottlenecks: Determine if slow response times are due to your code or external APIs using root cause analysis capabilities that let you navigate directly from errors to detailed traces.
- For proactive monitoring: Keep an eye on critical services with comprehensive performance insights that track latency trends and error patterns across all external dependencies.
How It Works
External API Monitoring leverages OpenTelemetry semantic conventions to automatically detect and categorize external API calls from your instrumented services. The feature works by using the span attributes mentioned below:
| Attribute | Description | Example |
|---|---|---|
net.peer.name | Domain or host of the external service | api.stripe.com |
http.url | Complete URL of the request | https://api.stripe.com/v1/charges |
http.target | Path portion of the URL | /v1/charges |
These attributes are used to automatically derive API calls, identify external domains, extract important metadata, and correlate them with your internal services.
Feature Walkthrough
Domain Overview
The API Monitoring landing page displays all domains (internal & external) being called by your services.
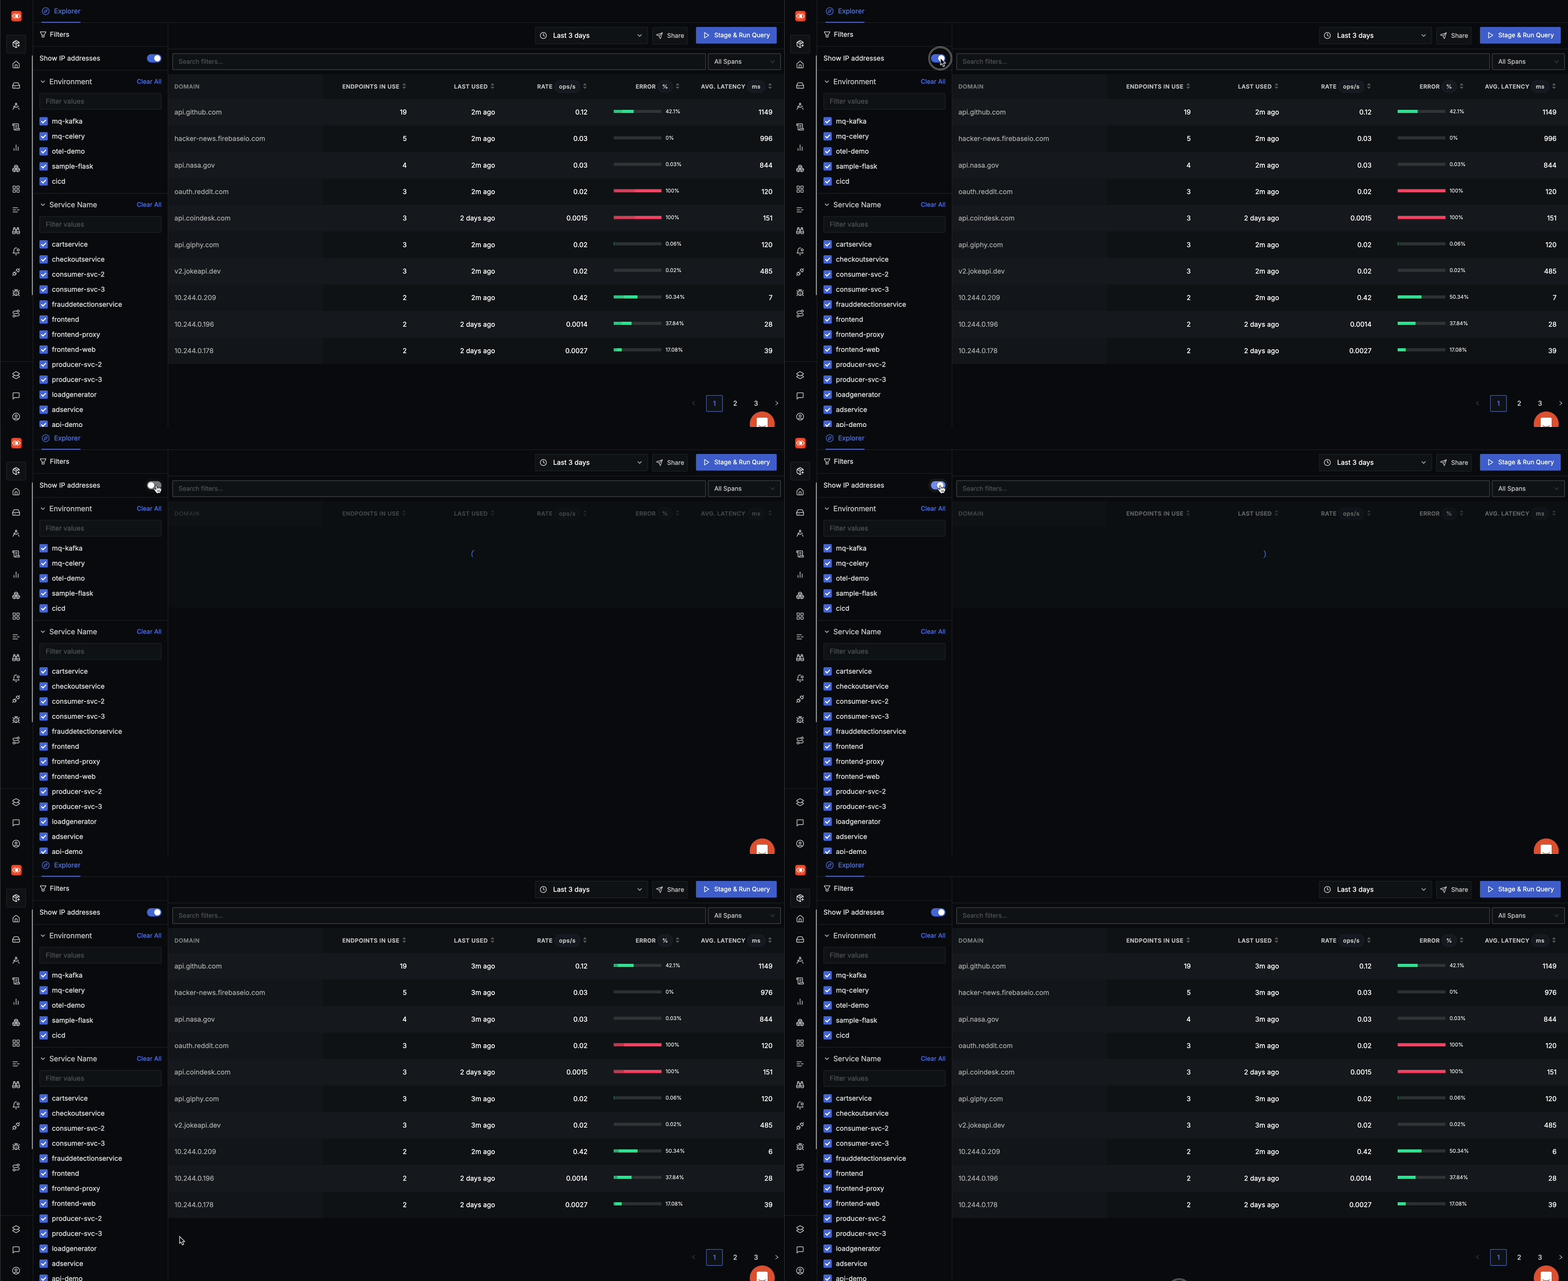
The main table shows domains with detailed metrics including:
- DOMAIN: Name of the external API domain
- ENDPOINTS IN USE: Number of distinct endpoints called on this domain
- LAST USED: When the domain was last accessed (e.g., "2h ago", "4 days ago")
- RATE ops/s: Operations per second, showing traffic volume
- ERROR %: Percentage of calls resulting in errors, with visual indicator
- AVG. LATENCY ms: Average response time in milliseconds
You can:
- Sort by any column by clicking its header
- Toggle "Show IP addresses" to hide internal IP addresses
- Navigate through multiple pages of results using pagination controls
- Click on any domain to view its detailed endpoints and statistics
- Use filters in the left panel to narrow down by Environment, Service Name, or RPC Method
- Use the search bar at the top to find specific domains
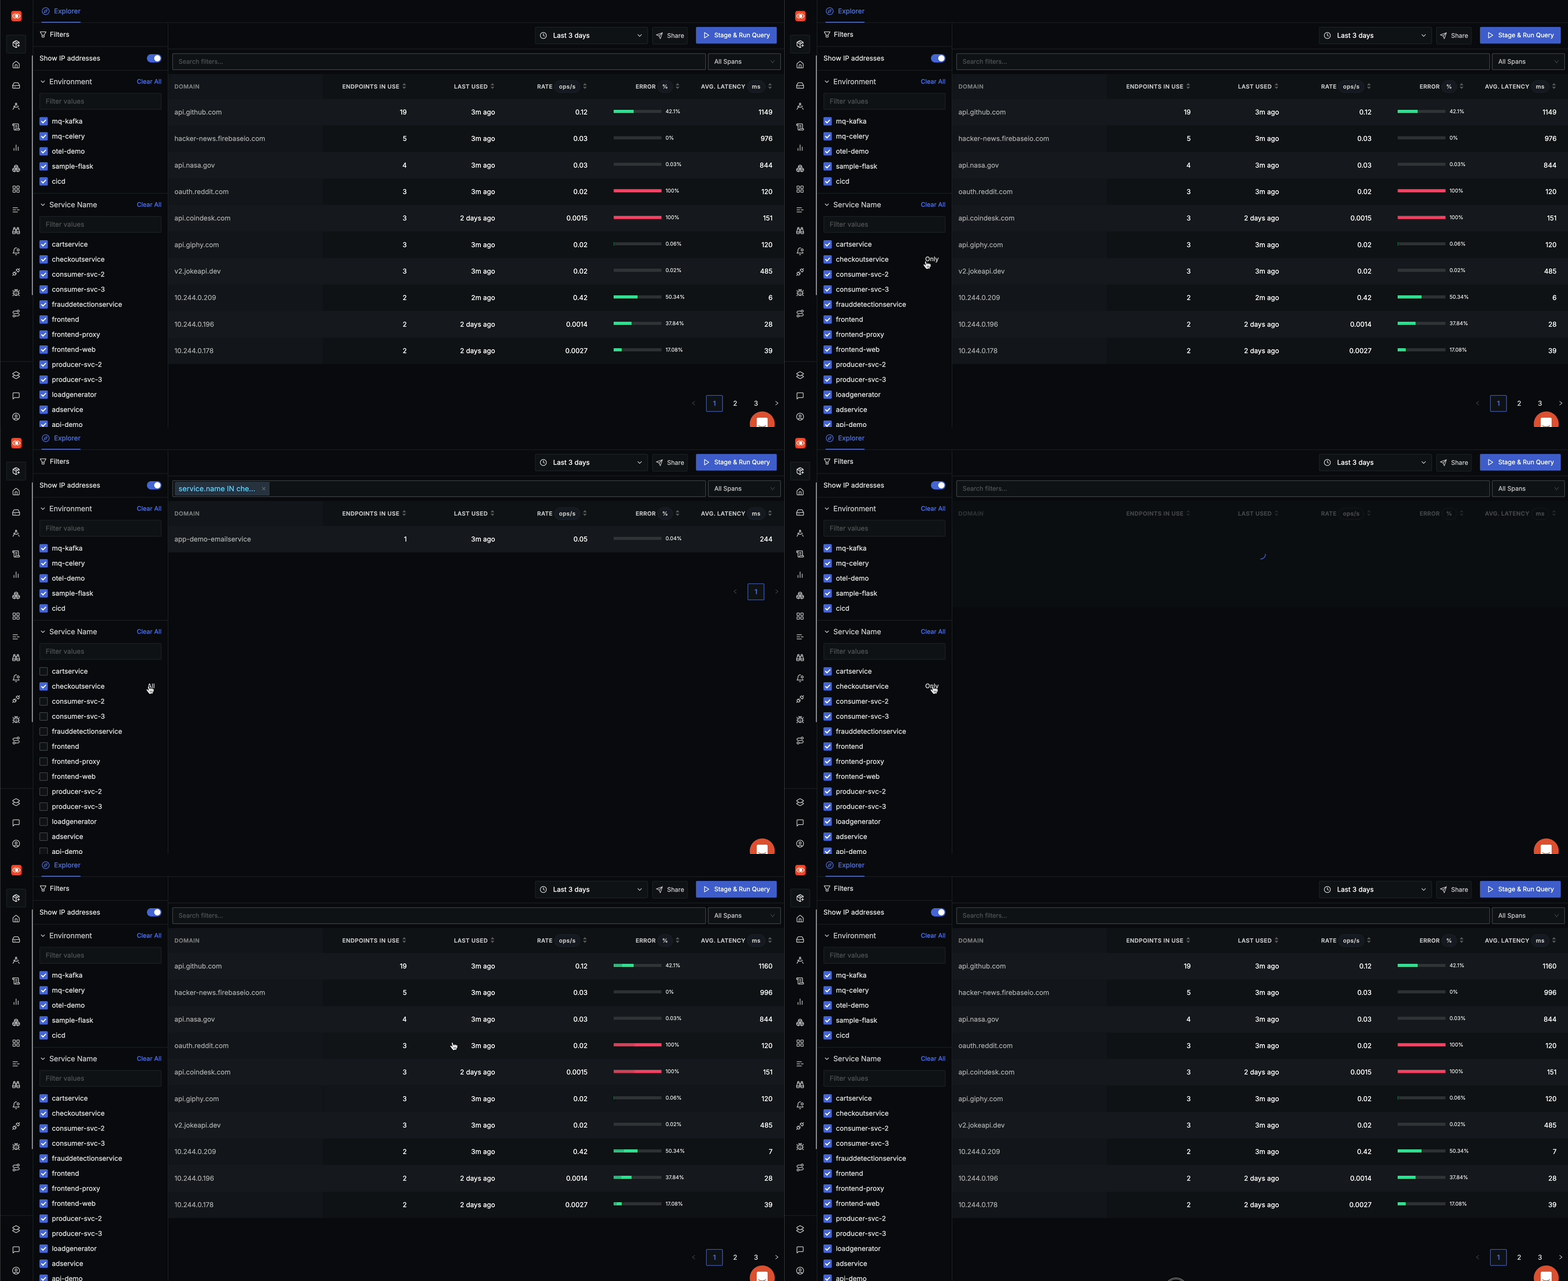
Exploring Endpoints
When you select a domain, you can navigate through three main tabs:
- All Endpoints: Lists all endpoints being called on the selected domain
- Endpoint(s) Stats: Shows aggregated statistics for the domain or selected endpoint
- Top 10 Errors: Displays the most frequent errors occurring for this domain
All Endpoints Tab
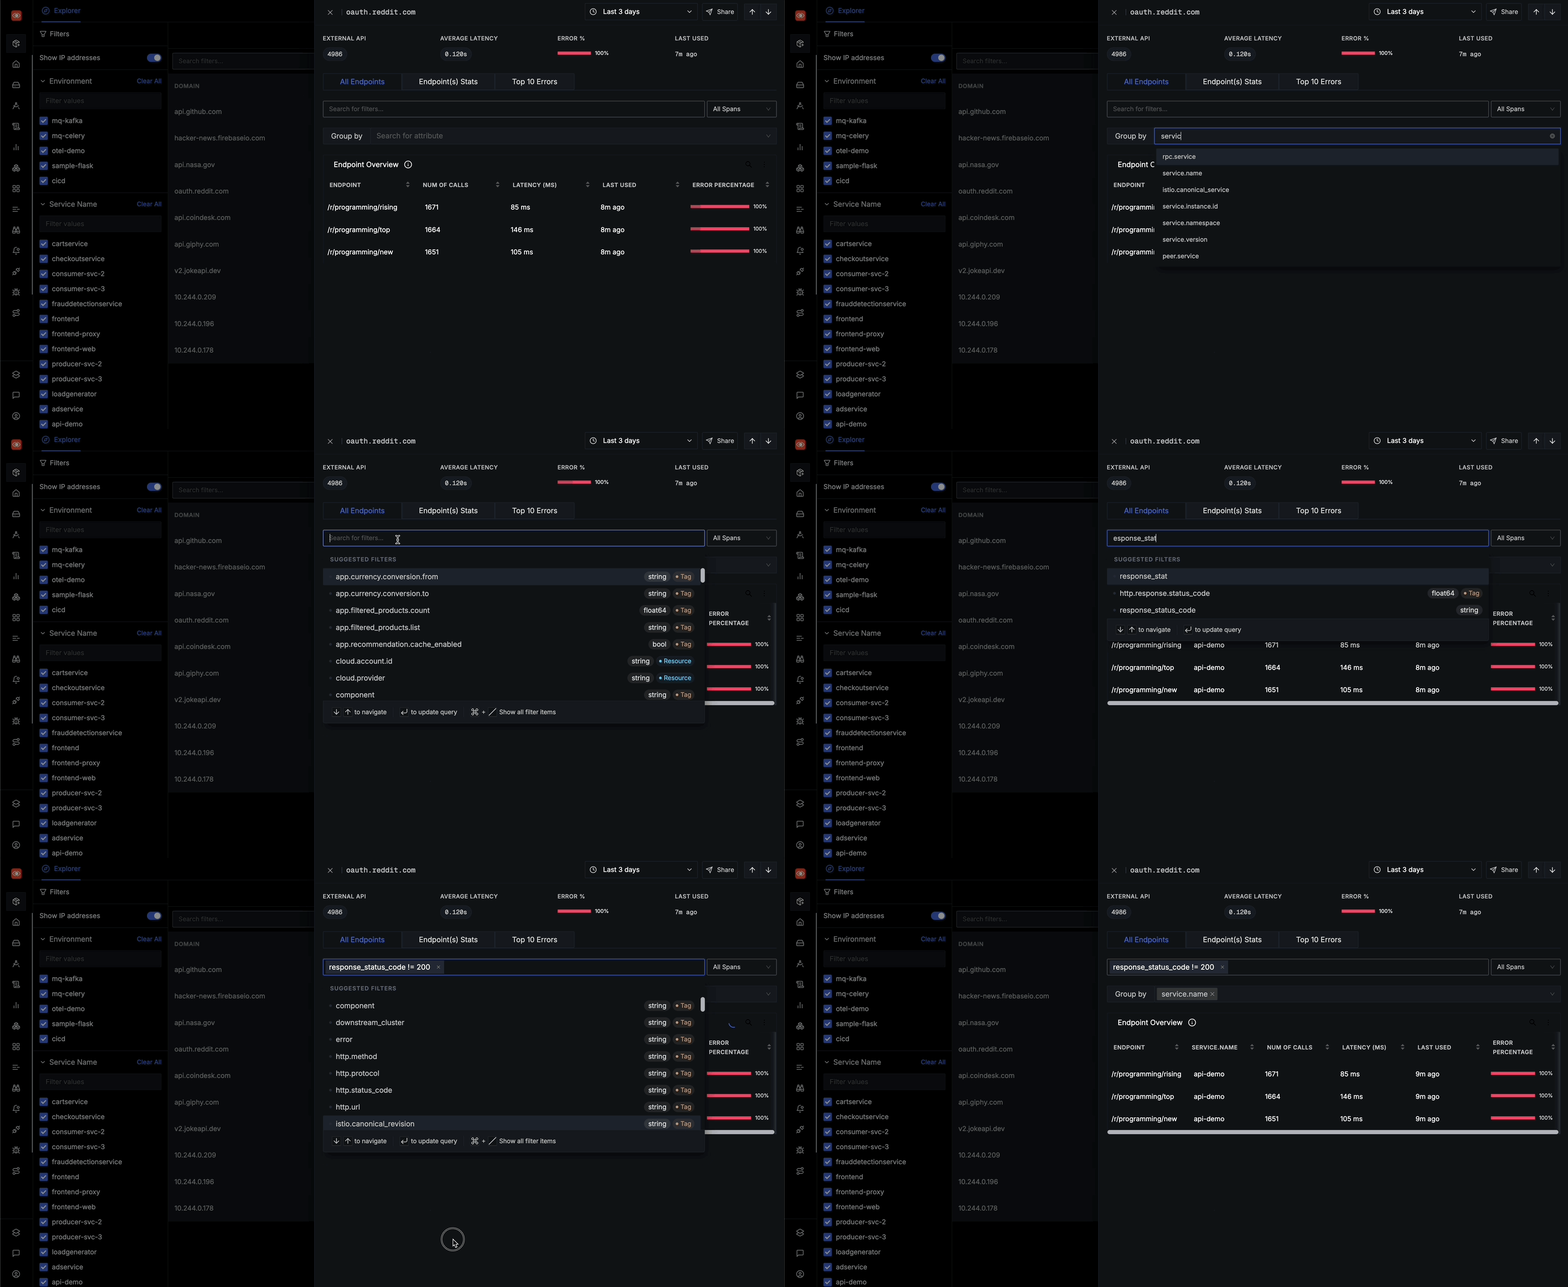
From the All Endpoints, you can:
See a detailed endpoint overview with columns for:
- ENDPOINT (path)
- NUM OF CALLS
- LATENCY (MS)
- LAST USED
- ERROR PERCENTAGE
Filter endpoints using the search bar
Group results by different attributes using the "Group by" dropdown
Click on any endpoint to view its detailed statistics
Endpoint(s) Stats Tab
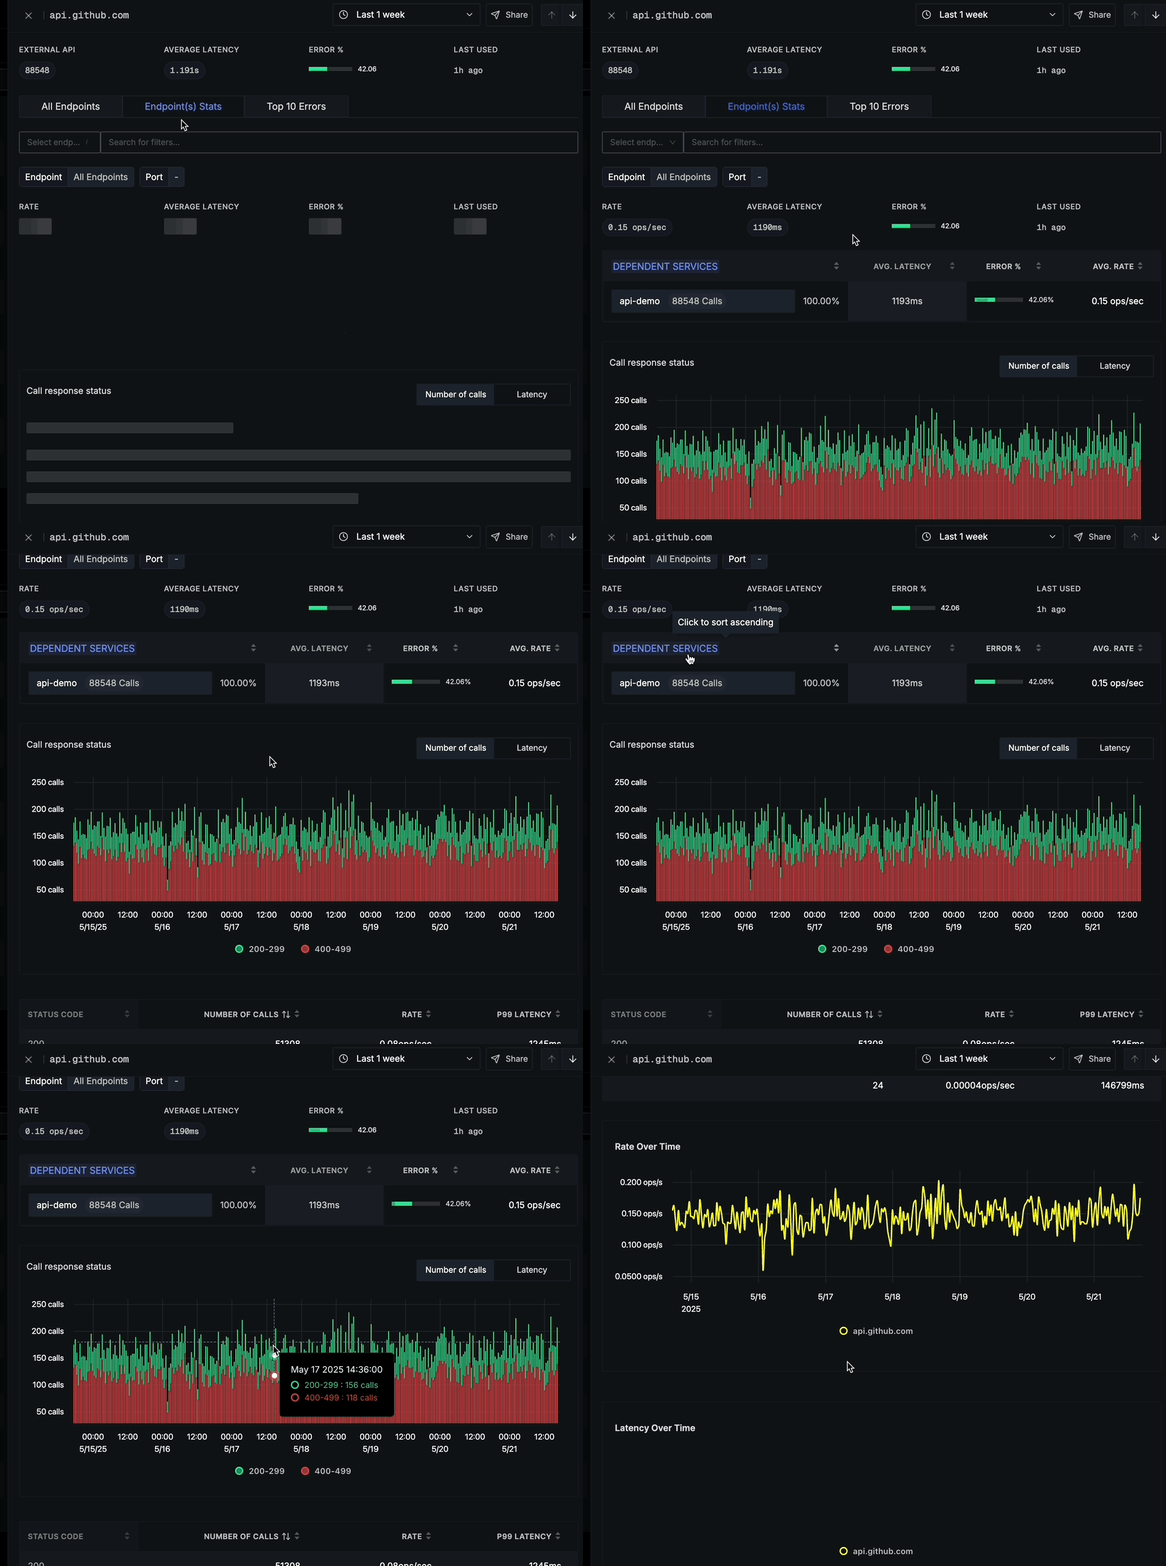
The Endpoint(s) Stats tab offers two different views of your API data:
- Domain View: When you directly click on the Endpoint(s) Stats tab, you'll see aggregated statistics for all endpoints on that domain combined
- Endpoint View: When you click on a specific endpoint from the All Endpoints tab, the Endpoint(s) Stats tab opens with a filter applied for that particular endpoint
The only difference is the scope of data being visualized: the domain view shows aggregated data across all endpoints, while the endpoint view shows detailed data for just the selected endpoint.
In both views, you'll see:
Summary metrics for the selected domain or endpoint:
- RATE (ops/sec)
- AVERAGE LATENCY
- ERROR %
- LAST USED
A DEPENDENT SERVICES section showing:
- Which of your services are calling this domain/endpoint
- Total call counts
- Average latency for each service
- Error percentage per service
- Average request rate
Clicking on any service name will navigate you to that service's dashboard for further analysis, allowing you to easily investigate how the service is interacting with the external API.
Data Visualizations
The same set of powerful visualizations is available in both the domain view and endpoint view of the Endpoint(s) Stats tab.
Call Response Status
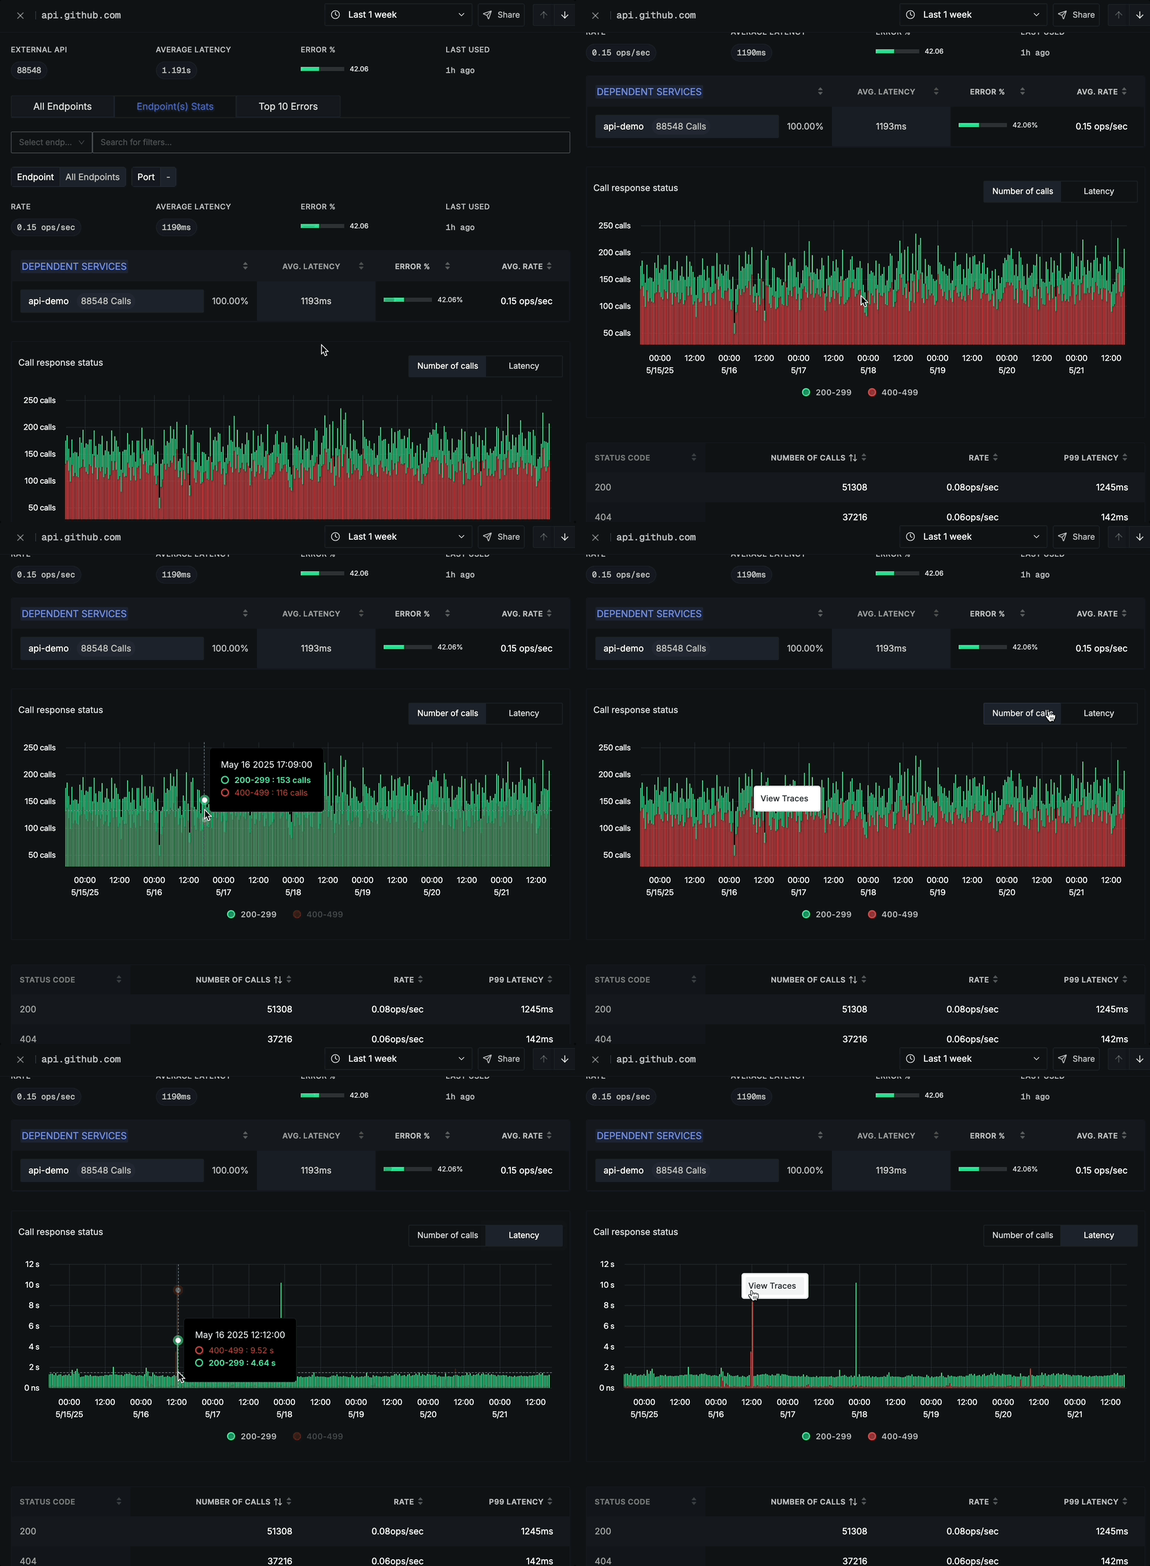
The Call response status chart offers two different tabs:
Number of calls tab (default):
- Shows HTTP status code distribution over time
- Color-coded status codes (2xx, 4xx, 5xx)
- Number of calls on the y-axis
- Time period on the x-axis
- Legend showing which colors represent which status code ranges
Latency tab:
- Shows response time distribution over time
- Same color-coding for status codes
- Latency measurements (in seconds) on the y-axis
- Time period on the x-axis
- Helps identify latency spikes by status code
In both tabs, you can click on any time point to view the corresponding traces for detailed analysis.
Status Code Breakdown
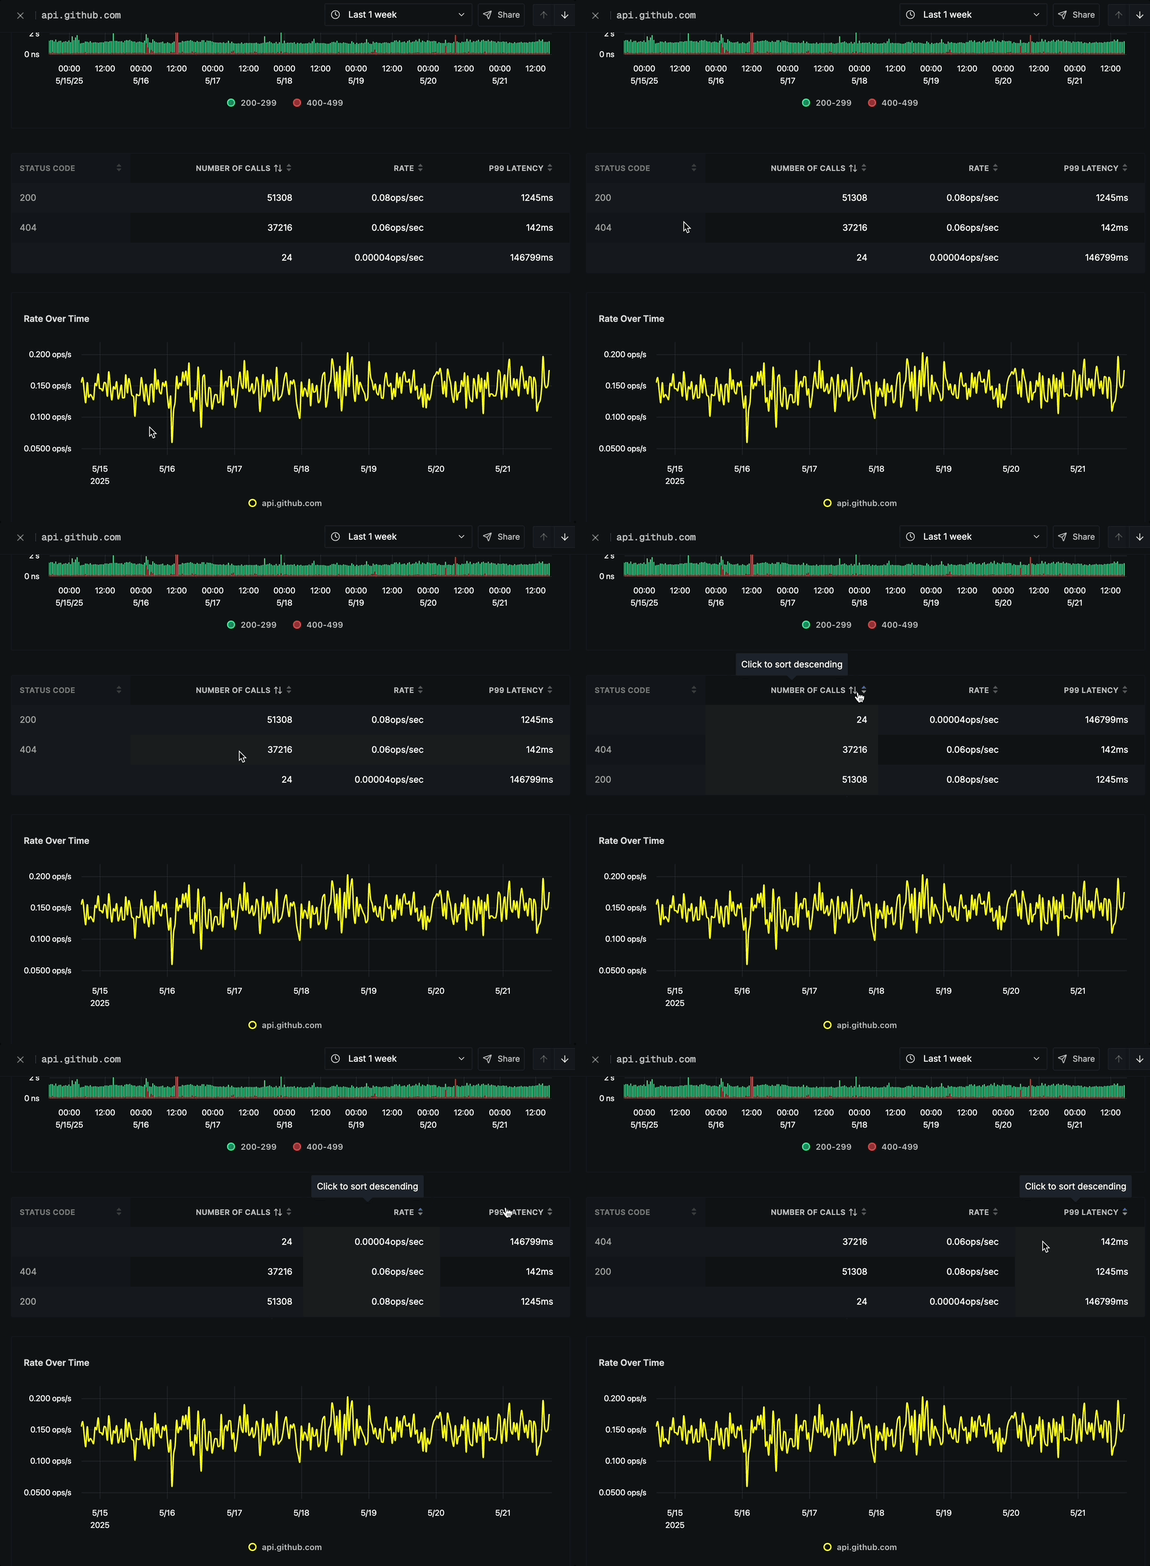
Below the call response status chart is a detailed breakdown table showing:
- STATUS CODE (e.g., 200, 404)
- NUMBER OF CALLS per status code
- RATE (ops/sec) for each status code
- P99 LATENCY for each status code
Rate Over Time
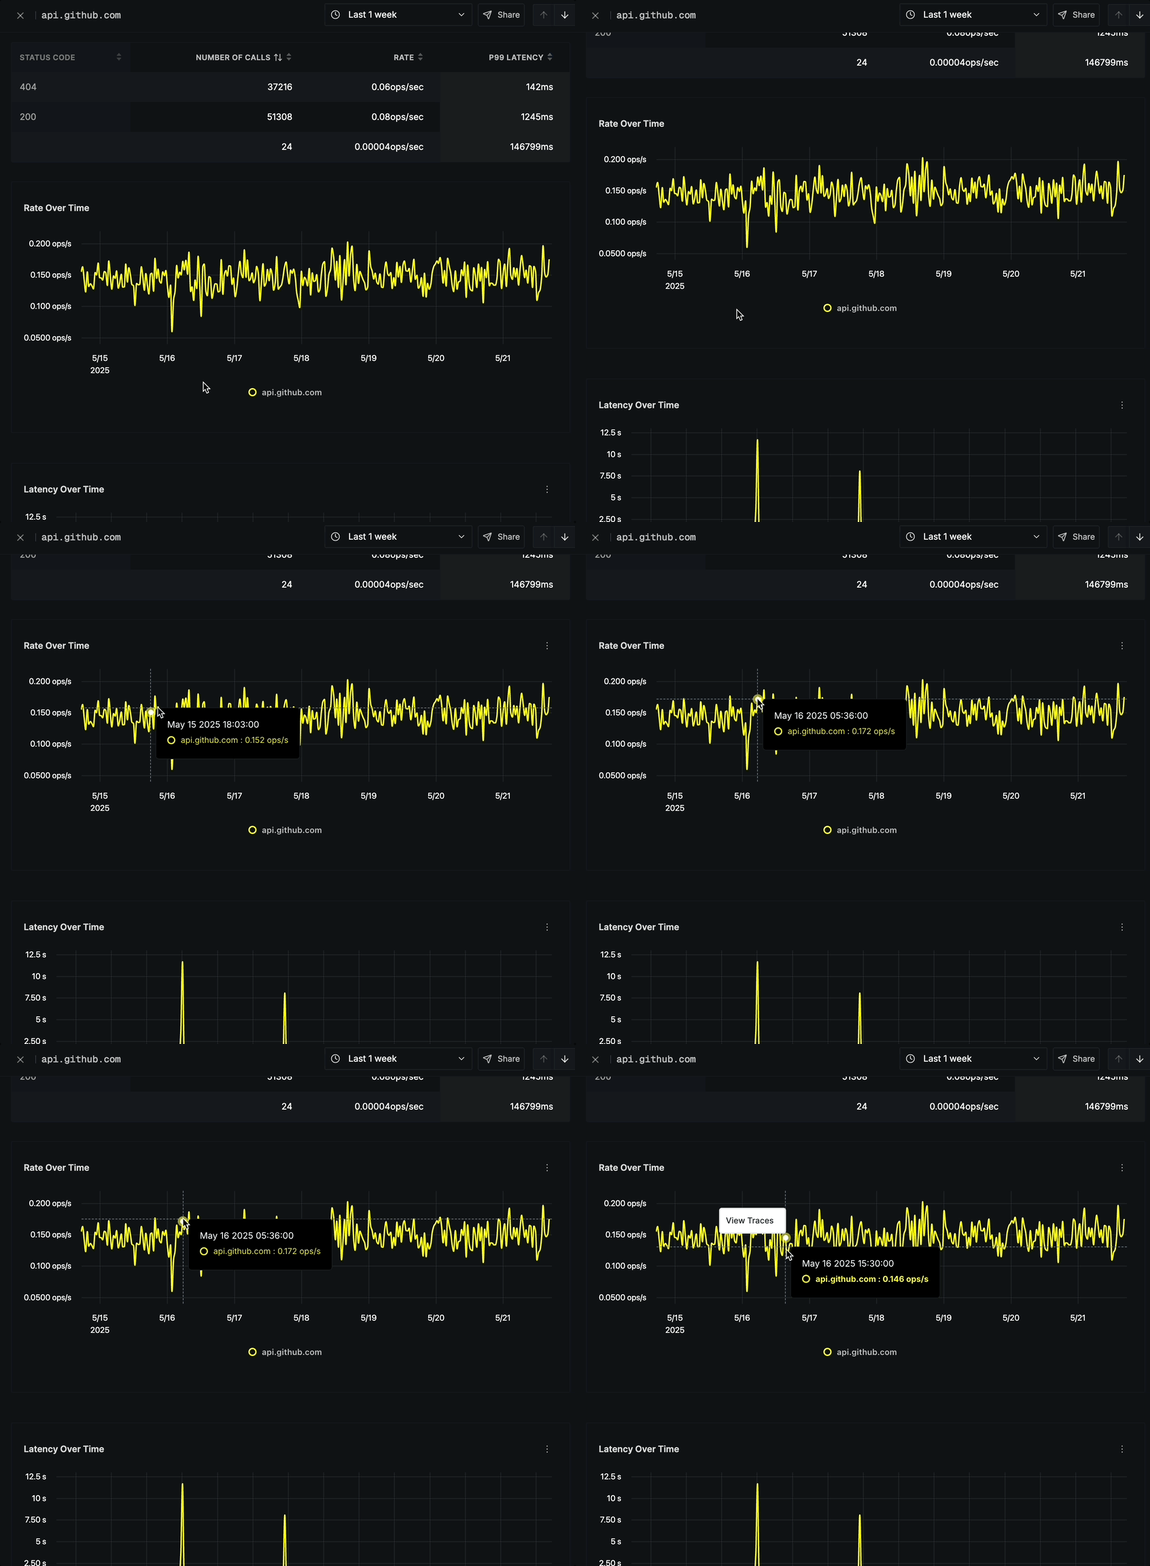
The Rate Over Time chart displays:
- Operations per second (ops/s) over time
- Yellow line graph showing request rate fluctuations
- Time period on the x-axis
- Rate scale on the y-axis
- Option to click on any point to view corresponding traces
Latency Over Time
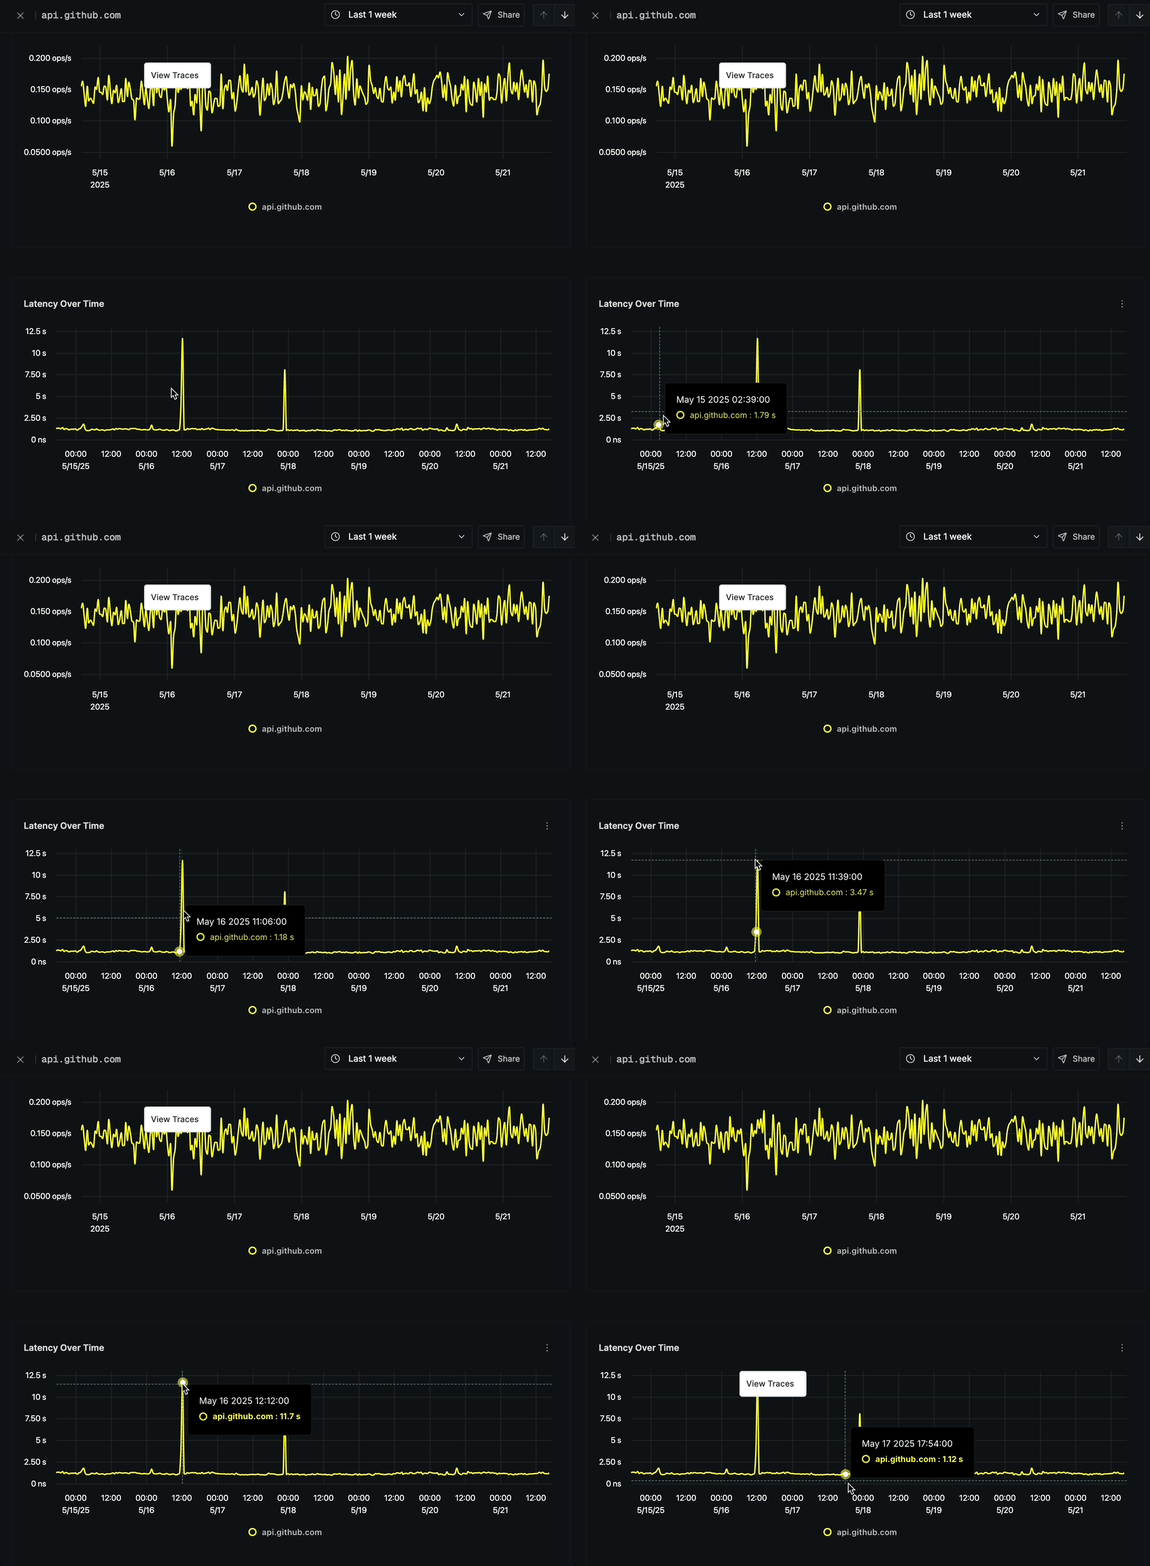
The Latency Over Time chart shows:
- P99 Latency measurements over time
- Ability to track performance degradations or improvements
- Options to analyze latency spikes
- Option to click on any point to view corresponding traces
Top 10 Errors
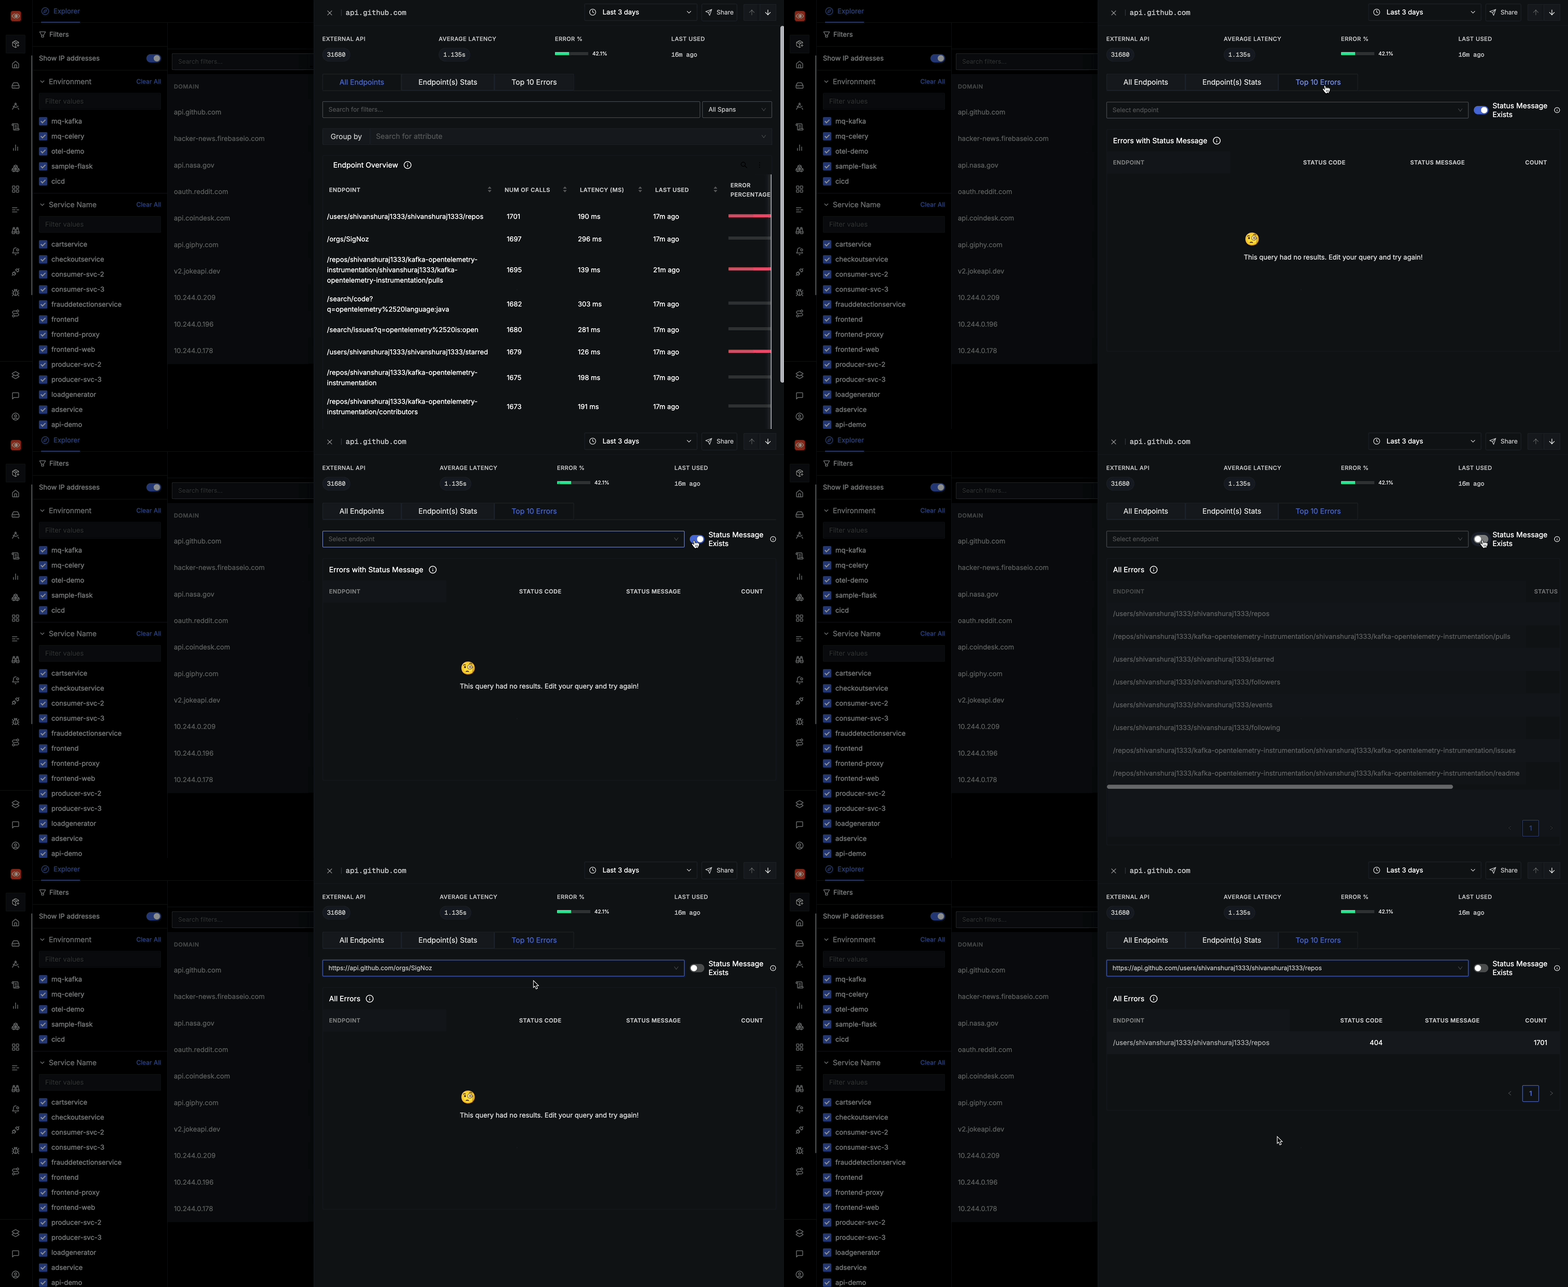
The Top 10 Errors tab provides:
- A comprehensive list of errors occurring for the selected domain
- Toggle option for "Status Message Exists" to filter errors with status message
- For each error, you can see:
- ENDPOINT path where the error occurred
- STATUS CODE of the error
- STATUS MESSAGE (when available)
- Clicking on any error row will take you to the corresponding trace for detailed analysis
This tab will help you quickly identify the most problematic endpoints and understand common error patterns across your external API calls.
Related Resources
Last updated: May 12, 2025
