Cloud Monitoring Metrics
Overview
Google Cloud Monitoring provides visibility into the performance, uptime, and overall health of cloud-powered applications. It collects metrics, events, and metadata from Google Cloud, hosted uptime probes, and application instrumentation.
This document provides a detailed walkthrough on how to send Google Cloud Monitoring metrics to SigNoz.
Prerequisites
- Google Cloud account with administrative privilege or Monitoring Admin and Compute Engine Admin privilege
- Cloud Run Admin and Artifact Registry Admin in case you want to setup Cloud Run service to create an uptime check
- Access to a project in GCP
Setup
Create Uptime Check for Cloud Run service
In case you want to create a Cloud Run service, follow the Cloud Run Service Setup document for detailed steps.
To setup uptime check on the Cloud Run service:
Step 1: On the GCP console, search for "Uptime checks", and naviagte to Uptime checks under the Monitoring service from the dropdown.
Step 2: On the Uptime checks page, click on Create uptime check button at the top.
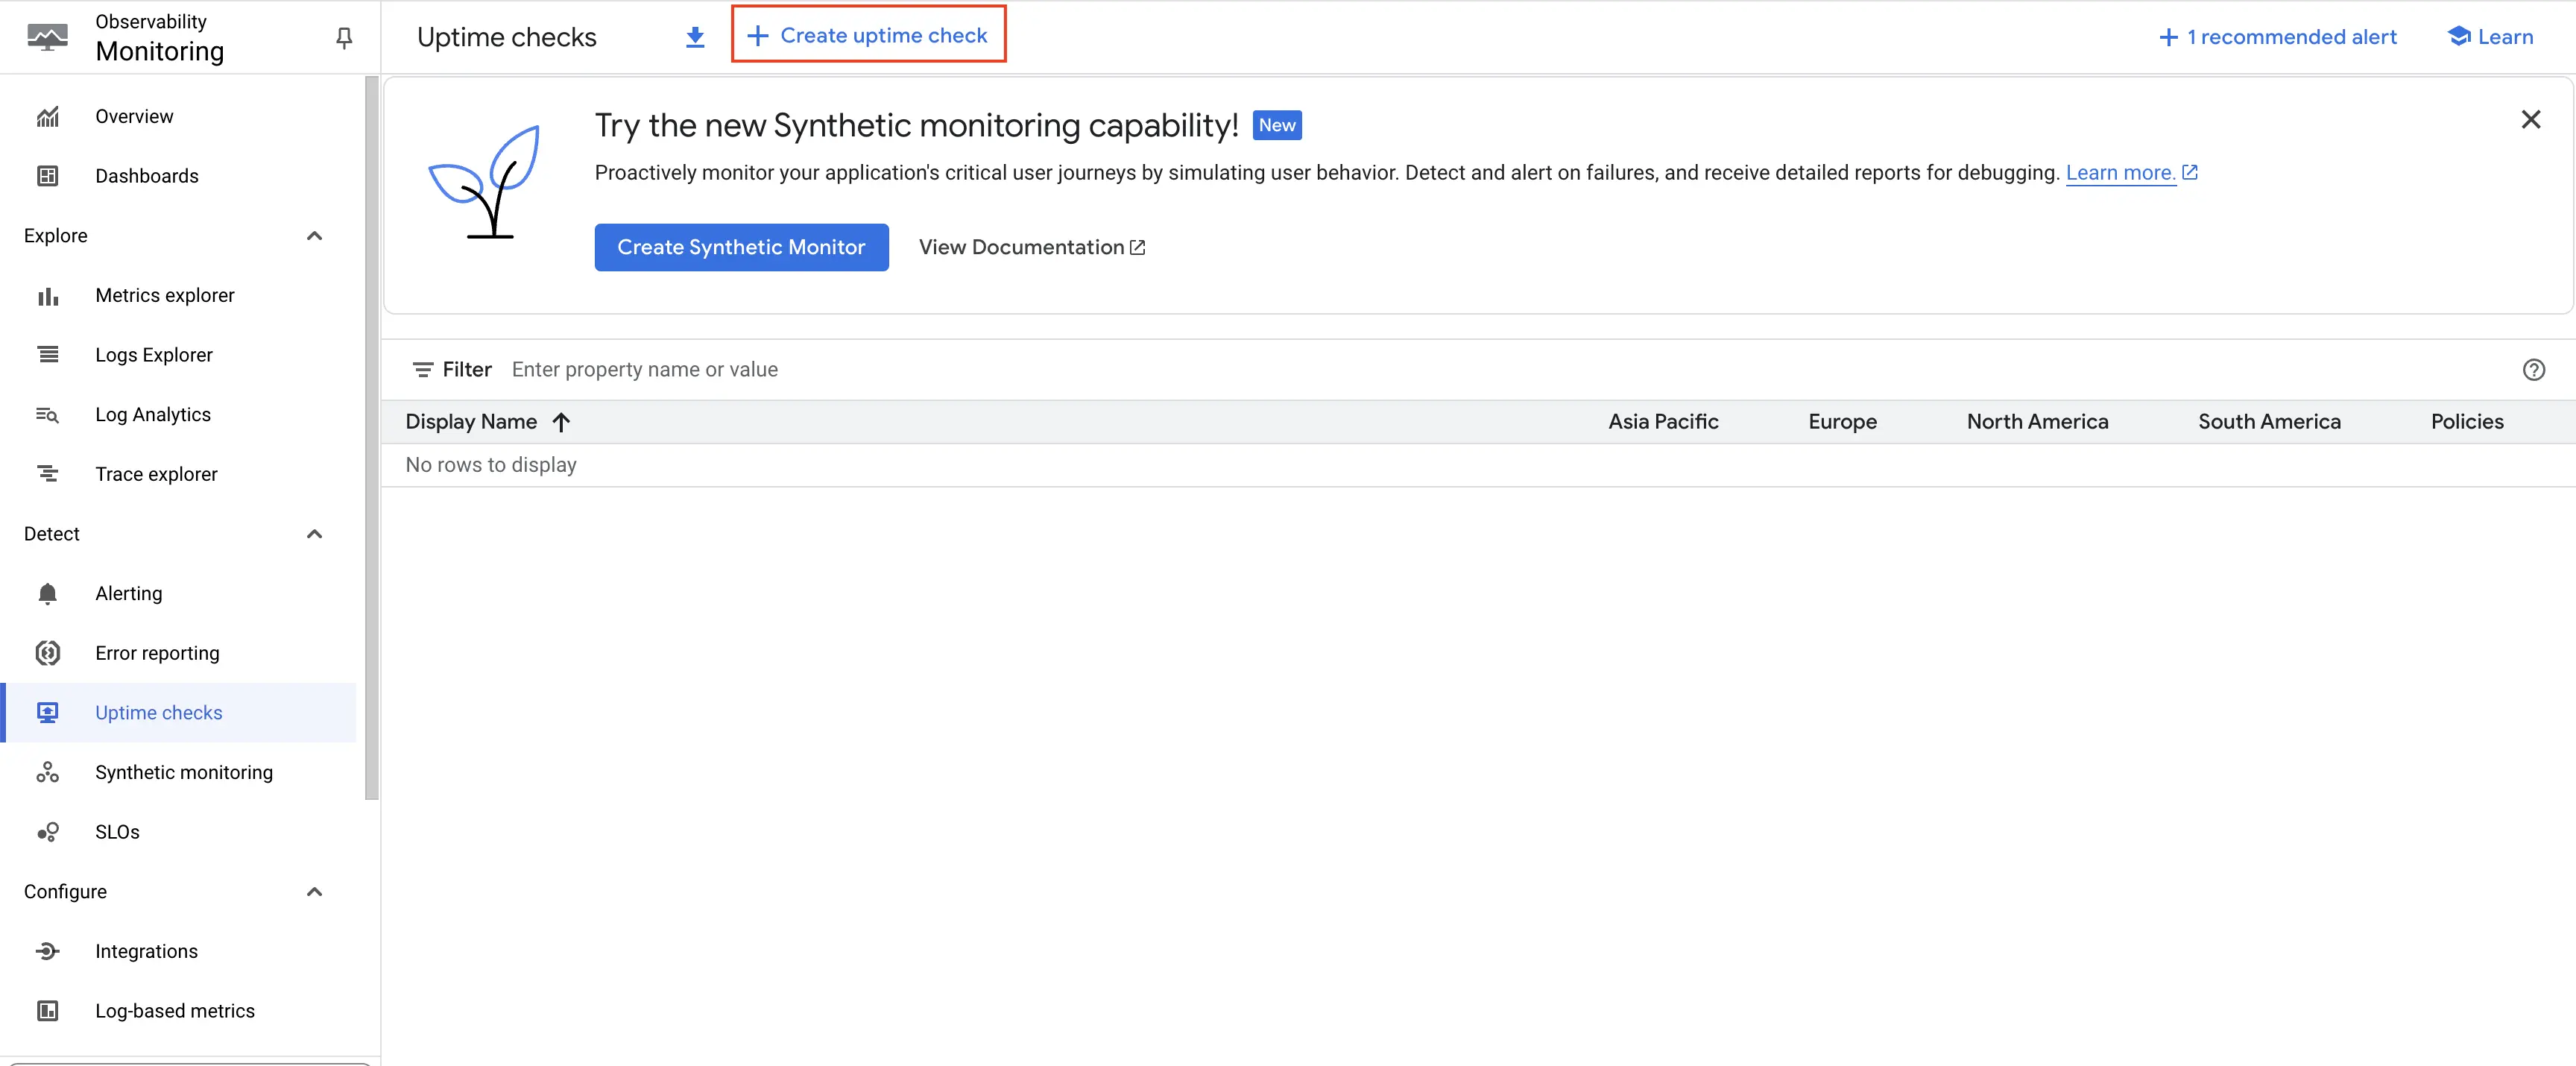
Click on Create uptime check button
Step 3: Select the Protocol as HTTPS, Resource type as Cloud Run Service. From the Cloud Run Service dropdown that appears, choose the appropriate service. In the Path provide /. Frequency can be adjusted as per your requirement. In this case, we will go with the default 1 minute. Click on Continue.
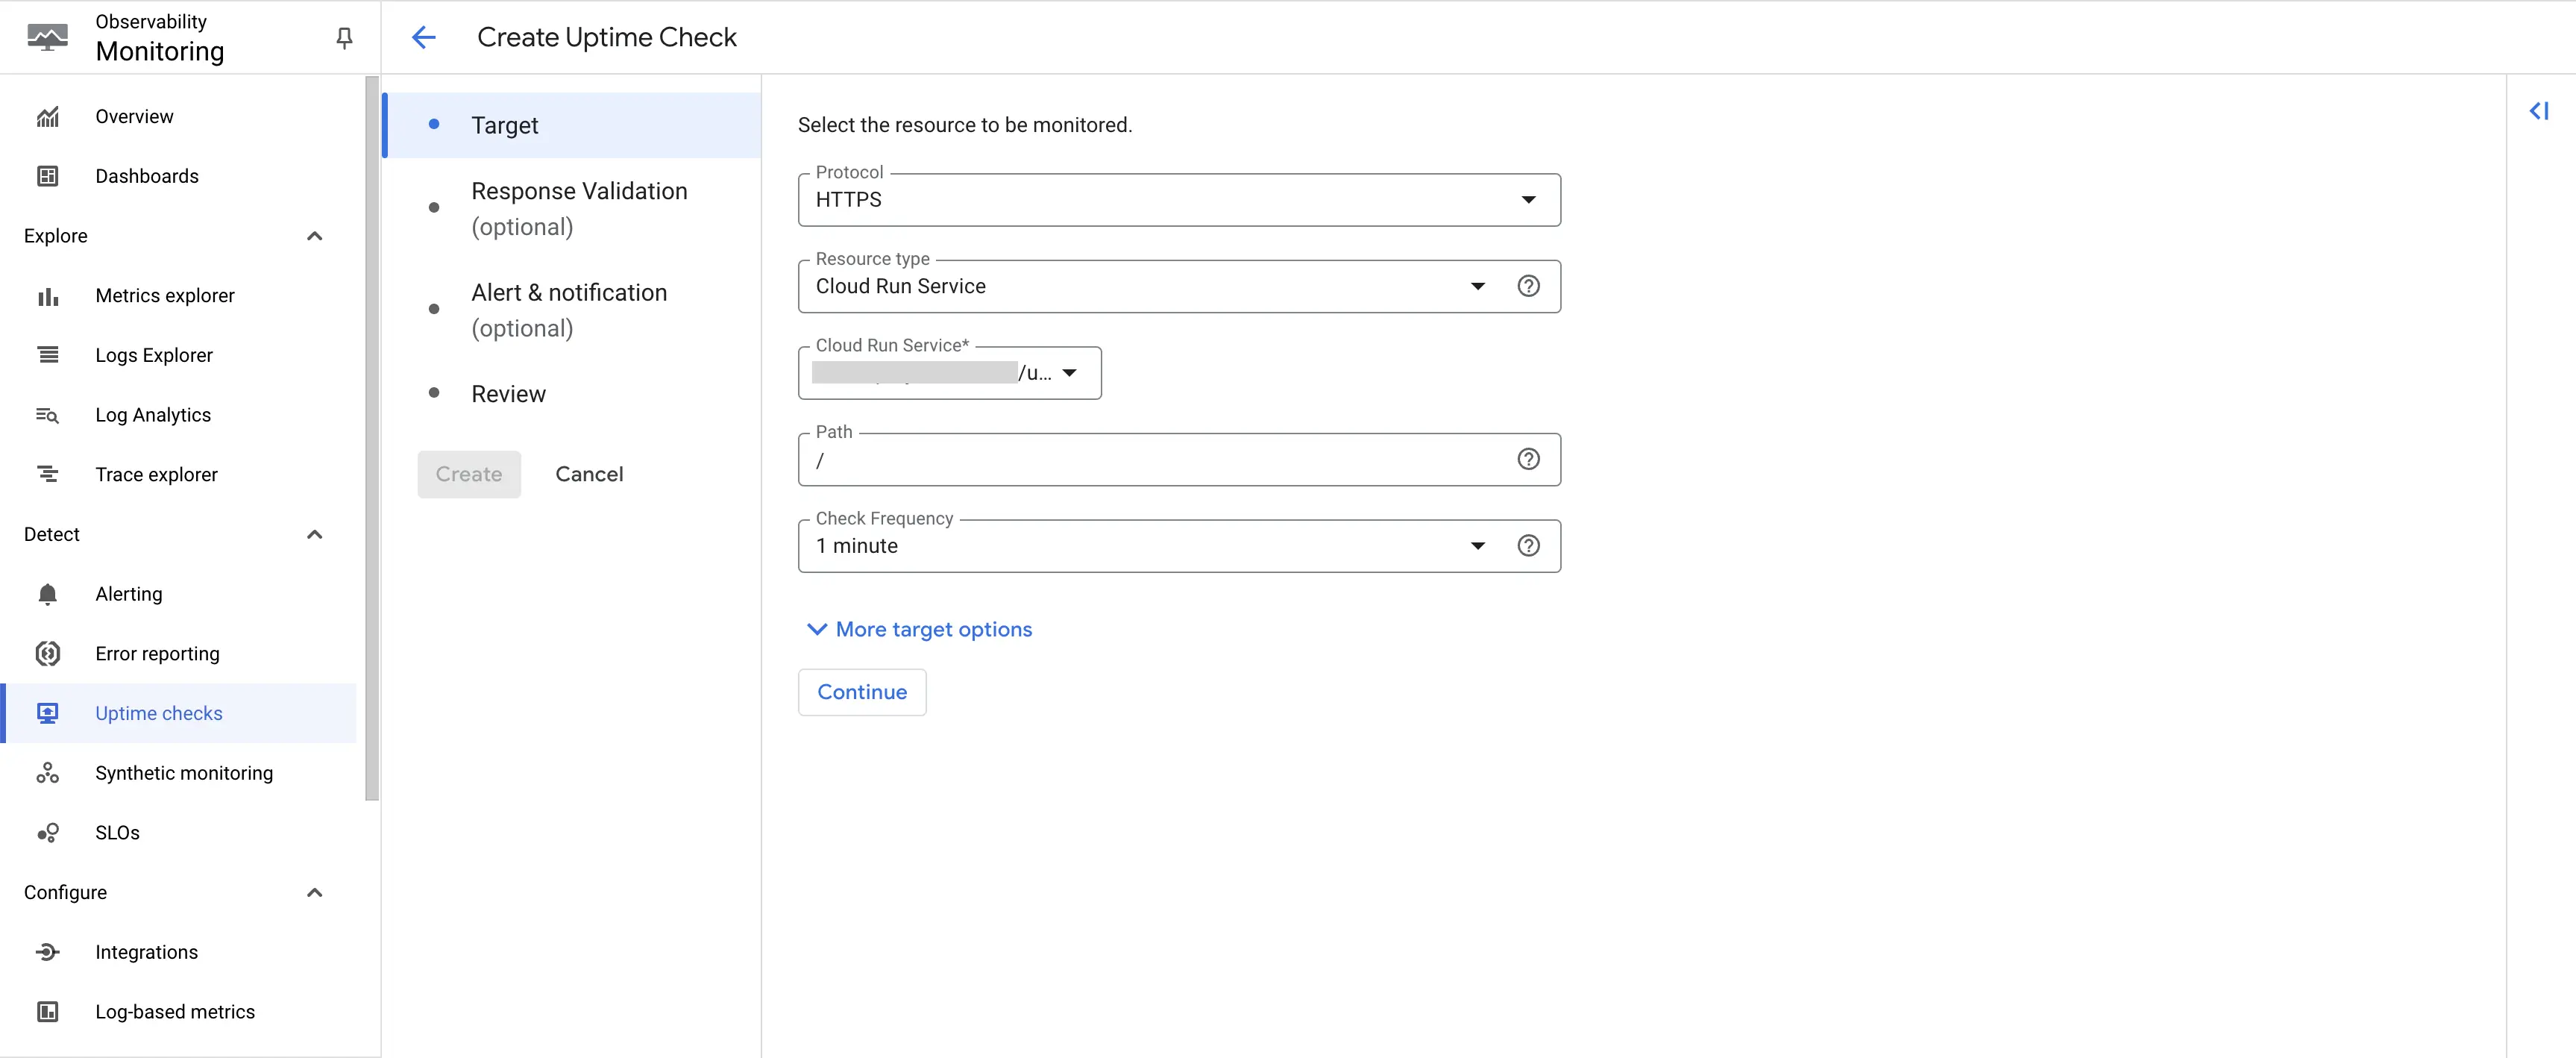
Create uptime check - Select Resource
Step 4: No changes are required on this page. Click on Continue.
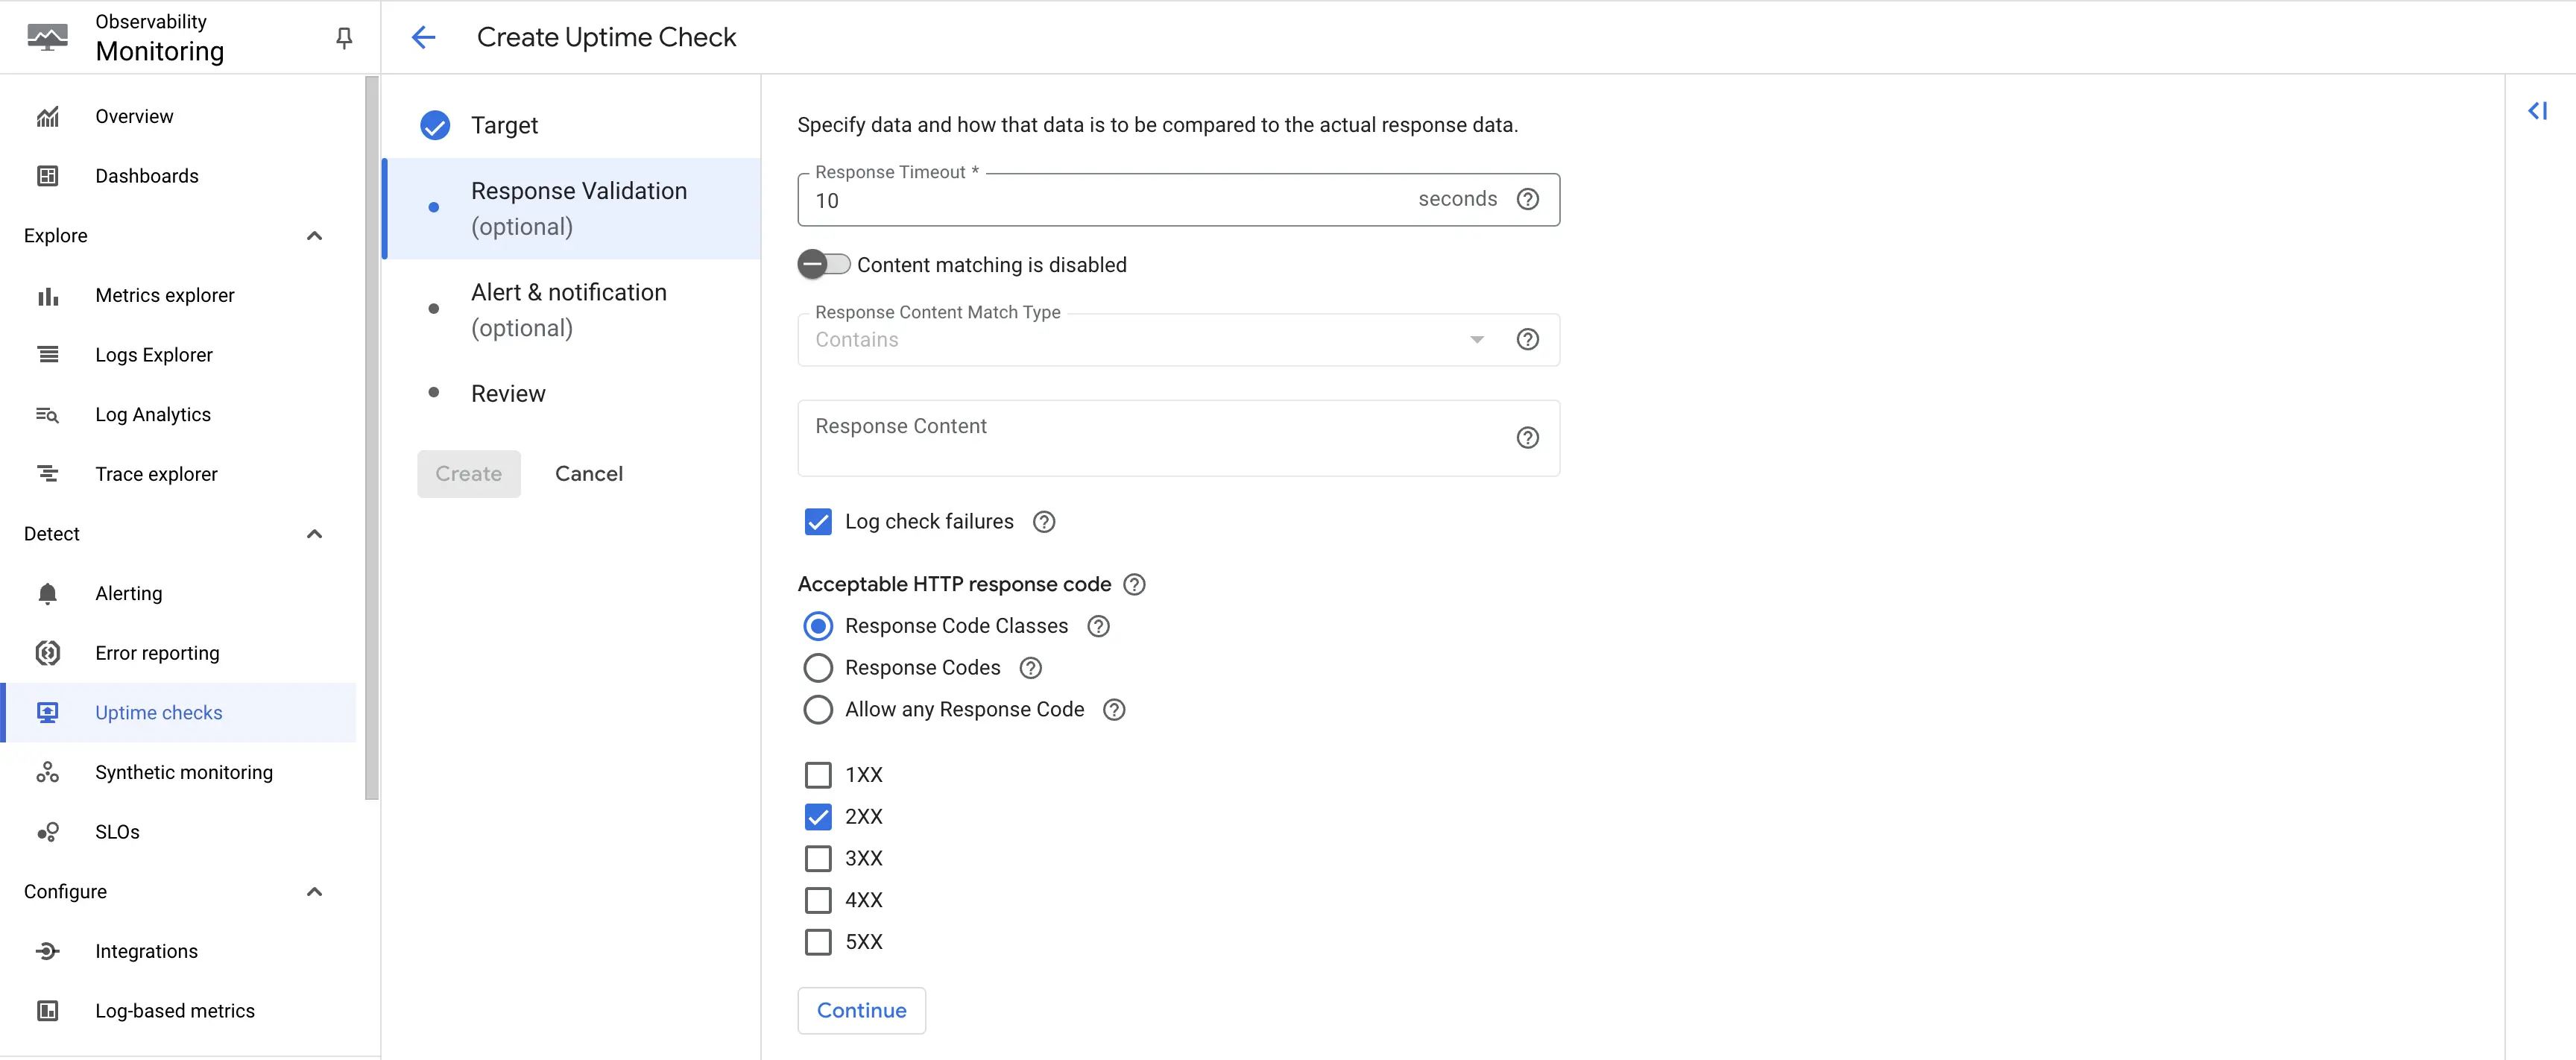
Create uptime check - Response Codes
Step 5: In this example, we won't set any alert. Hence, toggle off the Create an alert option, and click on Continue.
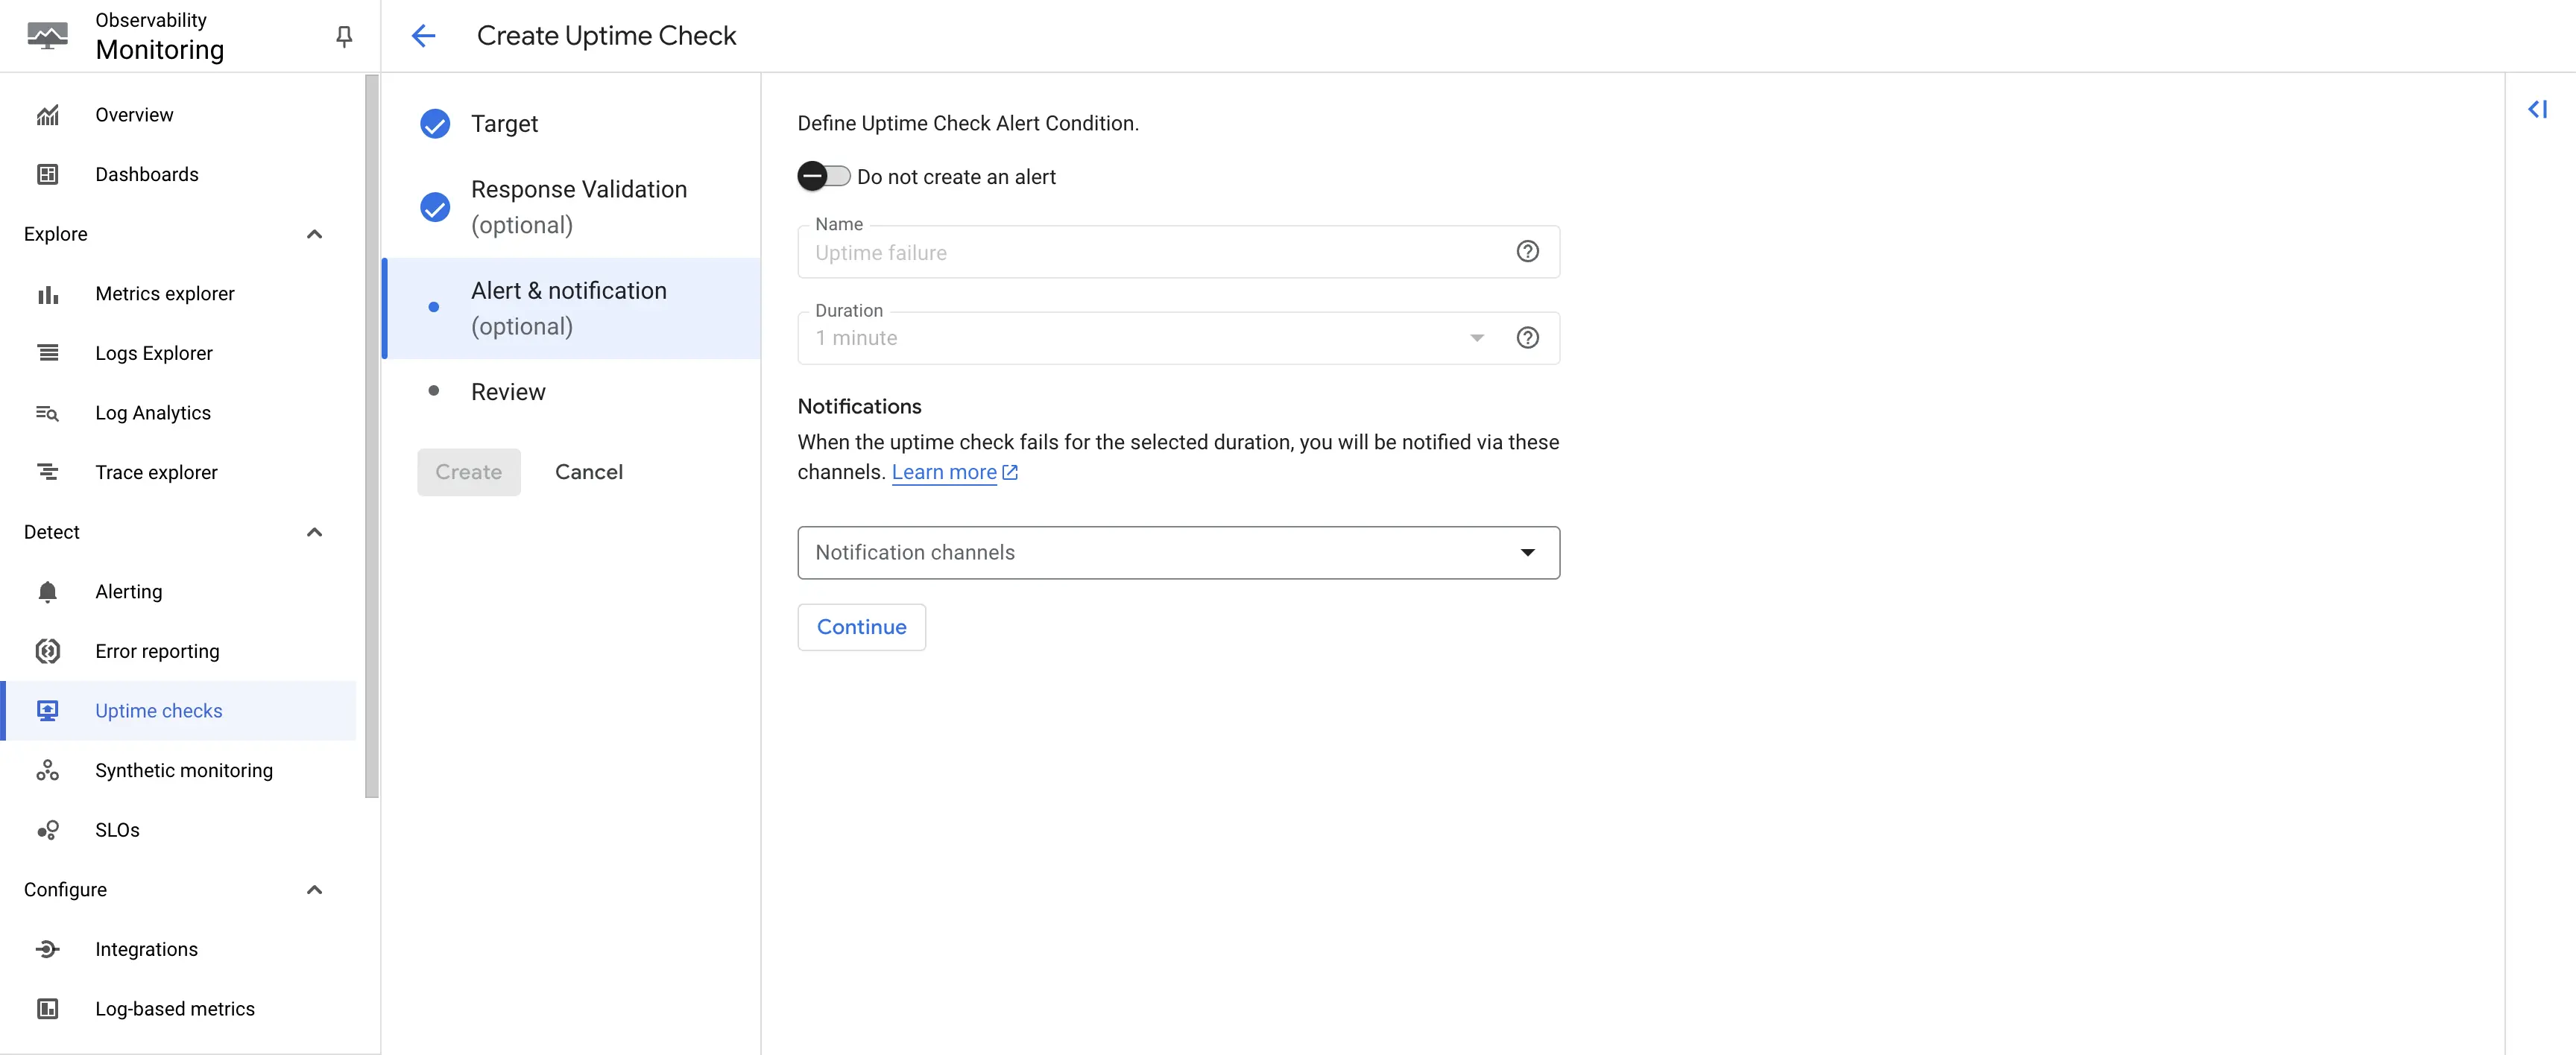
Create uptime check - Alert Creation
Step 6: Give an appropriate title to the uptime check. Click on Test. The uptime check should be successful with 200 response. Once tested, you can create the uptime check.
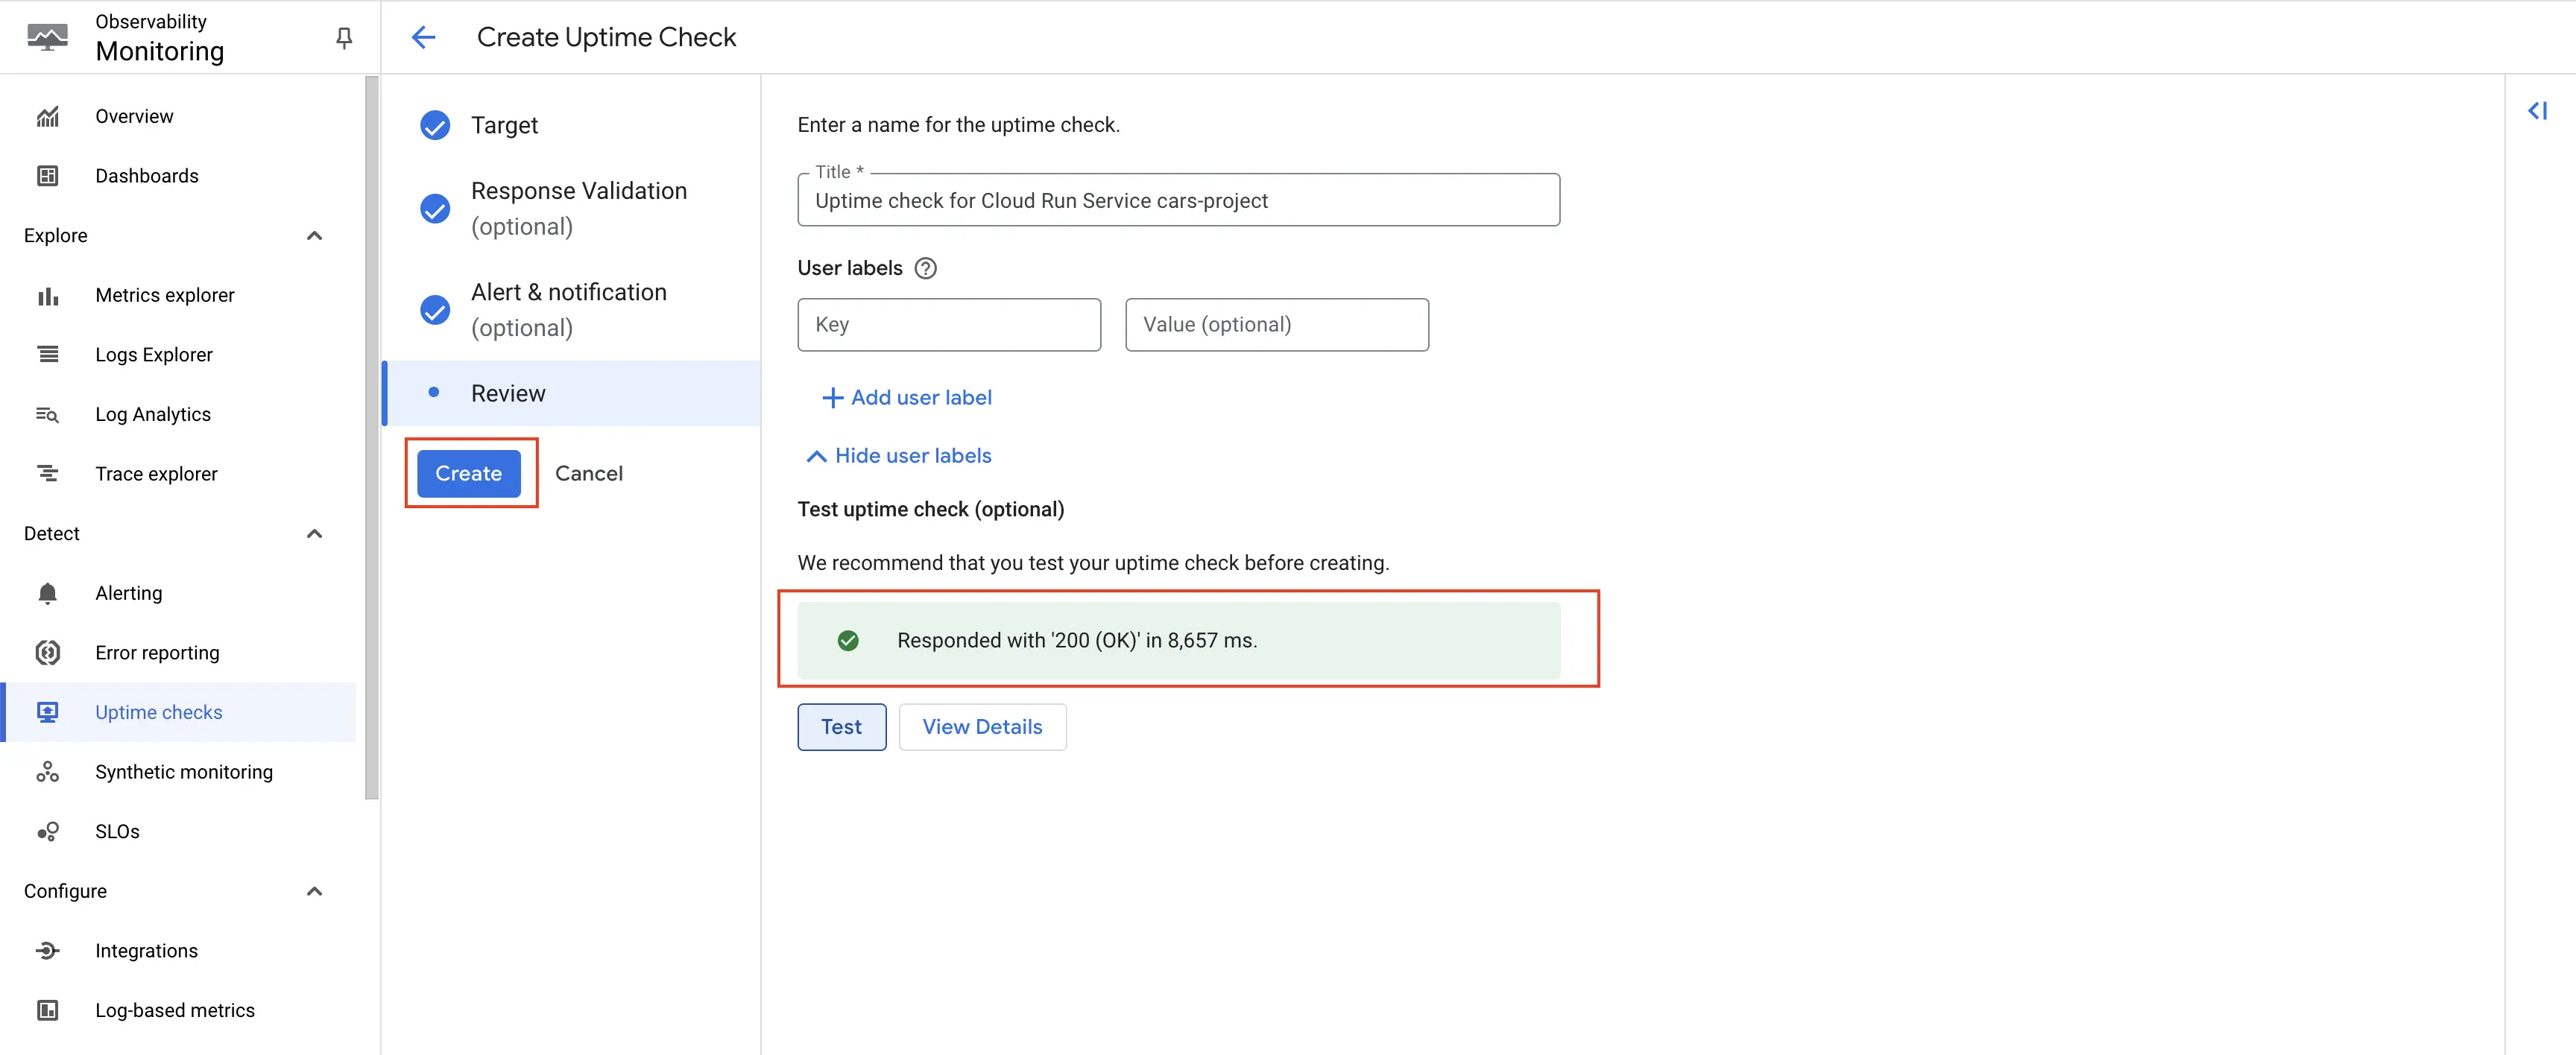
Test the uptime check
The uptime check is created, and from here on, the metrics will start getting emitted for Cloud Run service's uptime check.
Deploy OpenTelemetry to fetch the metrics from Google Cloud Monitoring
You will need a Compute Engine instance to install OpenTelemetry Collector. You can follow the instructions on the Creating Compute Engine document to create the Compute Engine instance.
Step 1: Install and configure OpenTelemetry for scraping the metrics from Google Cloud Monitoring. Follow OpenTelemetry Binary Usage in Virtual Machine guide for detailed instructions.
Note that googlecloudmonitoring receiver is supported only from version 0.112.0 and above of opentelemetry-collector. So, ensure you download and use the appropriate release.
Step 2: Create config.yaml.
Under the googlecloudmonitoring receiver, you need to specify the metrics that you want to capture in the metrics_list. You can include all the metrics that you would like to capture from Cloud Monitoring, see the available metrics for Cloud Monitoring.
Here is the config.yaml file for capturing Cloud Monitoring metrics:
receivers:
  googlecloudmonitoring:
    collection_interval: 5m # Can be specified in seconds (s), minutes (m), or hours (h)
    project_id: gcp-project-id
    metrics_list:
      - metric_name: "monitoring.googleapis.com/uptime_check/check_passed"
      - metric_name: "monitoring.googleapis.com/uptime_check/content_mismatch"
      - metric_name: "monitoring.googleapis.com/uptime_check/error_code"
      - metric_name: "monitoring.googleapis.com/uptime_check/http_status"
      - metric_name: "monitoring.googleapis.com/uptime_check/request_latency"
      - metric_name: "monitoring.googleapis.com/uptime_check/time_until_ssl_cert_expires"
processors:
  resource/env:
    attributes:
    - key: deployment.environment
      value: prod
      action: upsert
  batch: {}
exporters:
  otlp:
    endpoint: "ingest.{region}.signoz.cloud:443"
    tls:
      insecure: false
    headers:
      "signoz-ingestion-key": "<SIGNOZ_INGESTION_KEY>"
service:
  pipelines:
    metrics:
      receivers: [googlecloudmonitoring]
      processors: [resource/env,batch]
      exporters: [otlp]
Depending on the choice of your region for SigNoz cloud, the otlp endpoint will vary according to this table.
| Region | Endpoint |
|---|---|
| US | ingest.us.signoz.cloud:443 |
| IN | ingest.in.signoz.cloud:443 |
| EU | ingest.eu.signoz.cloud:443 |
After successful configuration start the OpenTelemetry Collector using the following command:
./otelcol-contrib --config ./config.yaml &> otelcol-output.log & echo "$!" > otel-pid
Step 3: If the configurations are configured correctly, you can see the output logs from OpenTelemtry as follows:
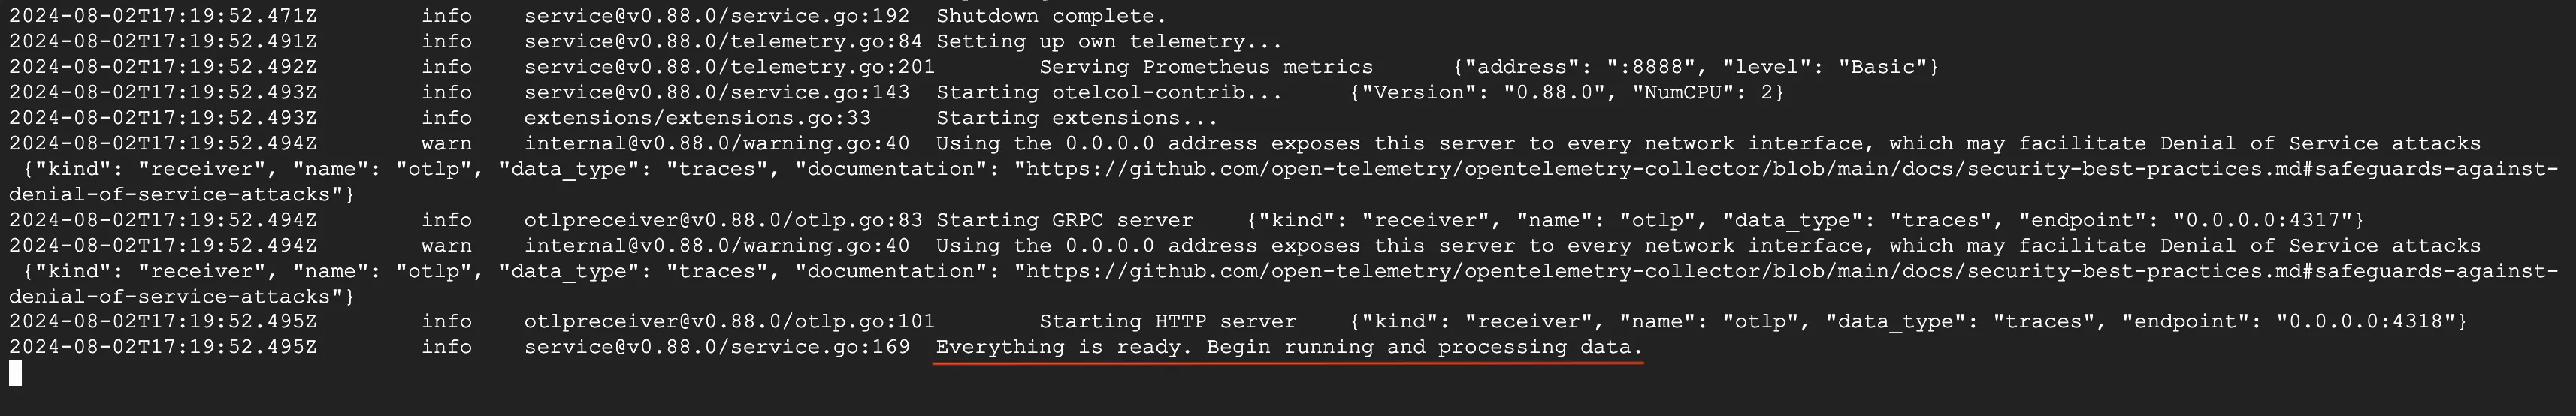
Viewing OTel Collector Logs
Send and Visualize the metrics obtained by OpenTelemetry in SigNoz
Step 1: Go to the SigNoz Cloud URL and head over to the dashboard.
Step 2: If not already created, create a new dashboard. You can create the dashboard and multiple panel under it by following the instructions here.
Step 3: Select metric for Cloud Monitoring
All metrics starting with mointoring_googleapis_com_ have been collected from Cloud Monitoring.
For example monitoring_googleapis_com_uptime_check_request_latency is one of the metrics that was collected.
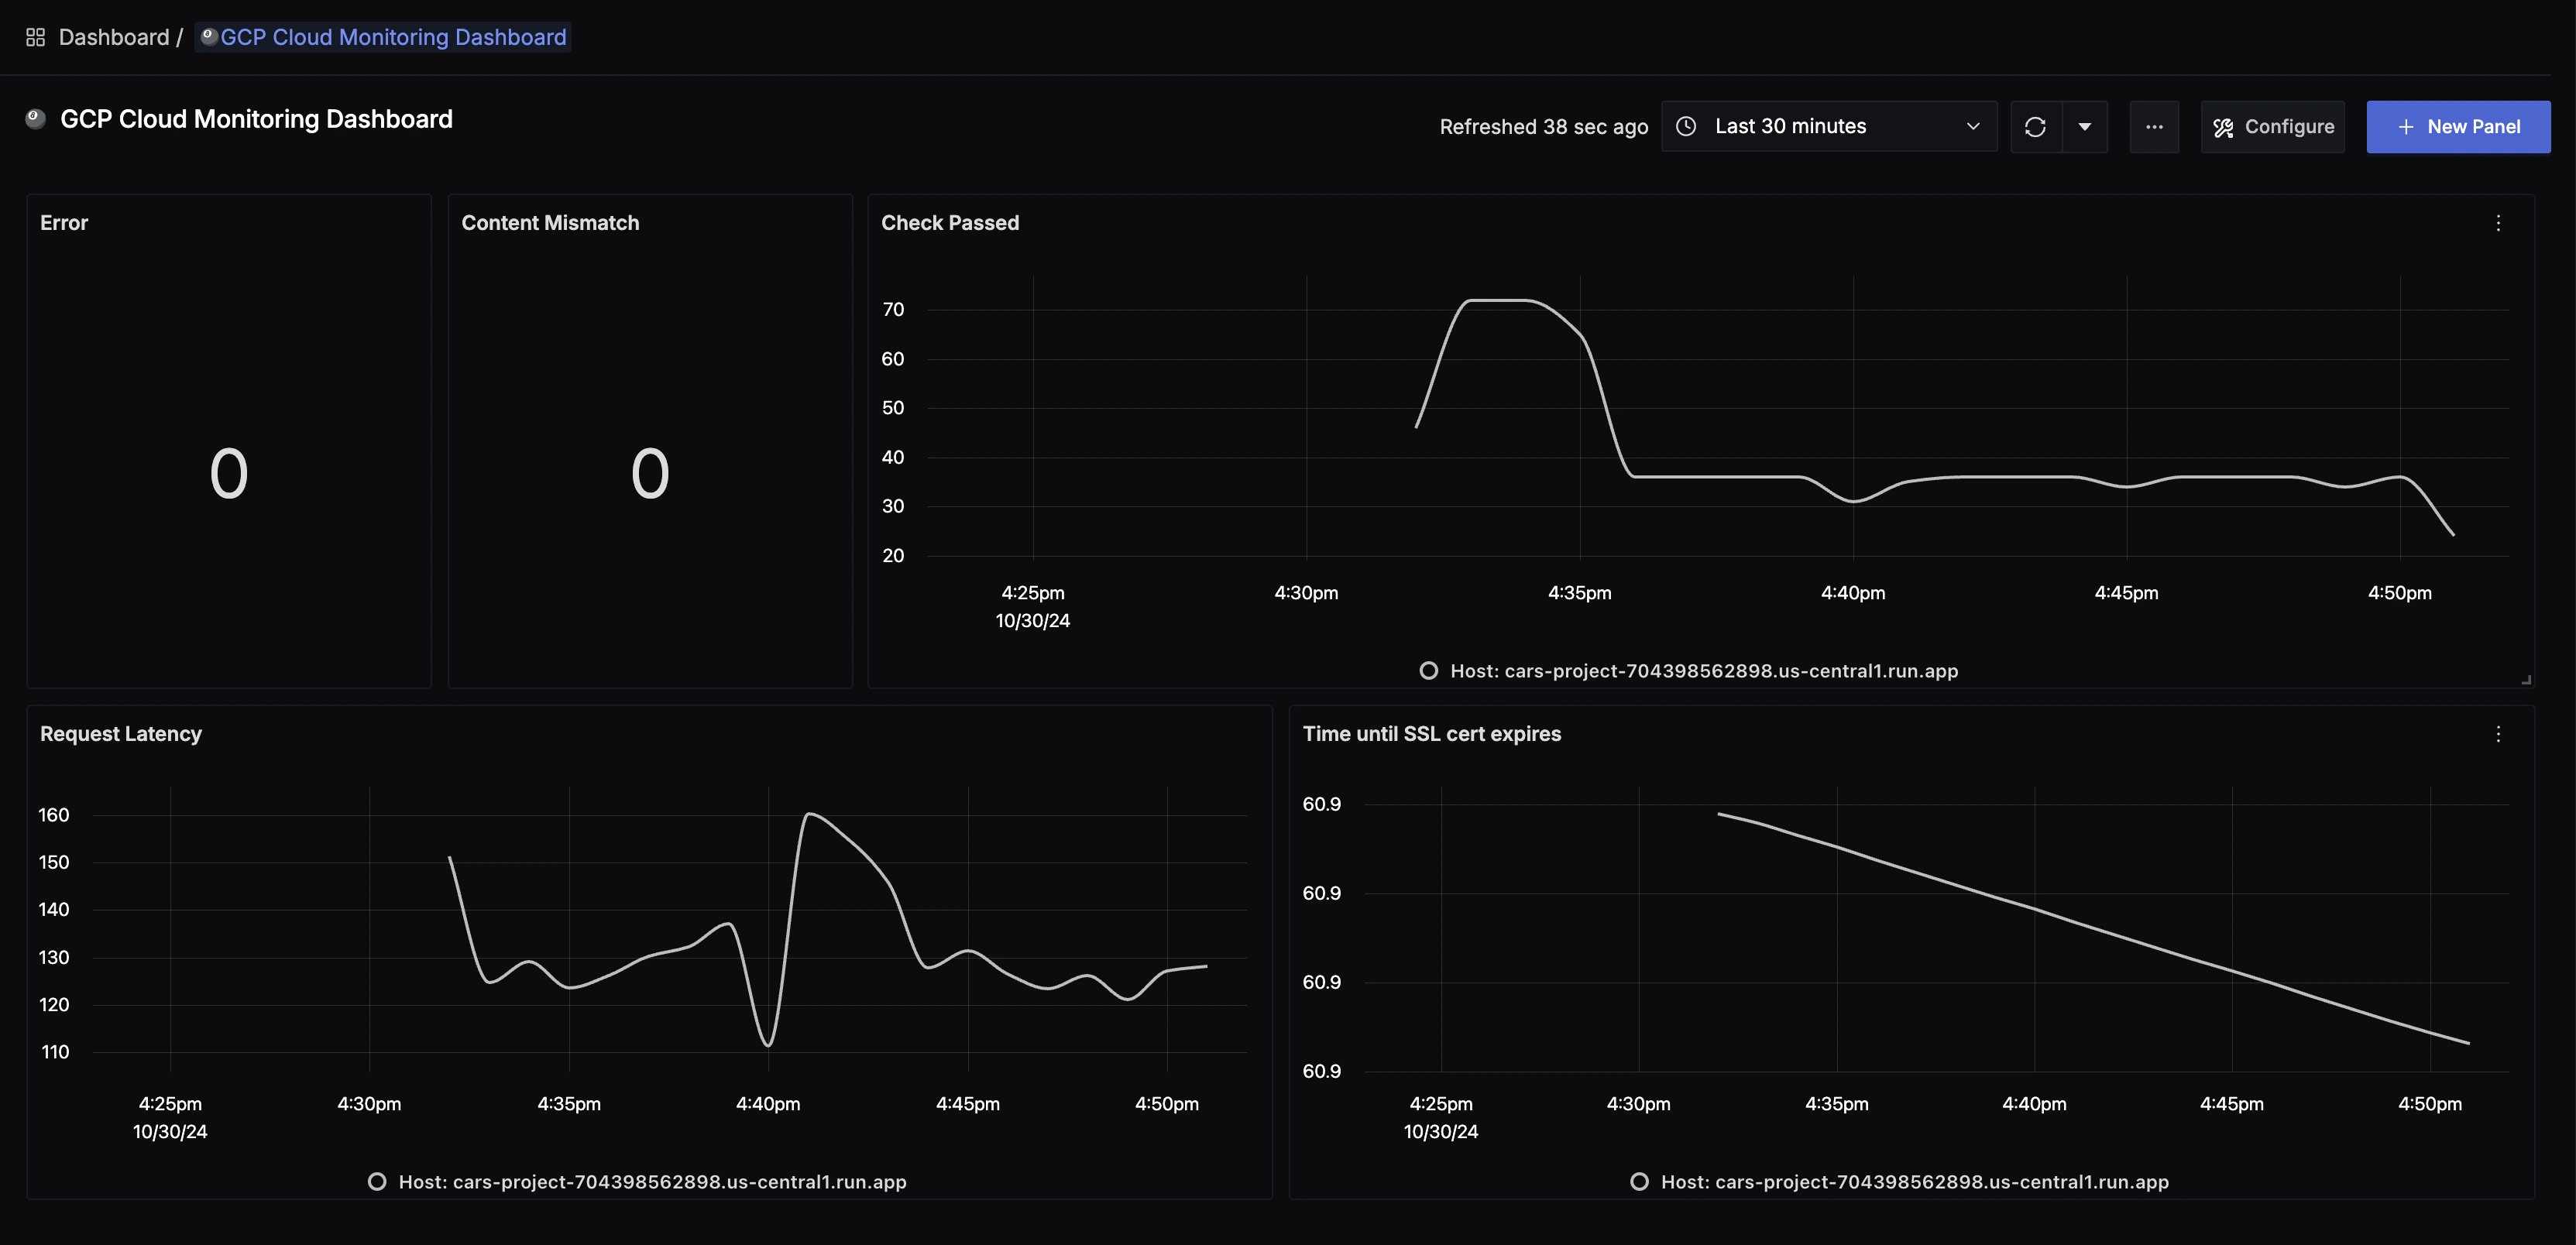
GCP Cloud Monitoring dashboard
Troubleshooting
If you run into any problems while setting up monitoring for your Cloud Monitoring's metrics with SigNoz, consider these troubleshooting steps:
- Verify Configuration: Double-check your
config.yamlfile to ensure all settings, including the ingestion key and endpoint, are correct. - Review Logs: Look at the logs of the OpenTelemetry Collector to identify any error messages or warnings that might provide insights into what’s going wrong.
- Update Dependencies: Ensure all relevant packages and dependencies are up-to-date to avoid compatibility issues.
- Consult Documentation: Review the SigNoz and OpenTelemetry documentation for any additional troubleshooting of the common issues.
Last updated: September 13, 2024
