Tracing in GKE
Overview
Google Kubernetes Engine (GKE) is a managed Kubernetes service provided by Google that simplifies the deployment, management, and operation of Kubernetes clusters. This document will help you send traces from your GKE cluster to SigNoz.
Prerequisites
- A GKE cluster
- kubectl installed to access the GKE cluster
- Helm installed
Quick Start
Before we begin, let's verify their cluster status with the following commands:
kubectl get nodes
Make sure all the nodes are in Readystate.
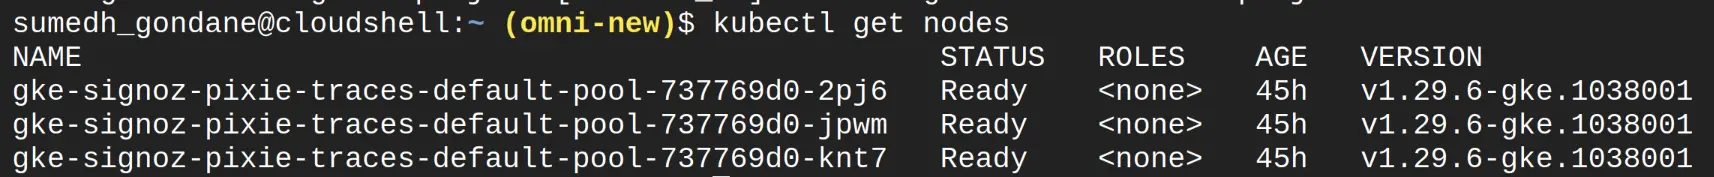
GKE Cluster Status
Step 1: Add the SigNoz helm repo using this command
helm repo add SigNoz https://charts.signoz.io
Step 2: Install OTel Agent and Deployment using signoz/k8s-infra Helm chart
helm install -n signoz kubelet-otel signoz/k8s-infra \\
--set signozApiKey=<ingestionKey> --set otelCollectorEndpoint="ingest.<region>.signoz.cloud:443" --set OtelInsecure=false --create-namespace
After applying the above commands, check whether the signoz namespace pods are running successfully or not:
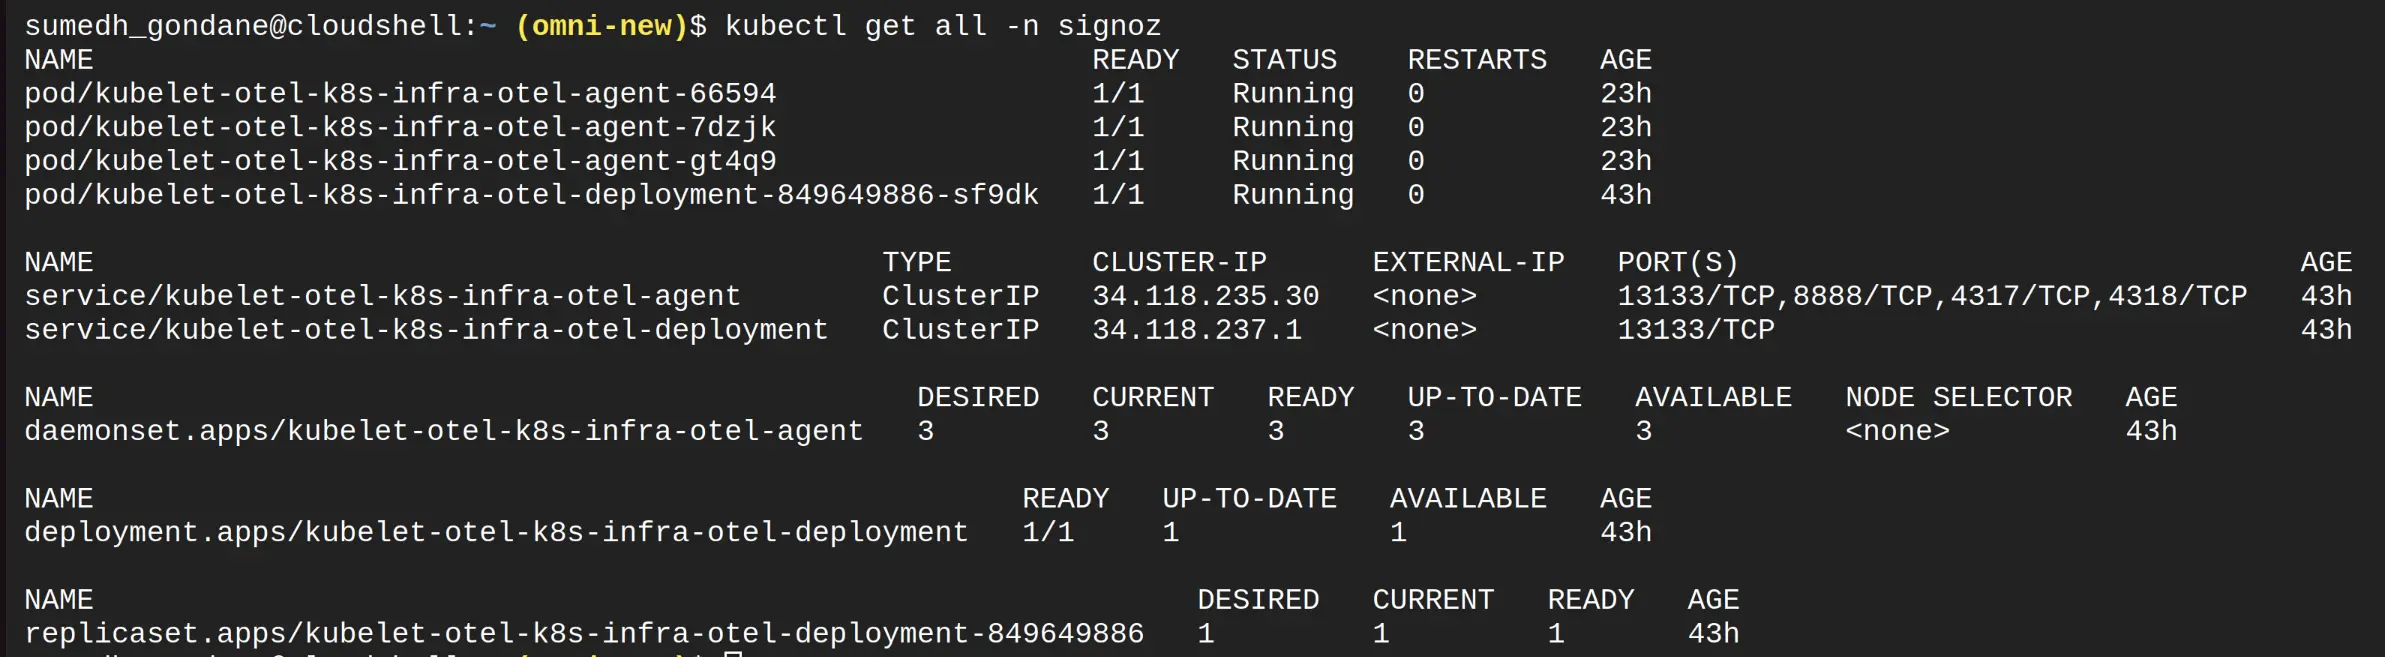
Resources Status
The OTel collector configurations can be found in Ote's config map as follows:
apiVersion: v1
kind: ConfigMap
  name: kubelet-otel-k8s-infra-otel-agent
data:
  otel-agent-config.yaml: |2-

    exporters:
      otlp:
        endpoint: "ingest.{region}.signoz.cloud:443"
        headers:
          signoz-ingestion-key: "<SIGNOZ_INGESTION_KEY>"
        tls:
          insecure: false
    extensions:
      health_check:
        endpoint: 0.0.0.0:13133
      pprof:
        endpoint: localhost:1777
      zpages:
        endpoint: localhost:55679
    processors:
      batch:
        send_batch_size: 10000
        timeout: 200ms
      k8sattributes:
        extract:
          metadata:
          - k8s.namespace.name
          - k8s.pod.name
          - k8s.pod.uid
          - k8s.pod.start_time
          - k8s.deployment.name
          - k8s.node.name
        filter:
          node_from_env_var: K8S_NODE_NAME
        passthrough: false
        pod_association:
        - sources:
          - from: resource_attribute
            name: k8s.pod.ip
        - sources:
          - from: resource_attribute
            name: k8s.pod.uid
        - sources:
          - from: connection
      resourcedetection:
        detectors:
        - system
        override: true
        system:
          hostname_sources:
          - dns
          - os
        timeout: 2s
      resourcedetection/internal:
        detectors:
        - env
        override: true
        timeout: 2s
      resource/env:
        attributes:
        - key: deployment.environment
          value: prod # can be dev, prod, staging etc. based on your environment
          action: upsert
    receivers:
      filelog/k8s:
        exclude:
        - /var/log/pods/signoz_kubelet-otel*-signoz-*/*/*.log
        - /var/log/pods/signoz_kubelet-otel*-k8s-infra-*/*/*.log
        - /var/log/pods/kube-system_*/*/*.log
        - /var/log/pods/*_hotrod*_*/*/*.log
        - /var/log/pods/*_locust*_*/*/*.log
        include:
        - /var/log/pods/*/*/*.log
        include_file_name: false
        include_file_path: true
        operators:
        - id: get-format
          routes:
          - expr: body matches "^\\{"
            output: parser-docker
          - expr: body matches "^[^ Z]+ "
            output: parser-crio
          - expr: body matches "^[^ Z]+Z"
            output: parser-containerd
          type: router
        - id: parser-crio
          output: extract_metadata_from_filepath
          regex: ^(?P<time>[^ Z]+) (?P<stream>stdout|stderr) (?P<logtag>[^ ]*) ?(?P<log>.*)$
          timestamp:
            layout: "2006-01-02T15:04:05.000000000-07:00"
            layout_type: gotime
            parse_from: attributes.time
          type: regex_parser
        - id: parser-containerd
          output: extract_metadata_from_filepath
          regex: ^(?P<time>[^ ^Z]+Z) (?P<stream>stdout|stderr) (?P<logtag>[^ ]*) ?(?P<log>.*)$
          timestamp:
            layout: '%Y-%m-%dT%H:%M:%S.%LZ'
            parse_from: attributes.time
          type: regex_parser
        - id: parser-docker
          output: extract_metadata_from_filepath
          timestamp:
            layout: '%Y-%m-%dT%H:%M:%S.%LZ'
            parse_from: attributes.time
          type: json_parser
        - id: extract_metadata_from_filepath
          output: add_cluster_name
          parse_from: attributes["log.file.path"]
          regex: ^.*\/(?P<namespace>[^_]+)_(?P<pod_name>[^_]+)_(?P<uid>[a-f0-9\-]+)\/(?P<container_name>[^\._]+)\/(?P<restart_count>\d+)\.log$
          type: regex_parser
        - field: resource["k8s.cluster.name"]
          id: add_cluster_name
          output: move_stream
          type: add
          value: EXPR(env("K8S_CLUSTER_NAME"))
        - from: attributes.stream
          id: move_stream
          output: move_container_name
          to: attributes["log.iostream"]
          type: move
        - from: attributes.container_name
          id: move_container_name
          output: move_namespace
          to: resource["k8s.container.name"]
          type: move
        - from: attributes.namespace
          id: move_namespace
          output: move_pod_name
          to: resource["k8s.namespace.name"]
          type: move
        - from: attributes.pod_name
          id: move_pod_name
          output: move_restart_count
          to: resource["k8s.pod.name"]
          type: move
        - from: attributes.restart_count
          id: move_restart_count
          output: move_uid
          to: resource["k8s.container.restart_count"]
          type: move
        - from: attributes.uid
          id: move_uid
          output: move_log
          to: resource["k8s.pod.uid"]
          type: move
        - from: attributes.log
          id: move_log
          to: body
          type: move
        start_at: beginning
      hostmetrics:
        collection_interval: 30s
        scrapers:
          cpu: {}
          disk: {}
          filesystem: {}
          load: {}
          memory: {}
          network: {}
      kubeletstats:
        auth_type: serviceAccount
        collection_interval: 30s
        endpoint: ${K8S_HOST_IP}:10250
        extra_metadata_labels:
        - container.id
        - k8s.volume.type
        insecure_skip_verify: true
        metric_groups:
        - container
        - pod
        - node
        - volume
      otlp:
        protocols:
    service:
      extensions:
      - health_check
      - zpages
      - pprof
      pipelines:
        logs:
          exporters:
          - otlp
          processors:
          - k8sattributes
          - batch
          receivers:
          - otlp
          - filelog/k8s
        metrics:
          exporters:
          - otlp
          processors:
          - k8sattributes
          - batch
          receivers:
          - otlp
        metrics/internal:
          exporters:
          - otlp
          processors:
          - resourcedetection/internal
          - resourcedetection
          - k8sattributes
          - batch
          receivers:
          - hostmetrics
          - kubeletstats
        traces:
          exporters:
          - otlp
          processors:
          - k8sattributes
          - batch
          - resource/env
          receivers:
          - otlp
      telemetry:
        logs:
          encoding: json
        metrics:
          address: 0.0.0.0:8888
This should start sending signals to SigNoz.
APM and Distributed Tracing
For application-level tracing, you can use the OpenTelemetry SDKs integrated with your application. These SDKs automatically collect and forward traces to the central collector.
Please refer to our SigNoz Documentation to find information on how to instrument your application like Spring, FastAPI, NextJS, Langchain, Node.js, Flask, Django, etc.
Sample Python Application
We will use a sample flask app. One may need to add packages for enabling instrumentation.
requirements.txt
Flask==3.0.0
pymongo==3.12.1
requests==2.26.0
opentelemetry-api==1.22.0
opentelemetry-distro==0.43b0
opentelemetry-instrumentation==0.43b0
opentelemetry-exporter-otlp==1.22.0
Install those packages in dockerfile configuration.
…

# install dependencies
RUN pip install -r requirements.txt
RUN opentelemetry-bootstrap --action=install
…
Example YAML
For running this sample-flask-app as pod
sample-flask-app.yaml
apiVersion: v1
kind: Pod
metadata:
  creationTimestamp: null
  labels:
    app: sample-flask-app
  name: sample-flask-app
spec:
  containers:
  - image: mongo:latest
    name: mongo
    ports:
    - name: mongo
      containerPort: 27017
  - image: signoz/sample-flask-app:latest
    name: sample-app
    ports:
    - name: flask
      containerPort: 5002
    env:
    - name: MONGO_HOST
      value: localhost
    - name: OTEL_RESOURCE_ATTRIBUTES
      value: service.name=sample-app
    - name: OTEL_EXPORTER_OTLP_ENDPOINT
      value: http://<app-fqdn>:4317
    - name: OTEL_EXPORTER_OTLP_PROTOCOL
      value: grpc
  dnsPolicy: ClusterFirst
  restartPolicy: Always
Deployment & Expose port
kubectl apply -f sample-flask-app.yaml
One can expose the application via NodePort or LoadBalancer as service.
kubectl expose pod --port=5002 --name=sample-flask-svc –type NodePort
Update OTel config map configuration
You need to add SigNoz cloud credentials at OTel config map:
kubectl get configmap kubelet-otel-k8s-infra-otel-agent -n signoz -o yaml
apiVersion: v1
data:
  otel-agent-config.yaml: |2-
    exporters:
      Otlp:
        endpoint: "ingest.{region}.signoz.cloud:443"
        headers:
          signoz-ingestion-key: "<SIGNOZ_INGESTION_KEY>"
        tls:
          insecure: false
    extensions:
      health_check:
        endpoint: 0.0.0.0:13133
      …
Visualize tracing in SigNoz cloud
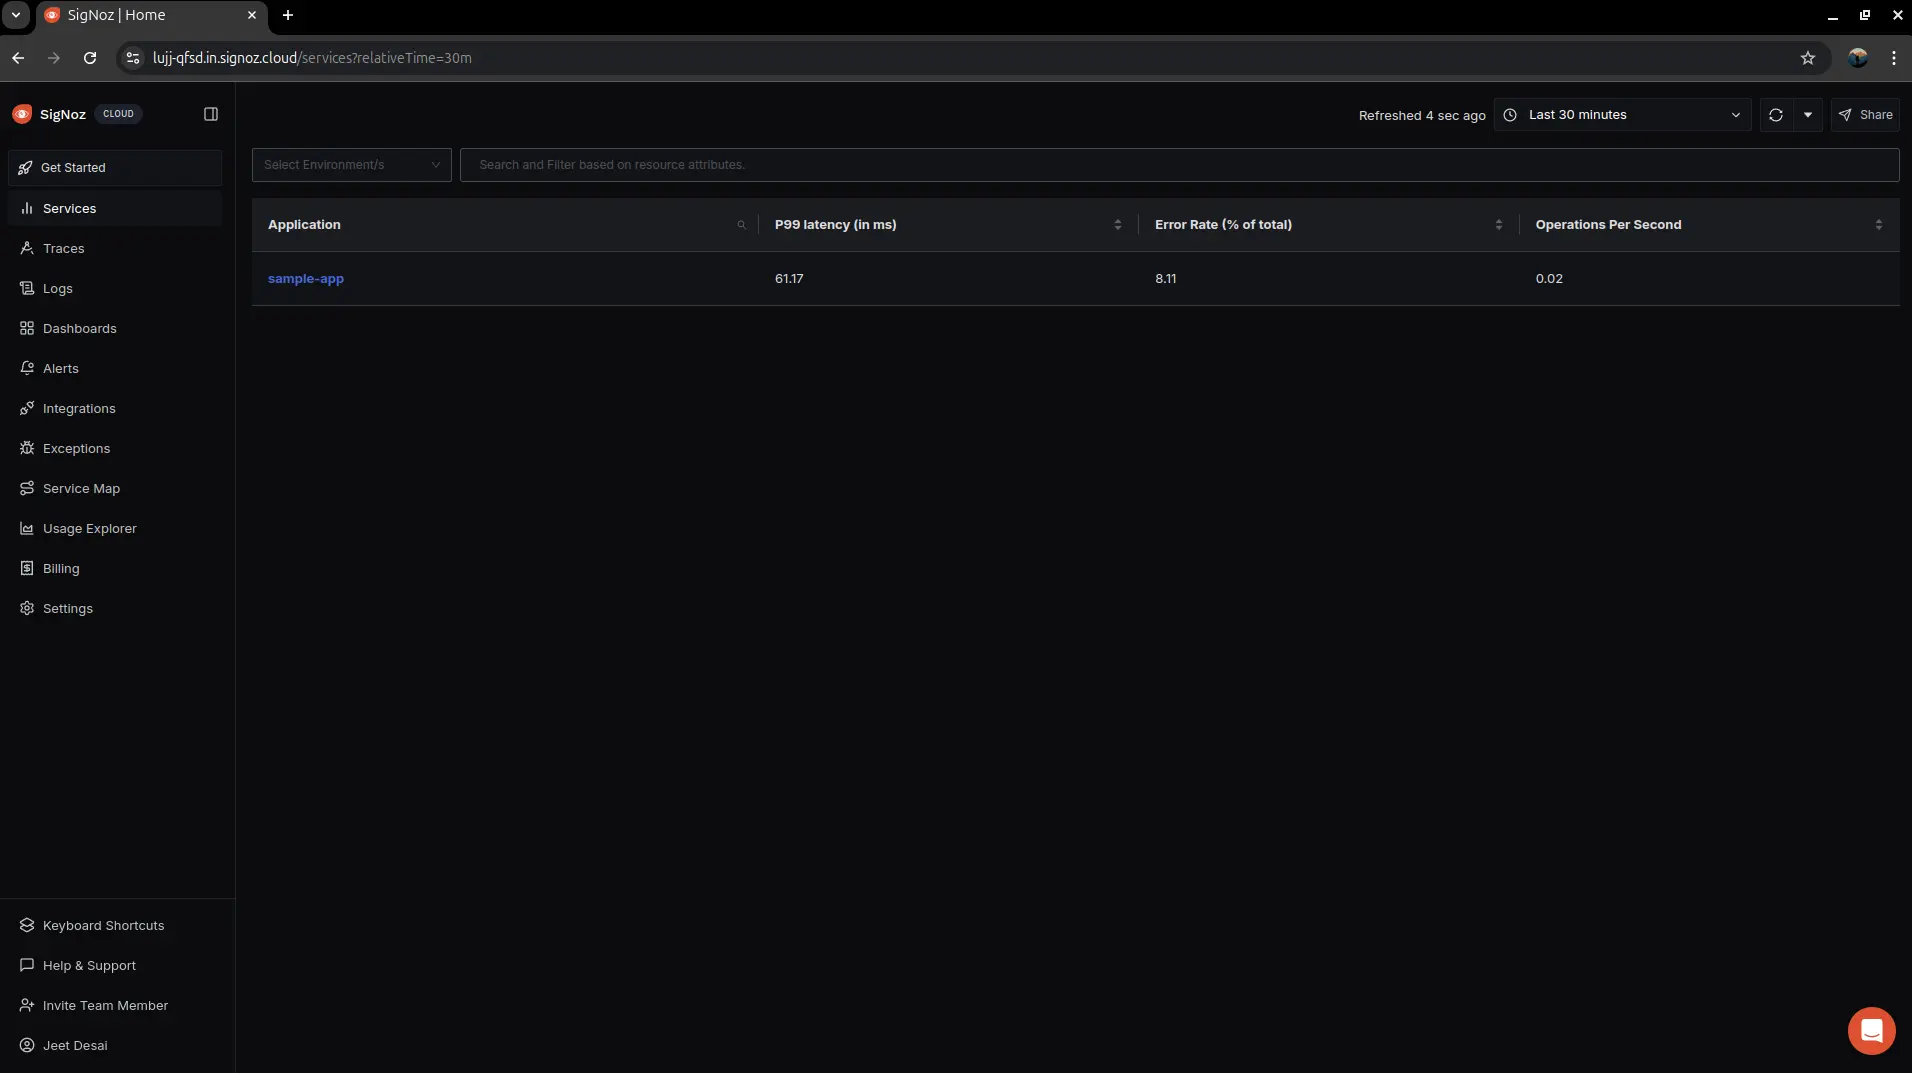
Application in SigNoz Dashboard
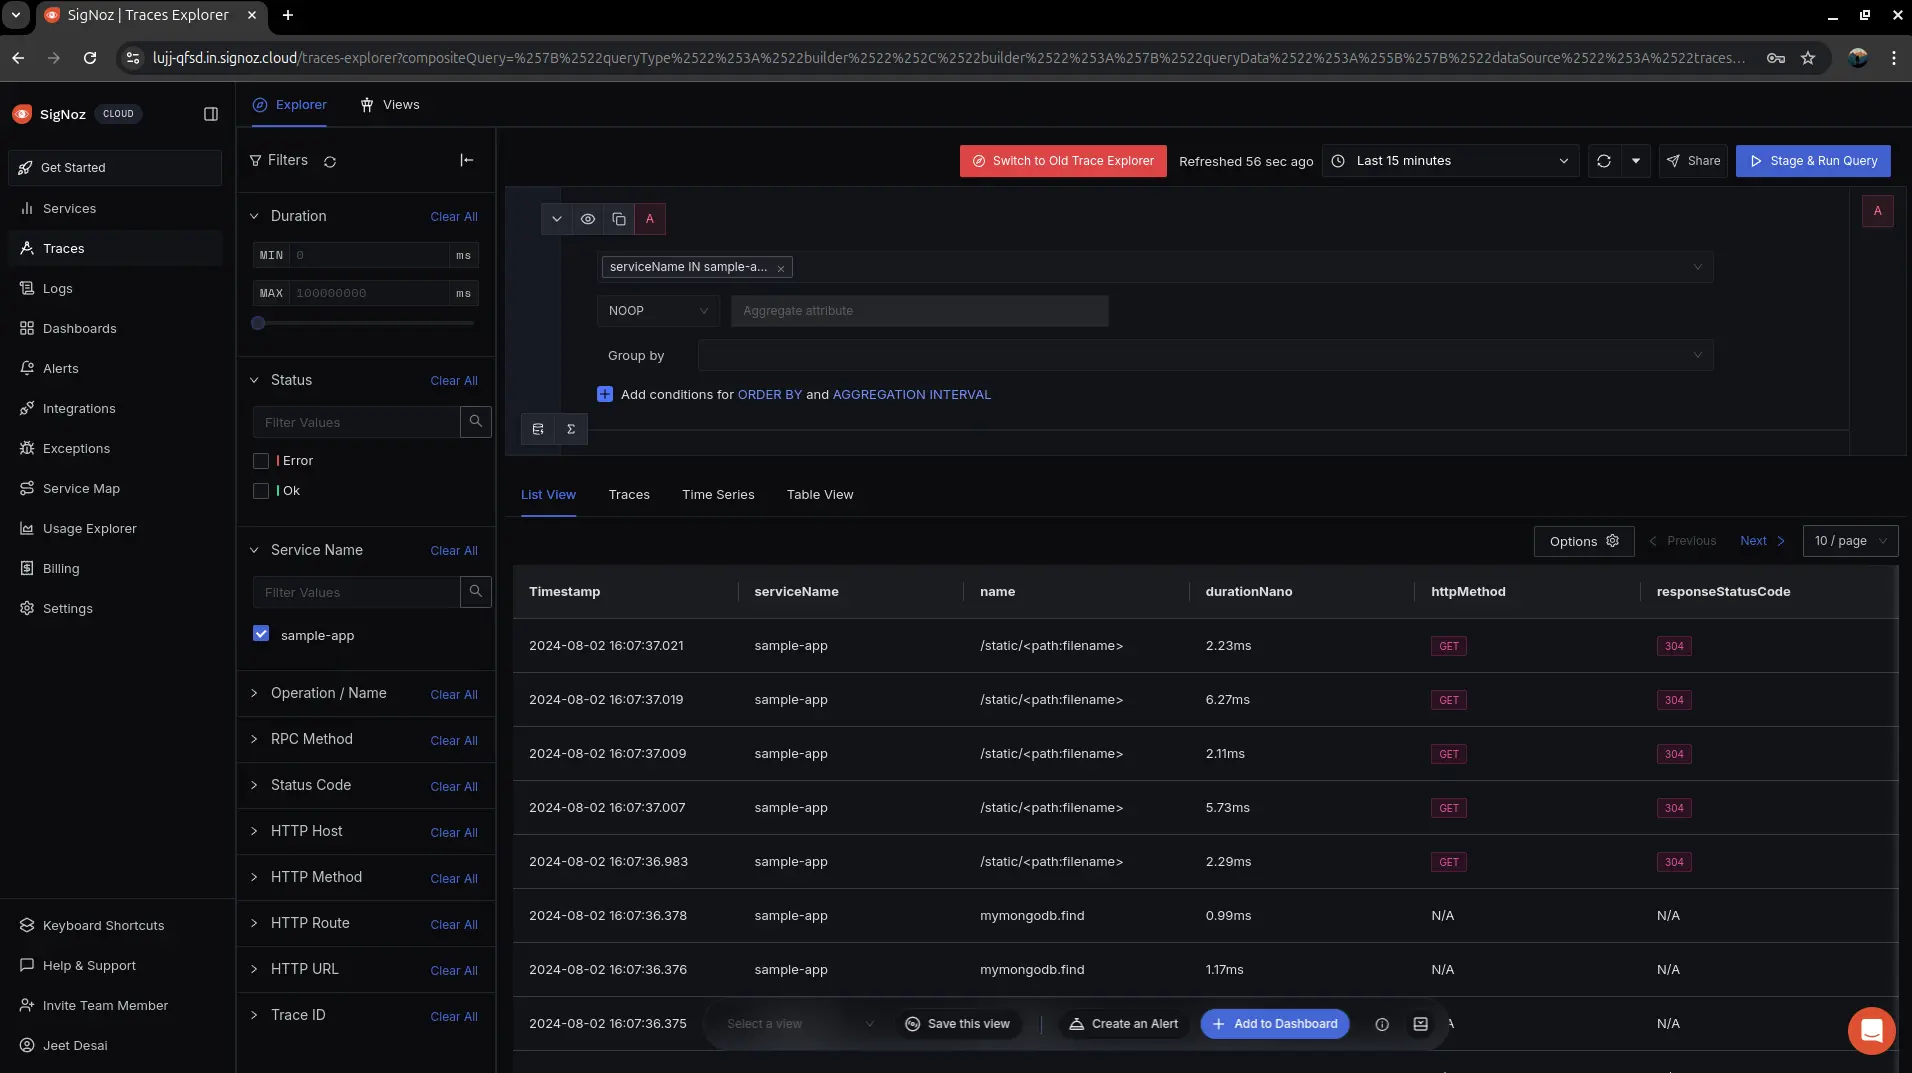
Application-level traces in SigNoz
Troubleshooting
If you encounter any issues while setting up logging and metrics for your GKE cluster, follow these troubleshooting steps:
Check the logs of the OpenTelemetry Collector:
kubectl logs -f -n signoz -l app.kubernetes.io/component=otel-agentReview the logs for any error messages or indications of misconfiguration.
Verify the rendered configuration:
kubectl get configmap/kubelet-otel-k8s-infra-otel-agent -n signoz -o yamlEnsure the configuration matches your expected settings, including the SigNoz API key and the OpenTelemetry Collector endpoint.
Confirm that the necessary Kubernetes resources are created:
kubectl get pods,services,configmaps -n signozCheck if the required pods, services, and config maps are running and in a healthy state.
Verify network connectivity:
- Ensure that the GKE cluster has network access to the SigNoz ingestion endpoint (
ingest.<region>.signoz.cloud:443). - Check if there are any network security groups or firewalls blocking the required ports.
- Ensure that the GKE cluster has network access to the SigNoz ingestion endpoint (
Double-check the SigNoz API key:
- Confirm that the provided signozApiKey is correct and has the necessary permissions to ingest data.
Check if all the Pixie deployments are in the correct order:
- Check all the configurations and deployments are in the correct order so that Pixie can forward all the scraped traces to the respective endpoint.
Last updated: August 2, 2024
