VPC Logging
Overview
This document provides a detailed walkthrough on how to send Serverless VPC Access Connector logs to SigNoz.
Prerequisites
- Google Cloud account with administrative privilege, or Serverless VPC Access Admin and Compute Engine Admin privilege. You might also require access to create Cloud Function in case you are following the tutorial to create Serverless VPC Connector.
- Access to a project in GCP
Setup
Create Serverless VPC Access Connector
Follow the Creating Serverless VPC Access Connector document to create the serverless VPC access connector.
Enable Flow Logs
Step 1: On the GCP Console, search for VPC, and select VPC networks.
Step 2: Enter the network where the traffic is being directed. In this case, the network on which the Compute Engine instance running the NodeJS is hosted.
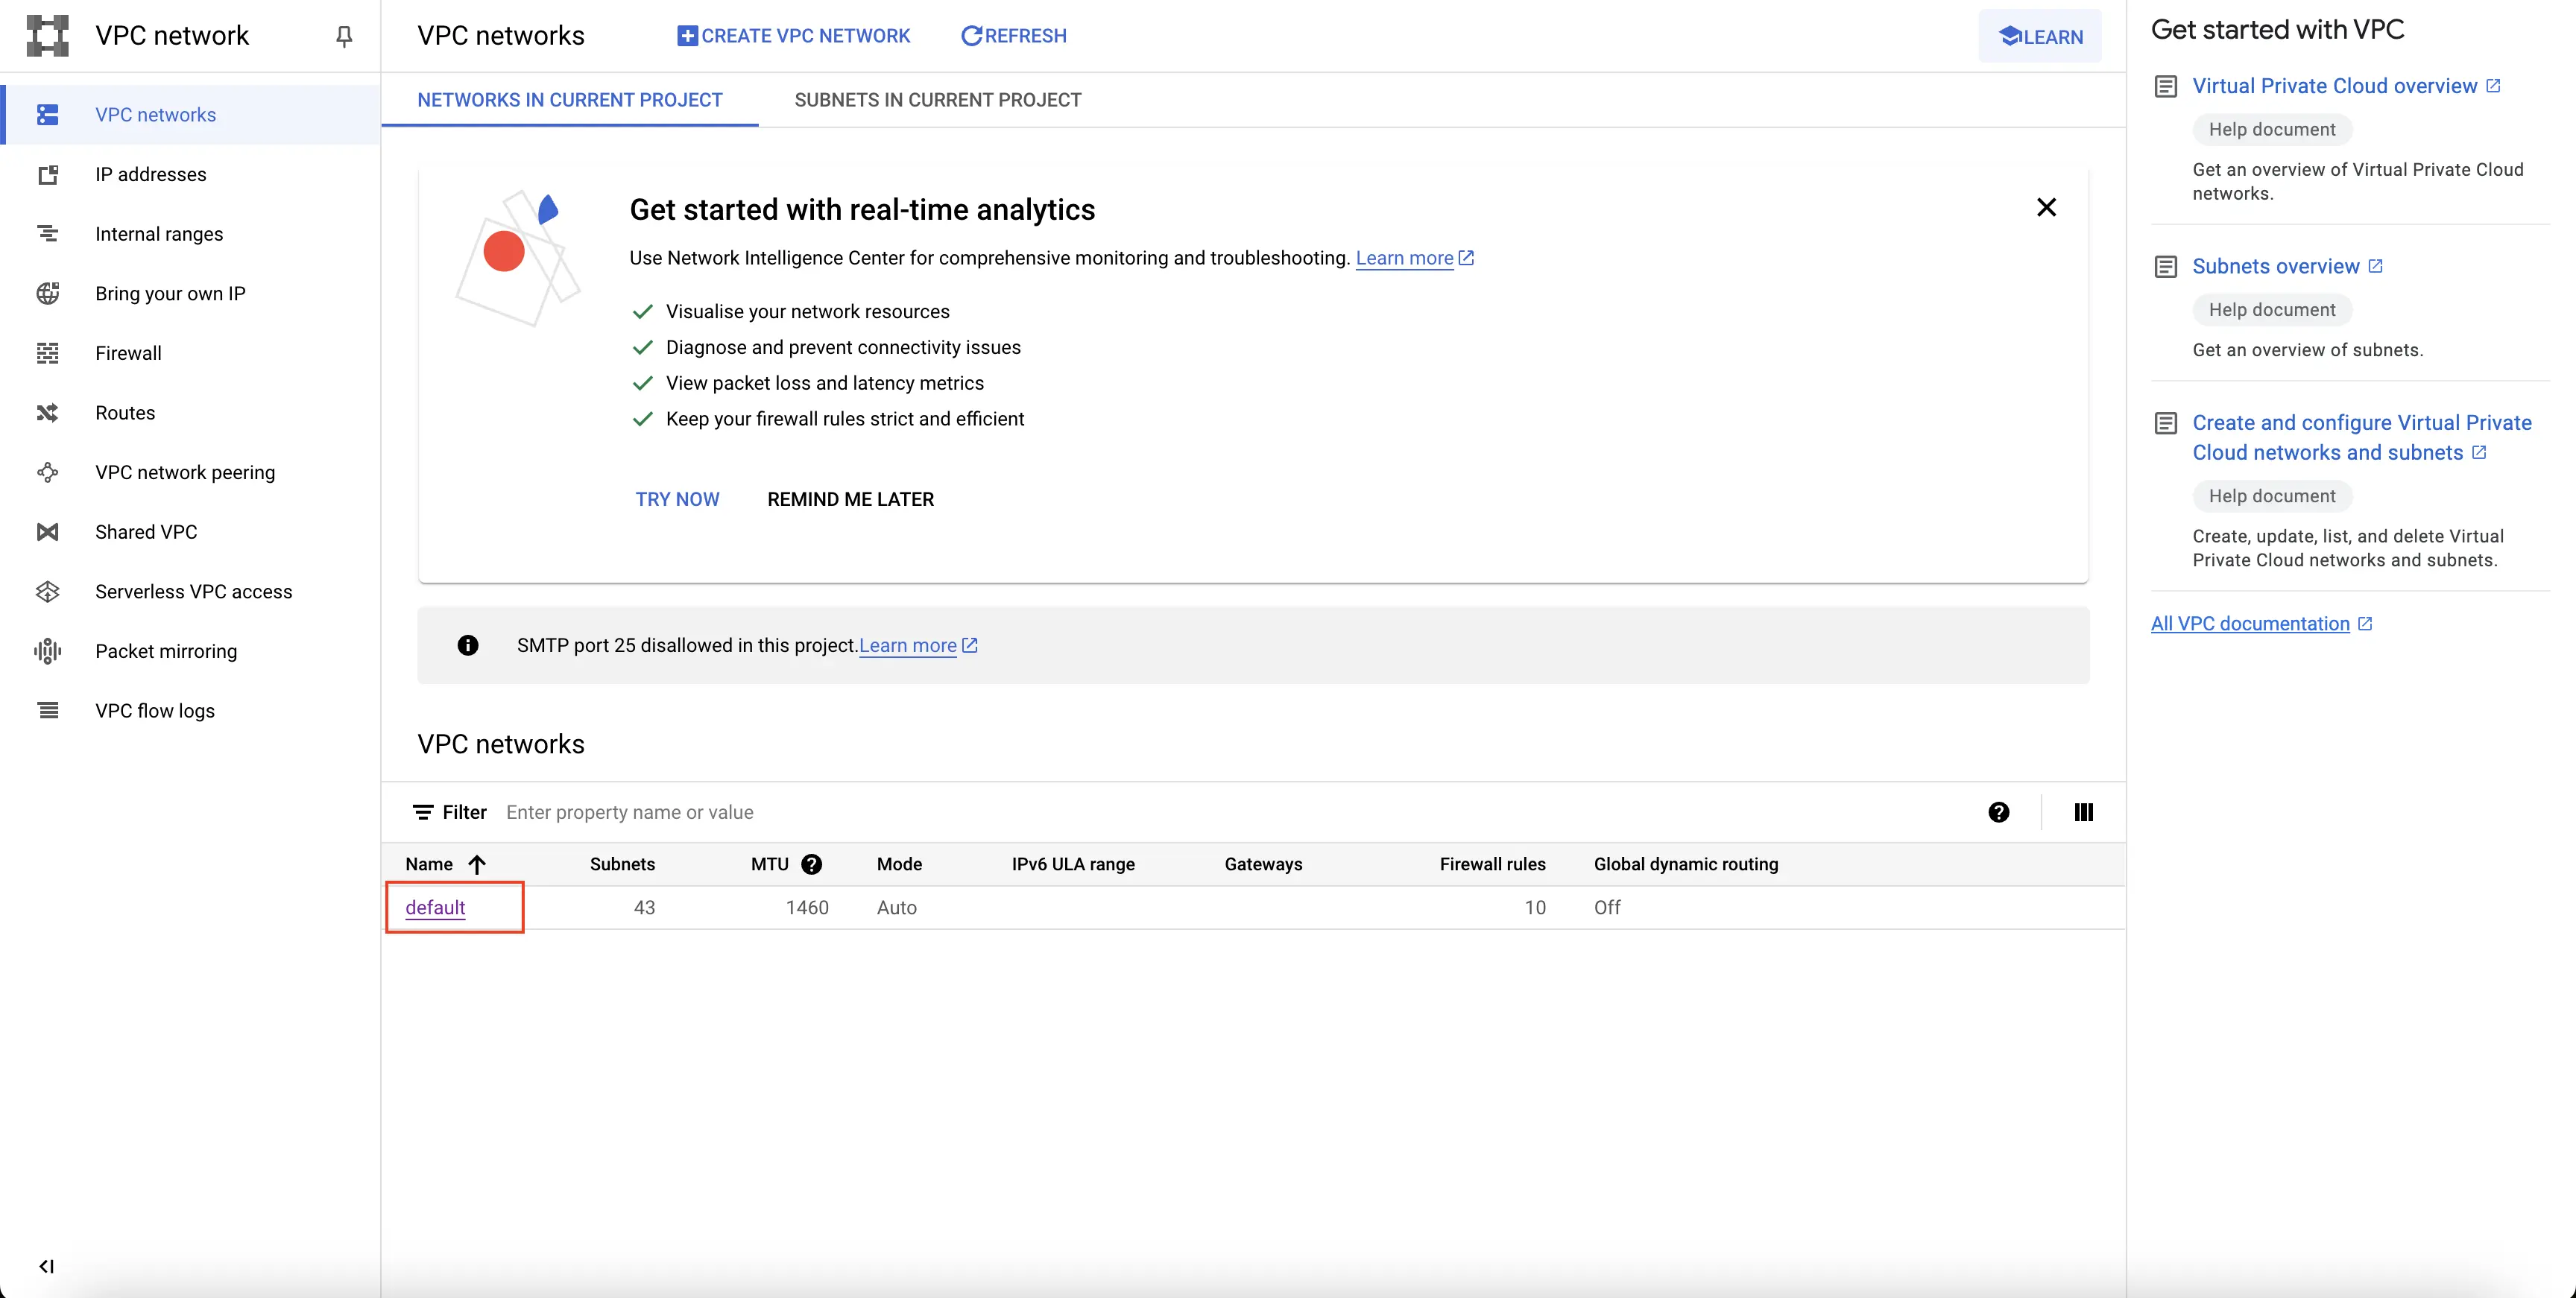
Enter into VPC network
Step 3: Select the Subnets tab from the top, and enter into the subnet corresponding to the region whose flow logs you want to capture. In this case, it will be the region in which the Compute Engine instance running the NodeJS is hosted.
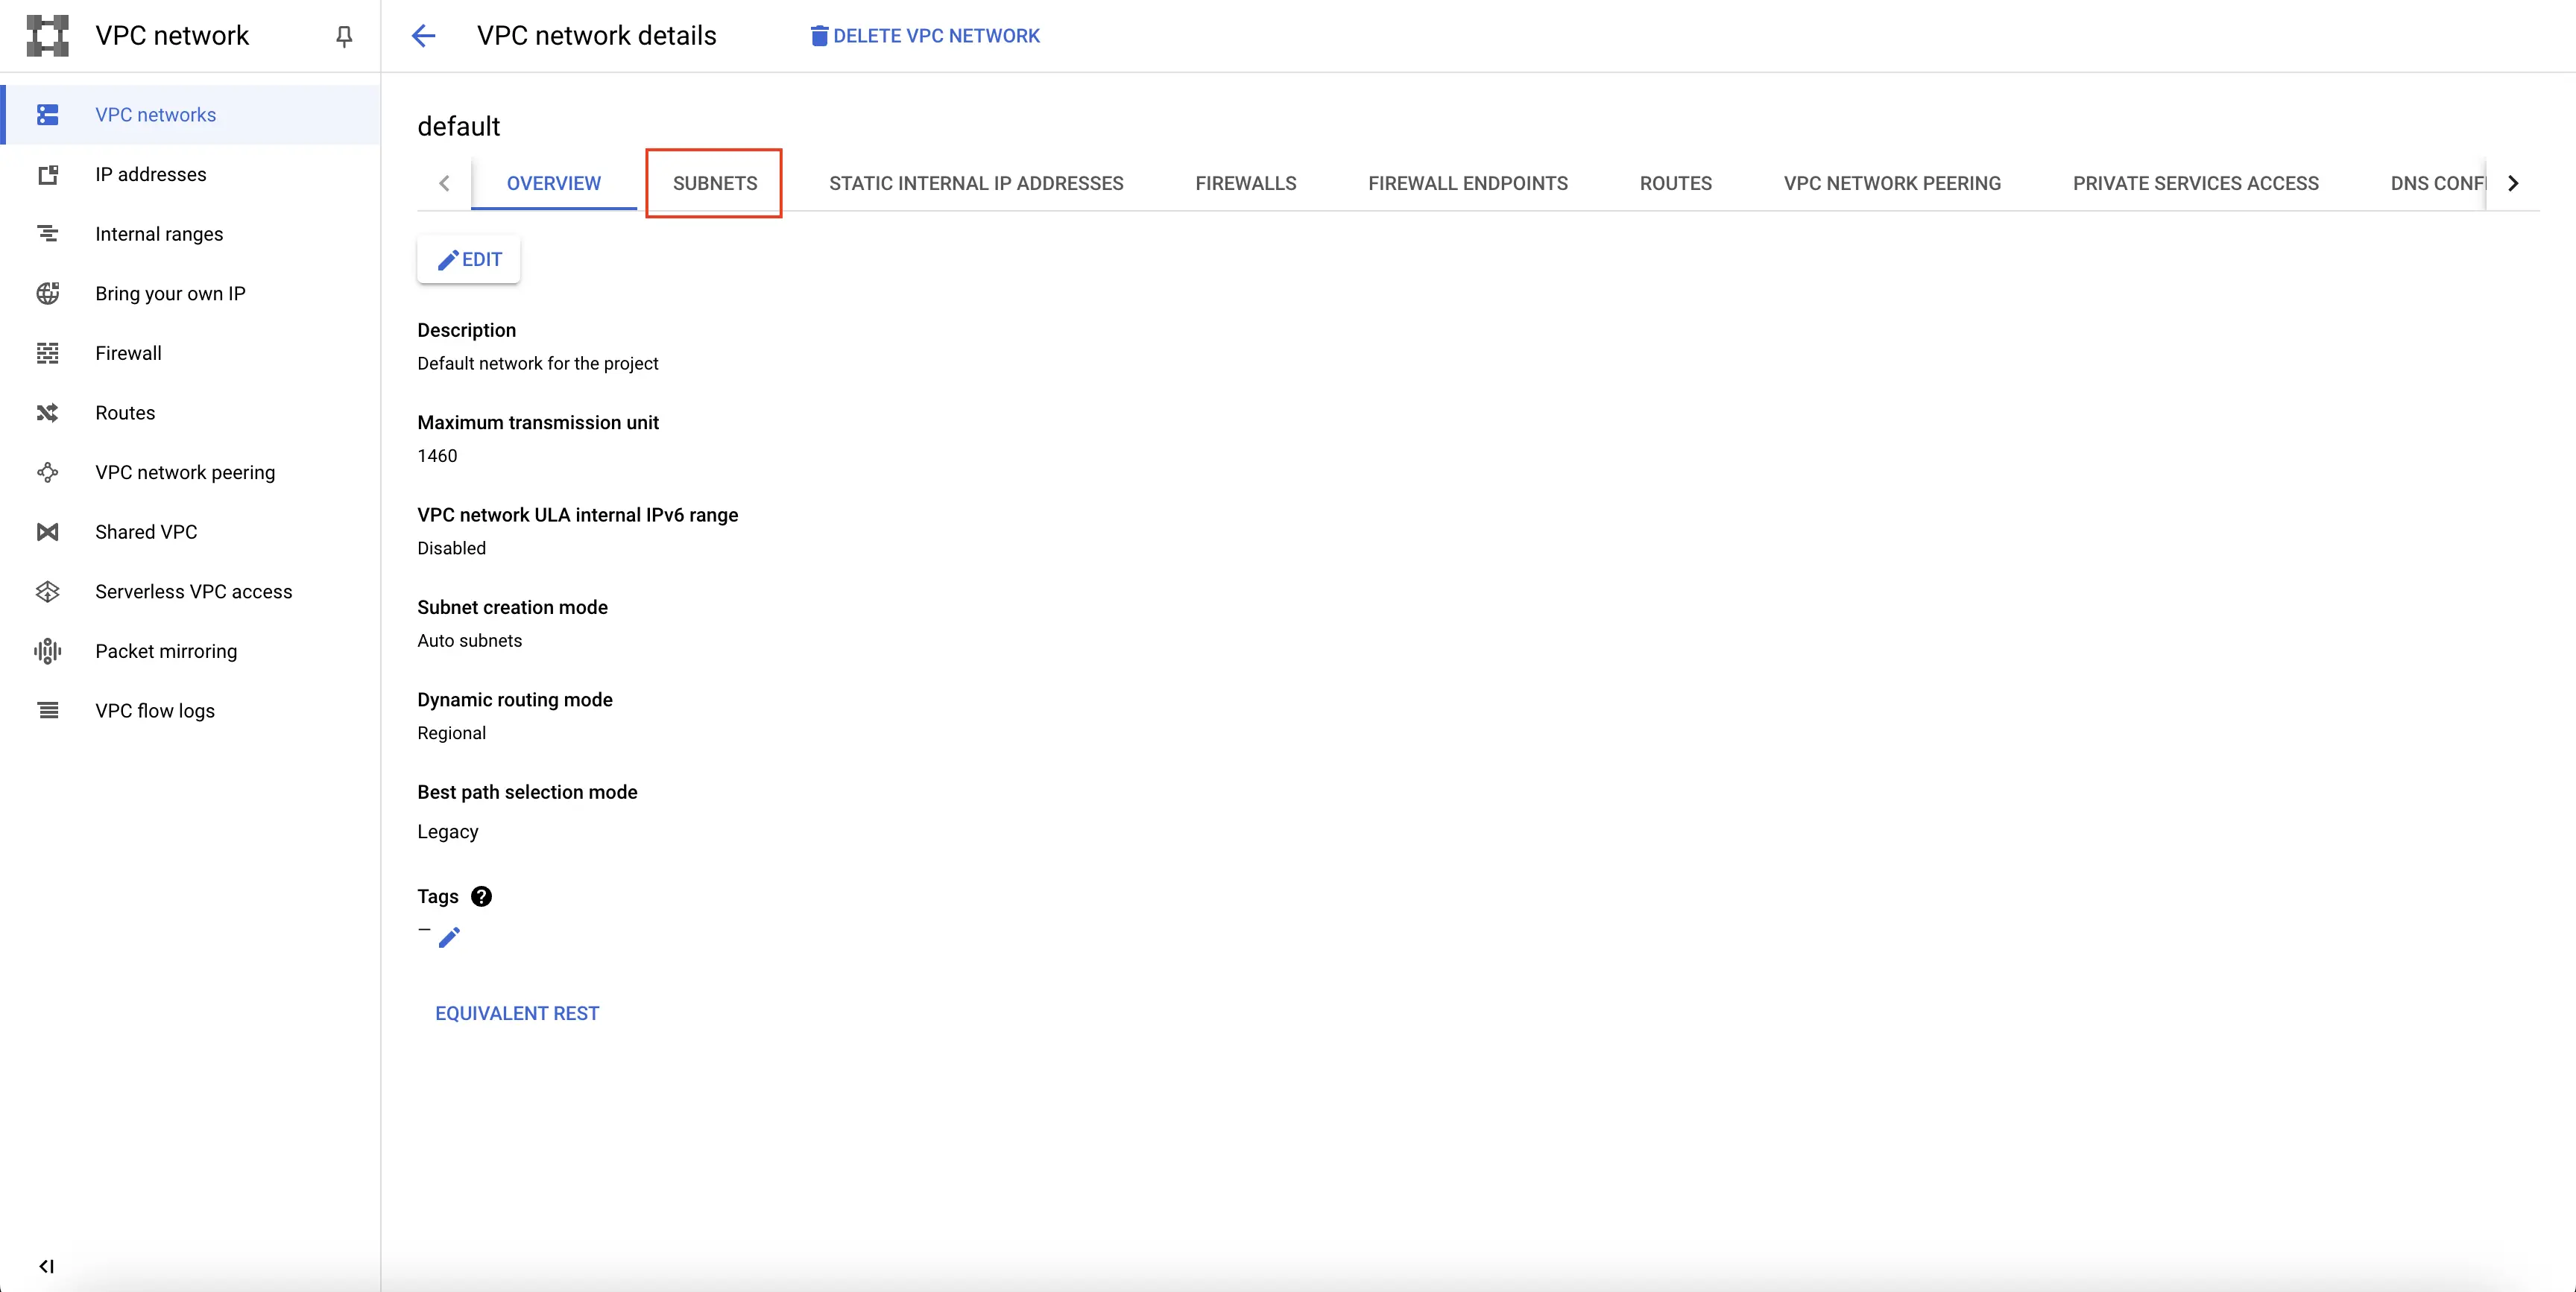
Navigate to Subnets tab
Step 4: Select EDIT on the top, and click on the On radio button under the Flow logs.
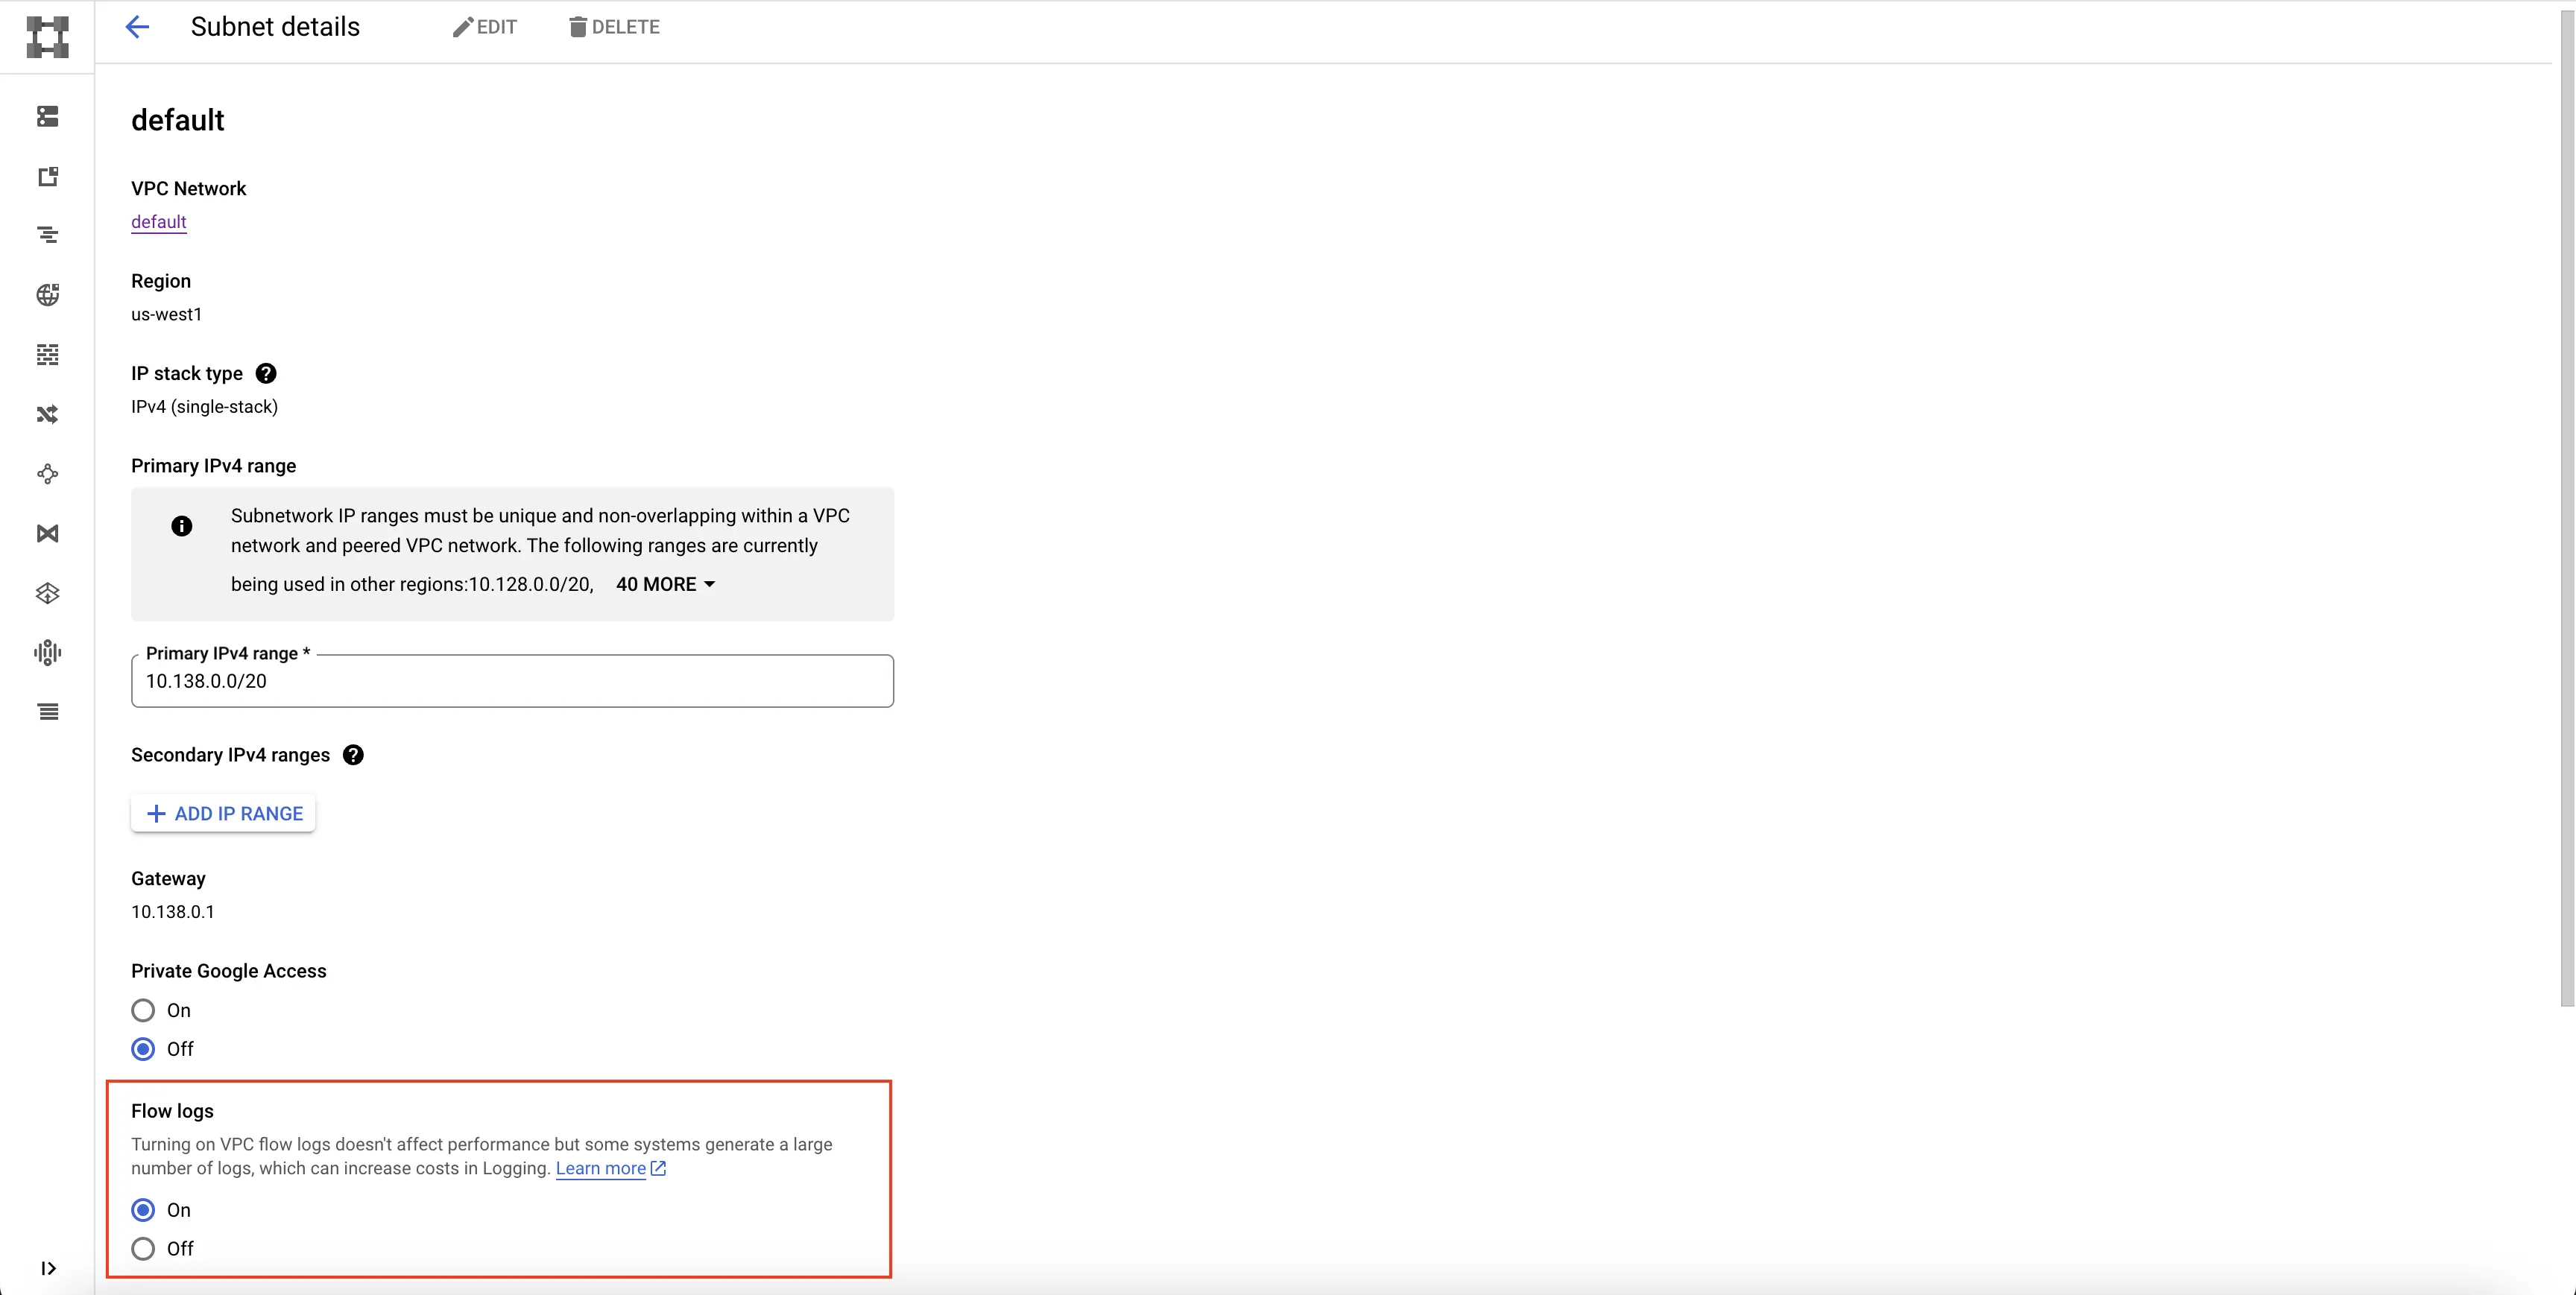
Turn on Flow Logs
Step 5: Click on SAVE. The flow logs are now enabled for the network in the corresponding region.
Create PubSub Topic
Follow the steps mentioned in the Creating Pub/Sub Topic document to create the Pub/Sub topic.
Create Log Router to Pub/Sub Topic
Follow the steps mentioned in the Log Router Setup document to create the Log Router.
To ensure you filter out only the Compute Engine logs, use the following filter conditions:
resource.type="gce_subnetwork"
Setup OTel Collector
Follow the steps mentioned in the Creating Compute Engine document to create another Compute Engine instance. We will be installing OTel Collector on this instance.
Install OTel Collector as agent
Firstly, we will establish the authentication using the following commands:
- Initialize
gcloud:
gcloud init
- Authenticate into GCP:
gcloud auth application-default login
Let us now proceed to the OTel Collector installation:
Step 1: Download otel-collector tar.gz for your architecture
wget https://github.com/open-telemetry/opentelemetry-collector-releases/releases/download/v0.116.0/otelcol-contrib_0.116.0_linux_amd64.tar.gz
Step 2: Extract otel-collector tar.gz to the otelcol-contrib folder
mkdir otelcol-contrib && tar xvzf otelcol-contrib_0.116.0_linux_amd64.tar.gz -C otelcol-contrib
Step 3: Create config.yaml in the folder otelcol-contrib with the below content in it. Replace <region> with the appropriate SigNoz Cloud region. Replace SIGNOZ_INGESTION_KEY with what is provided by SigNoz:
receivers:
  otlp:
    protocols:
      grpc:
        endpoint: 0.0.0.0:4317
      http:
        endpoint: 0.0.0.0:4318
  googlecloudpubsub:
    project: <gcp-project-id>
    subscription: projects/<gcp-project-id>/subscriptions/<pubsub-topic's-subscription>
    encoding: raw_text
processors:
  batch: {}
  resource/env:
    attributes:
    - key: deployment.environment
      value: prod # can be dev, prod, staging etc. based on your environment
      action: upsert
exporters:
  otlp:
    endpoint: "ingest.<region>.signoz.cloud:443"
    tls:
      insecure: false
    headers:
      "signoz-ingestion-key": "<SigNoz-Key>"
service:
  pipelines:
    traces:
      receivers: [otlp]
      processors: [batch]
      exporters: [otlp]
    metrics:
      receivers: [otlp]
      processors: [batch]
      exporters: [otlp]
    logs:
      receivers: [otlp, googlecloudpubsub]
      processors: [batch, resource/env]
      exporters: [otlp]
Step 4: Once we are done with the above configurations, we can now run the collector service with the following command:
From the otelcol-contrib, run the following command:
./otelcol-contrib --config ./config.yaml
Run in background
If you want to run OTel Collector process in the background:
./otelcol-contrib --config ./config.yaml &> otelcol-output.log & echo "$!" > otel-pid
The above command sends the output of the otel-collector to otelcol-output.log file and prints the process id of the background running OTel Collector process to the otel-pid file.
If you want to see the output of the logs you’ve just set up for the background process, you may look it up with:
tail -f -n 50 otelcol-output.log
Visualize the Logs obtained by OpenTelemetry in SigNoz Cloud
You can now visualize the logs corresponding to the traffic being sent on this VPC network.
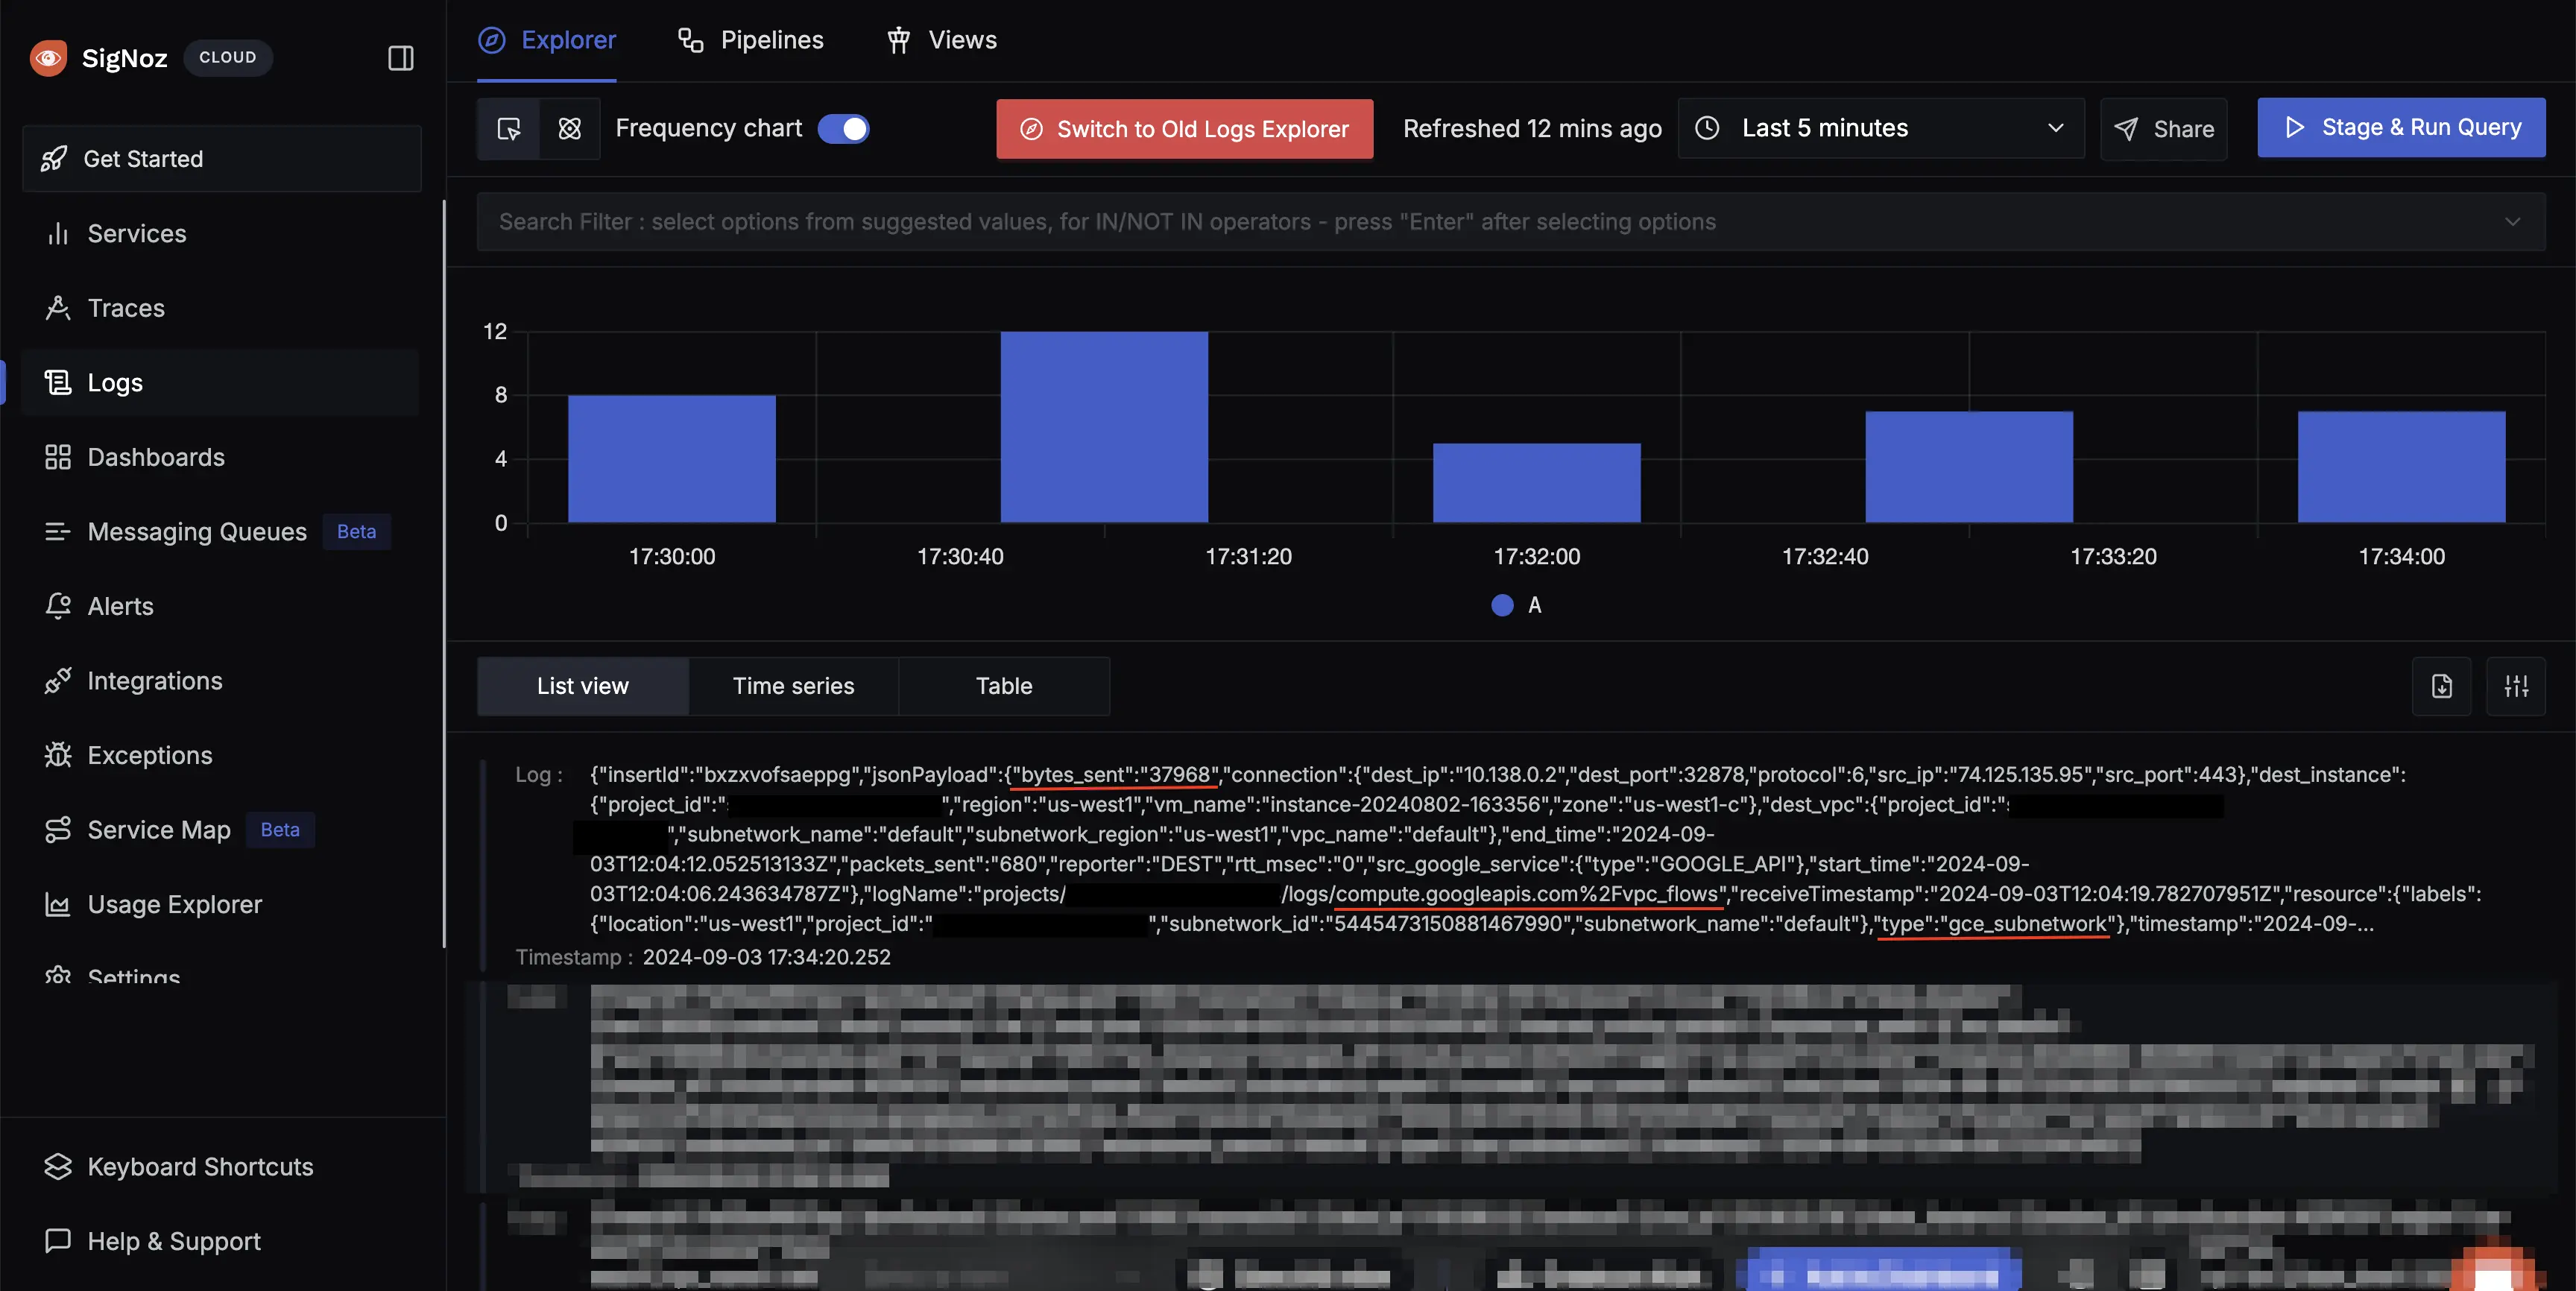
Network Logs
Last updated: August 27, 2024
