WordPress OpenTelemetry Instrumentation
This document explains how to instrument an existing WordPress installation with OpenTelemetry and send traces to SigNoz using OpenTelemetry collector.

Prerequisites
You will need the following in place before moving on to the next step:
- A self-managed WordPress site
- Permissions on the hosting server to install packages (Admin/Sudo)
- PHP 8.0+ / PHP 8.1+ if you want to use Protocols Buffers (Protobuf)
- PECL
- Composer
Setup
The following steps demonstrate how to instrument a WordPress site running on a Linux host with OpenTelemetry and then send the traces to SigNoz Cloud.
You'll need to perform tasks such as building the OpenTelemetry extension from source, modifying the php.ini file, and restarting services that may temporarily affect your website's availability.
Step 1: Build and enable the OpenTelemetry PHP extension
Start by installing the necessary build tools. You will also need the php-pear (for PECL) and php-dev packages for building and installing the extension. You can do this by running the following commands:
sudo apt install gcc make autoconf
sudo apt install php-pear php-dev
Next, install the OpenTelemetry PHP extension using pecl. Run the following command to do so:
sudo pecl install opentelemetry
This will download the OpenTelemetry extension and its dependencies, compile them, and install them on the server in the default php extensions folder. You may want to make a note of the path where the extensions were installed if needed for the php.ini configuration.
Finally, you must enable the OpenTelemetry extension. You will not be able to install the OpenTelemetry extensions using composer later if it is not enabled in PHP. To do so add the following line to your php.ini file:
[opentelemetry]
extension=opentelemetry.so
Ensure to modify the correct php.ini file that is being used by PHP.
Finally, verify that the extensions are enabled by running the following command:
php -m | grep opentelemetry
If the extensions are installed correctly, you should see opentelemetry in the output.
If php -m output is empty, try restarting the web server or if you are using PHP-FPM with NGINX, try restarting the php-fpm service.
Step 2: Add OpenTelemetry SDK and other dependencies
In this step, you will use Composer to add OpenTelemetry SDK and other dependencies such as the OTLP Exporter and the OpenTelemetry auto-instrumentation for Wordpress package for automatic instrumentation in WordPress.
Navigate to root directory
Start by navigating to the root directory of your WordPress installation. This is usually the directory where wp-config.php is located. For example, if your WordPress installation is located at /var/www/html/wordpress, run the following command:
cd /var/www/html/wordpress
Initialise composer project
If you are running WordPress using Composer, you can skip this step as composer would be already initialized. Run the following command to initialize a new Composer project:
composer init
You will be prompted to enter some information about the project. You can skip most of the prompts but make sure to set the name and description fields. This will create a new composer.json file in the root directory of your WordPress installation.
Add dependencies
Once the composer.json file is created, you will need to add the OpenTelemetry SDK and other packages. You can install them by running the following command in the root directory of your WordPress installation, i.e., /var/www/html/wordpress in this example:
composer require \
    open-telemetry/sdk \
    open-telemetry/exporter-otlp \
    open-telemetry/opentelemetry-auto-wordpress
Press y to any prompts during the installation process.
This will add the core OpenTelemetry SDK for PHP, the OTLP exporter for sending data to SigNoz, HTTP client libraries for communication, and the WordPress auto-instrumentation package to automatically capture WordPress operations.
The composer.json file should now include the packages you just installed. It should look something like the code snippt below both in the case of a new composer project and existing, with an existing project having additional dependencies and configurations.
{
    "name": "wordpress/opentelemetry-signoz", // This is the name of the composer project.
    "require": {
        "open-telemetry/sdk": "^1.2",
        "open-telemetry/exporter-otlp": "^1.2",
        "symfony/http-client": "^6.4",
        "nyholm/psr7": "^1.8",
        "open-telemetry/opentelemetry-auto-wordpress": "^0.0.17"
    },
    "config": {
        "allow-plugins": {
            "php-http/discovery": true,
            "tbachert/spi": true
        }
    }
}
The versions of the packages may be different at the time of installation as they keep changing. The above versions are what's current as of this writing.
Step 3: Install and configure the OpenTelemetry Collector
In this step, you will install the OpenTelemetry collector on the WordPress host. The collector acts as a middleware component that:
- Receives traces from your instrumented WordPress application
- Processes and batches the telemetry data efficiently
- Forwards the data to SigNoz using the OpenTelemetry Protocol (OTLP)
Install OpenTelemetry Collector
To install the OpenTelemetry collector, run the following command (this example is for Ubuntu):
wget https://github.com/open-telemetry/opentelemetry-collector-releases/releases/download/v0.125.0/otelcol_0.125.0_linux_amd64.deb
sudo dpkg -i otelcol_0.125.0_linux_amd64.deb
Verify that the collector is running with the following command:
sudo systemctl status otelcol
For a different Linux OS or architecture, you can find the correct collector binary in the OpenTelemetry Collector releases. For more information, refer to this documentation.
Configure OpenTelemetry collector Next, you will configure OpenTelemetry collector to send the traces to SigNoz. To do this, you will modify the default configuration file located at /etc/otelcol/config.yaml.
Open the file in your favorite text editor and replace its contents with the following configuration depending on whether you are using SigNoz Cloud or self-hosted SigNoz.
receivers:
  otlp:
    protocols:
      http:
        endpoint: localhost:4318 # Change this to the endpoint where your OpenTelemetry collector is running

processors:
  batch:
  resource/env:
        attributes:
        - key: deployment.environment
          value: prod # can be dev, prod, staging etc. based on your environment
          action: upsert

exporters:
  otlp:
    endpoint: "ingest.<region>.signoz.cloud:443" # Retrieve the region from https://{your-signoz-url}/settings/ingestion-settings
    tls:
      insecure: false
    headers:
      "signoz-ingestion-key": "<ingestion-key>" # Retrieve the key from https://{your-signoz-url}/settings/ingestion-settings
  debug:
    verbosity: detailed

service:

  pipelines:
    traces:
      receivers: [otlp]
      processors: [batch, resource/env]
      exporters: [otlp]

    metrics:
      receivers: [otlp]
      processors: [batch]
      exporters: [otlp]

    logs:
      receivers: [otlp]
      processors: [batch]
      exporters: [otlp]
Remember to replace the placeholders <self-hosted-SigNoz-IP> with the IP of your self-hosted SigNoz instance.
Finally, restart the OpenTelemetry collector to apply the changes:
sudo systemctl restart otelcol
Step 4: Configure PHP with OpenTelemetry settings
In this step, you will configure PHP with OpenTelemetry settings. You will also add a prepend file to initialize composer.
Let's start with adding the following OpenTelemetry environment variables to the php.ini file.
Open the php.ini file in your favorite text editor and add the following lines:
OTEL_PHP_AUTOLOAD_ENABLED="true"
OTEL_SERVICE_NAME=<service-name>
OTEL_TRACES_EXPORTER=otlp
OTEL_EXPORTER_OTLP_PROTOCOL=http/protobuf
OTEL_EXPORTER_OTLP_ENDPOINT=http://localhost:4318
OTEL_PROPAGATORS=baggage,tracecontext
A quick note on some of these values:
<service-name>is the name of your service, which will be used to identify your service in SigNoz.http://localhost:4318is the endpoint where OpenTelemetry collector is running, which in this example is the same host. Port 4318 is the default port for http protocol.
For more information on these environment variables, refer to the OpenTelemetry PHP Configuration documentation.
Add a prepend file
To add a prepend file, you will use the auto_prepend_file directive in php.ini that allows you to specify a file to be executed before any other PHP files are run. This is useful for initializing the OpenTelemetry SDK and other dependencies.
Modify the auto_prepend_file value to point to the vendor/autoload.php file that was created by Composer.
Write the absolute path.
For example:
auto_prepend_file=/var/www/html/wordpress/vendor/autoload.php
Now, restart the web server or PHP-FPM service to apply the configuration changes.
Step 5: Verify the Service and Traces in SigNoz
Login to your SigNoz instance and navigate to the Services section.
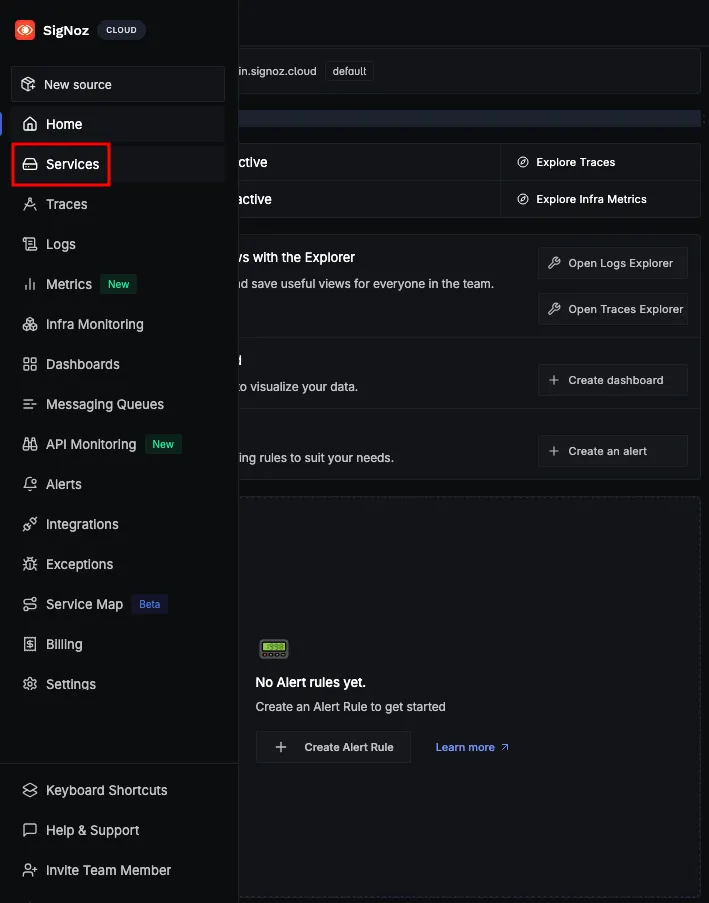
You should see the service name you specified earlier, click on it to view the RED metrics.
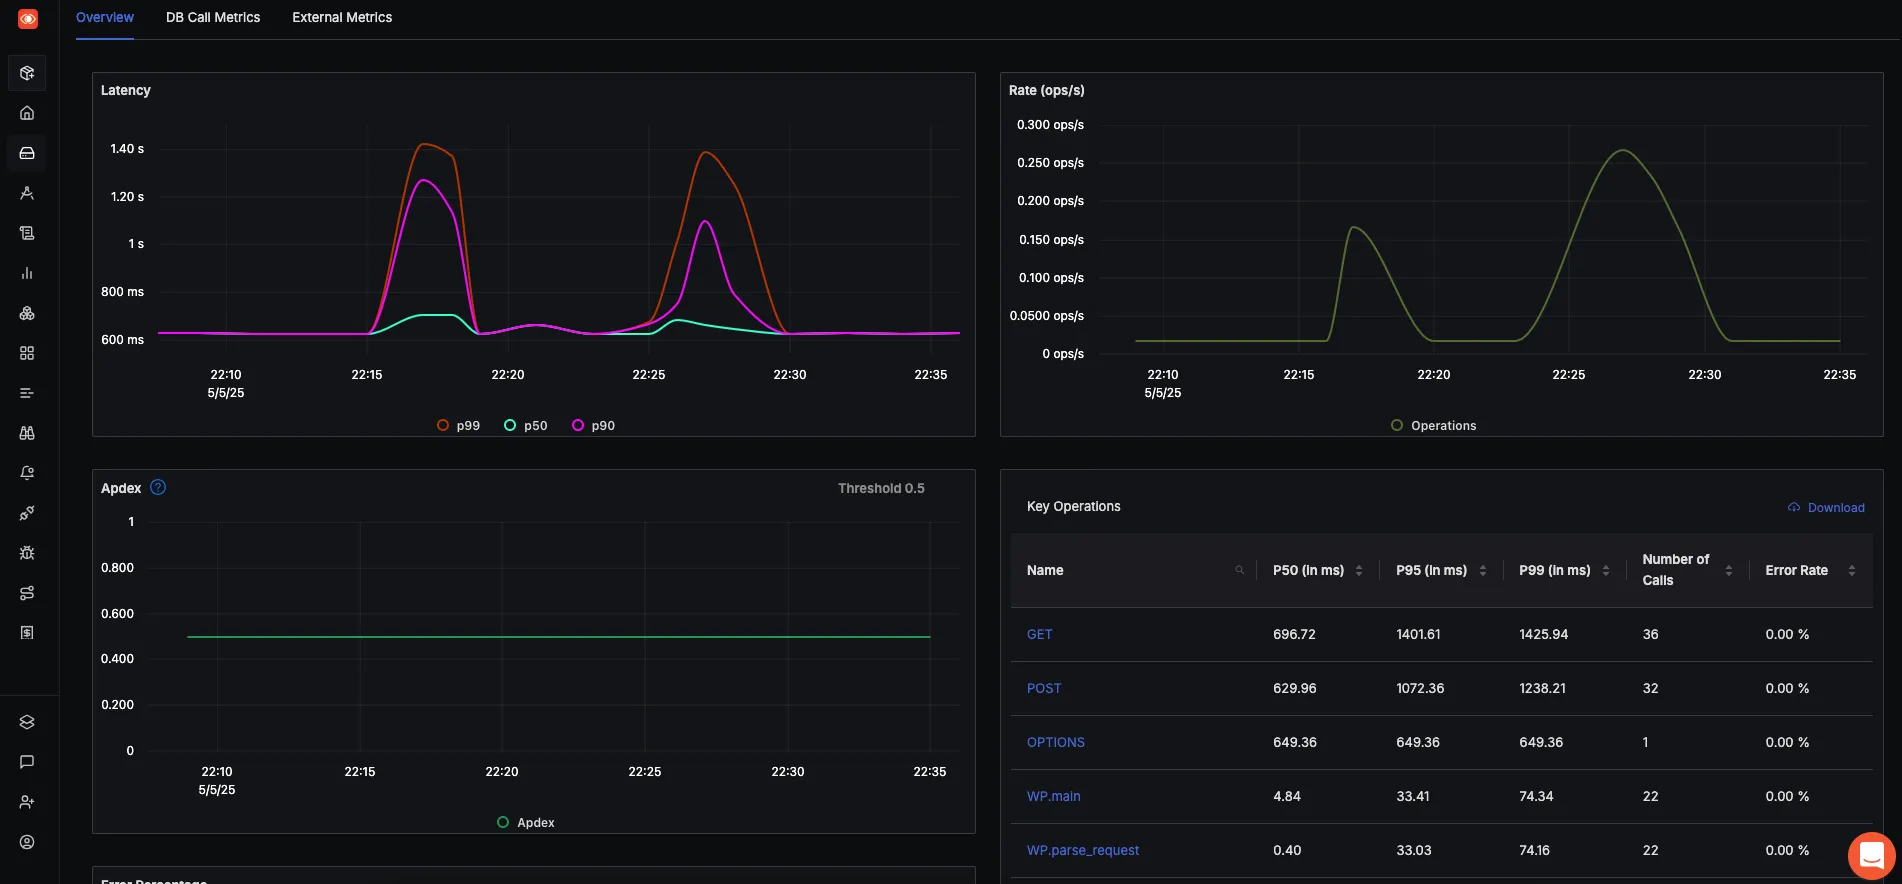
Make a few operations in the WordPress website to see the traces in SigNoz. You can do this by visiting different pages on your WordPress site, creating posts, or performing other actions.
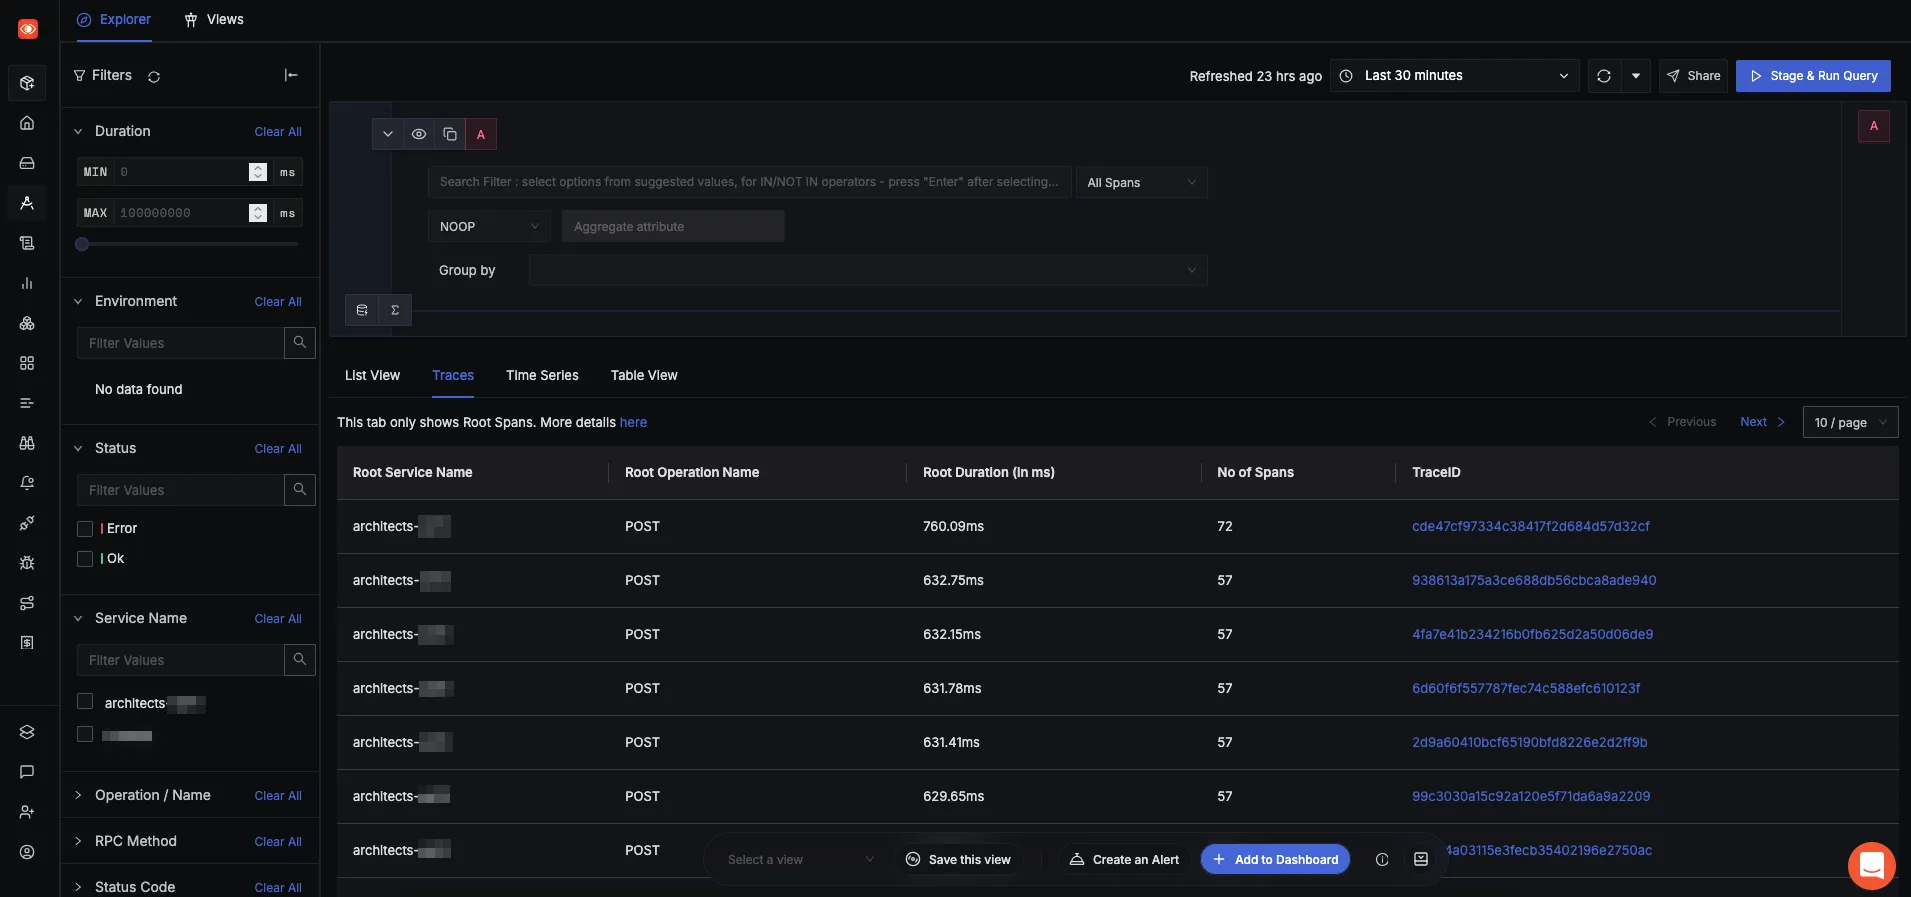
Next, navigate to the Traces section in SigNoz to view the traces. You should see traces being generated for the operations you performed on your WordPress site.
Last updated: May 5, 2025
