Get Started - APM and Distributed Tracing
SigNoz APM natively instruments your applications via OpenTelemetry, offering out-of-the-box service dependency maps, p99 latency and error-rate dashboards, and full trace-level visibility to rapidly pinpoint and resolve performance bottlenecks.
Quick Start
We recommend kicking off with our guided onboarding on SigNoz Cloud, no local install required. You'll be walked through instrumenting your app, sending your first traces, and exploring your data in minutes.
Supported Languages & Frameworks
SigNoz provides simple OpenTelemetry-based instrumentation guides for the following languages and frameworks:
UI Walkthrough
Services
After you send your first telemetry, head to the Services tab. Refresh to see each instrumented service listed with real-time metrics—throughput, latency, and error rate—and view the interactive service-dependency map.
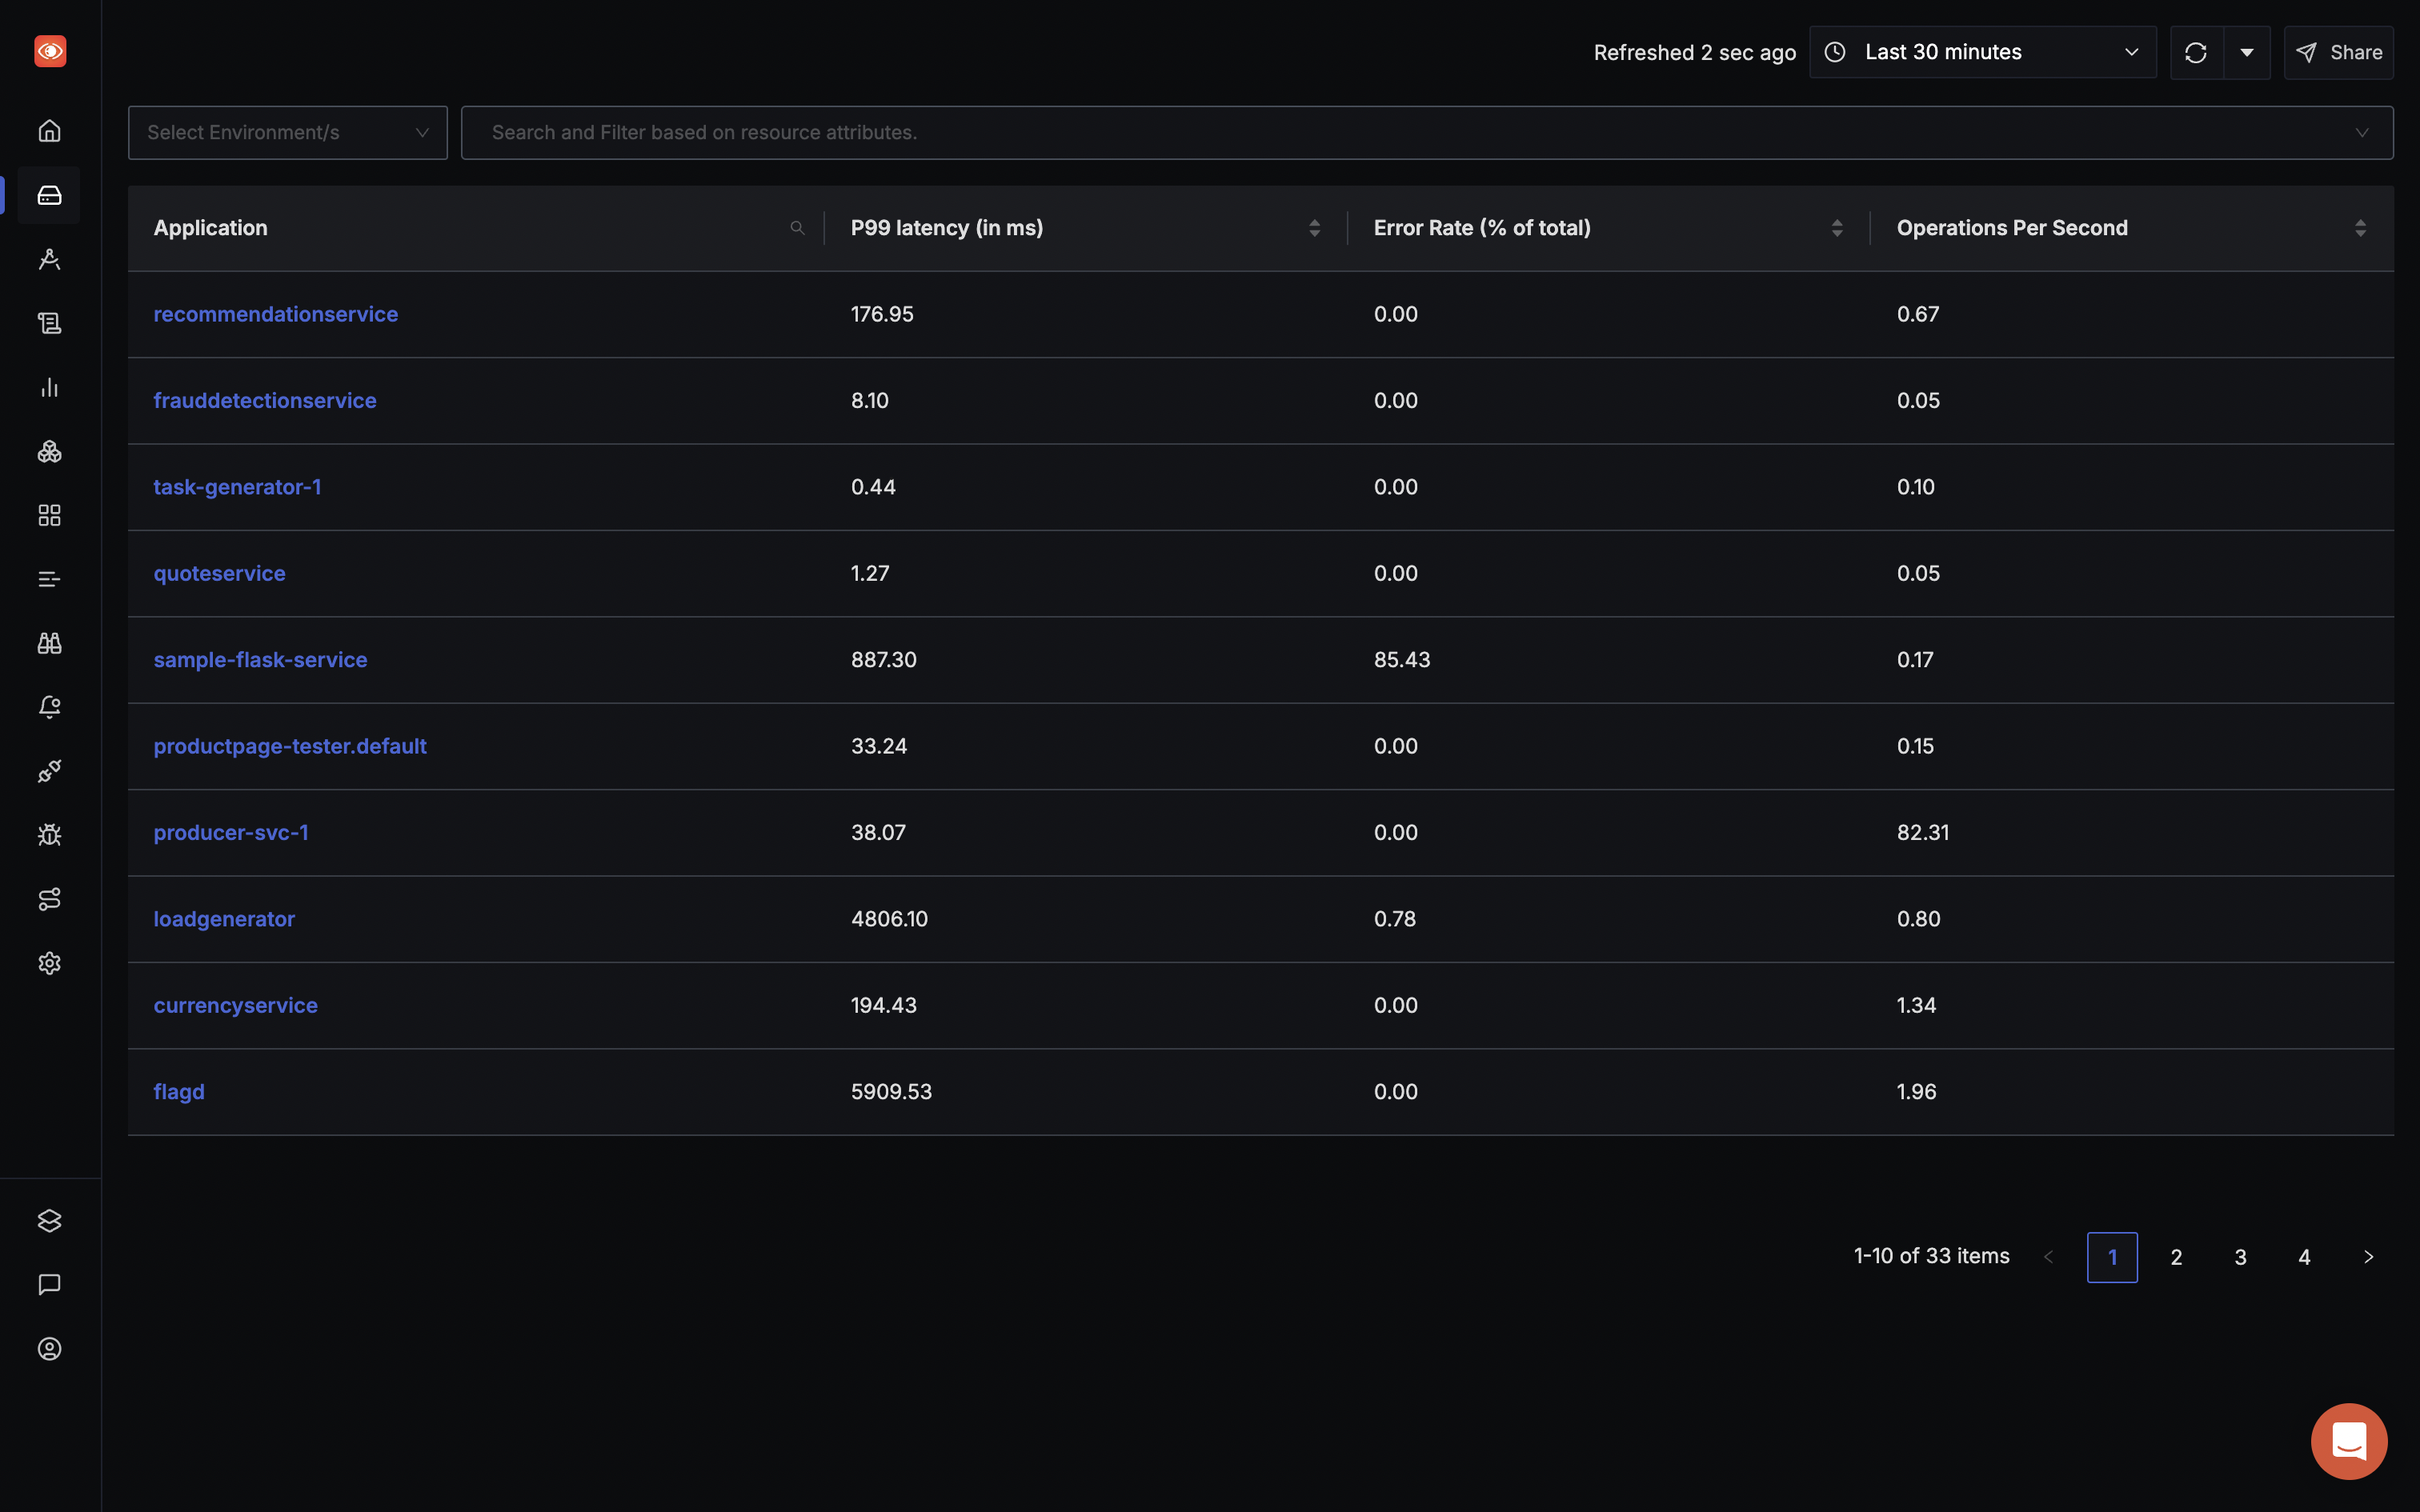
Benefits:
- Automatically discovers all instrumented services without manual configuration
- Provides immediate visibility into service health (throughput, latency, errors)
- Visualizes dependencies so you can trace cascading failures
Out of Box APM
SigNoz ships with pre-built APM dashboards showing p99 latency, error rates, Apdex scores, and operations-per-second out of the box. No dashboard-building required.
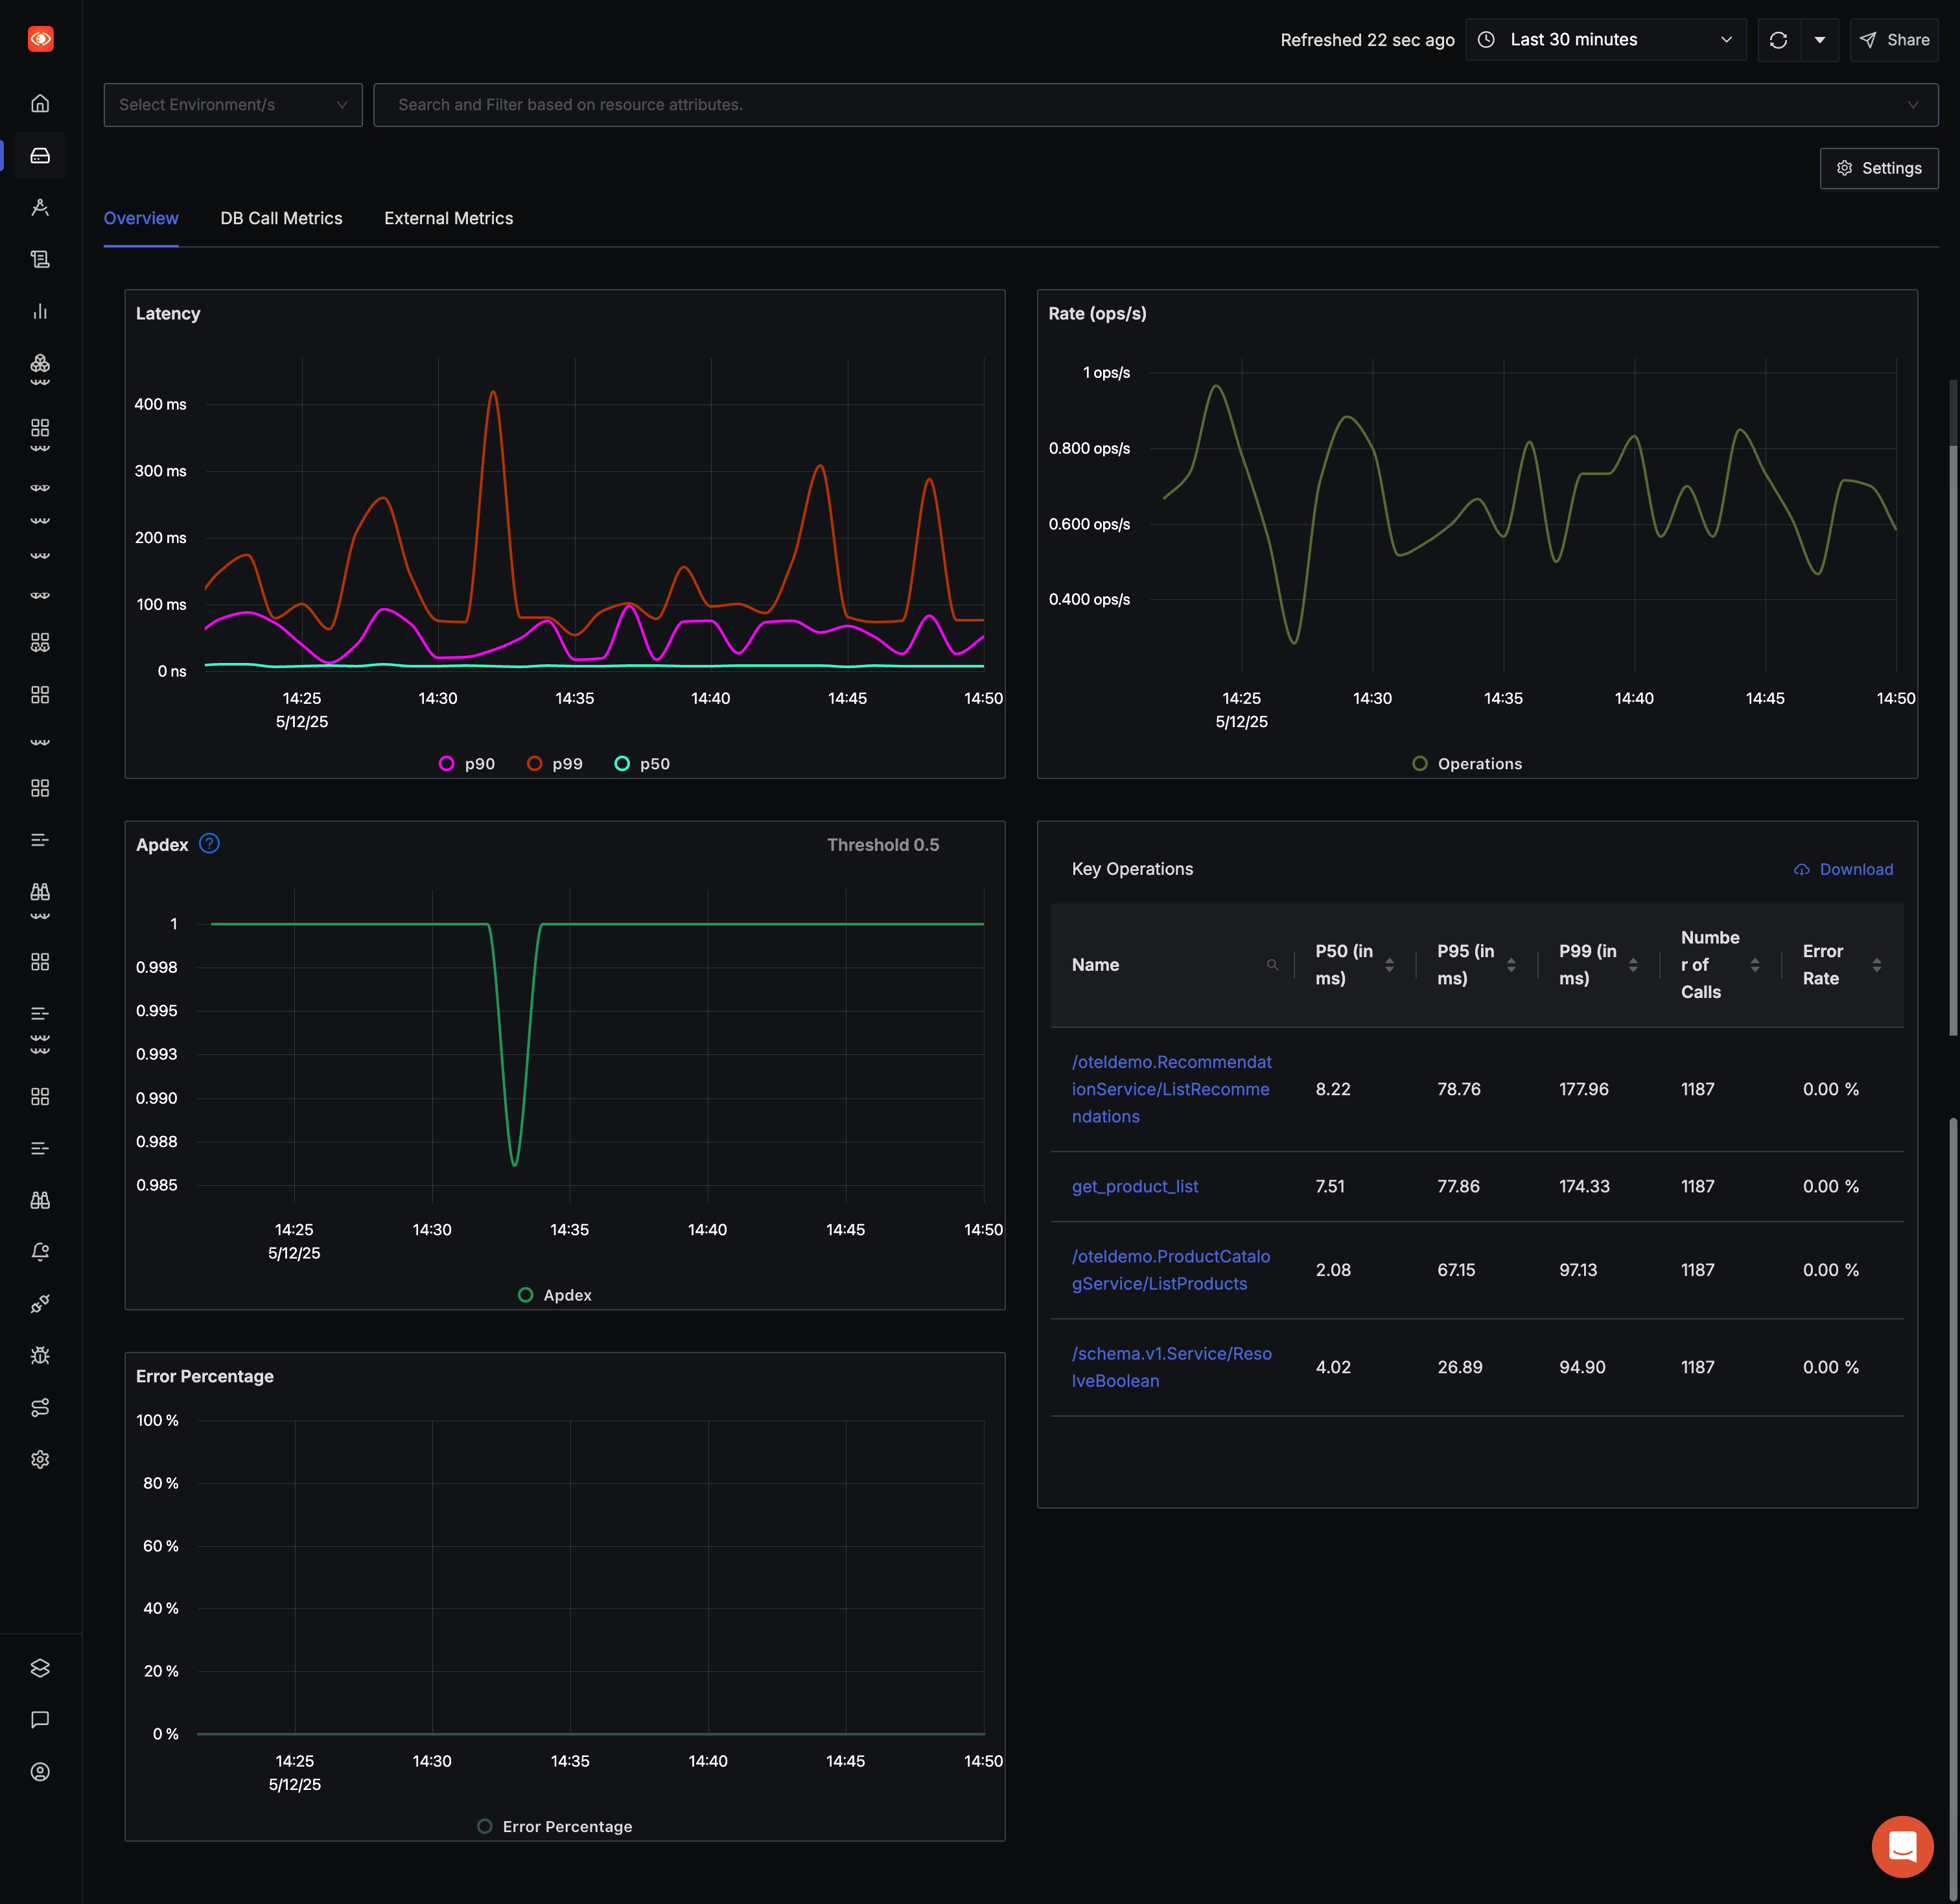
Benefits:
- Instantly track core performance KPIs without dashboard setup
- Maintain consistent metrics across all services
- Save time by leveraging standard, industry-best visualizations
DB and External Calls
Database queries and external HTTP/gRPC calls are captured as spans automatically, with aggregated call counts, latencies, and error metrics for every downstream dependency—all with zero extra code.
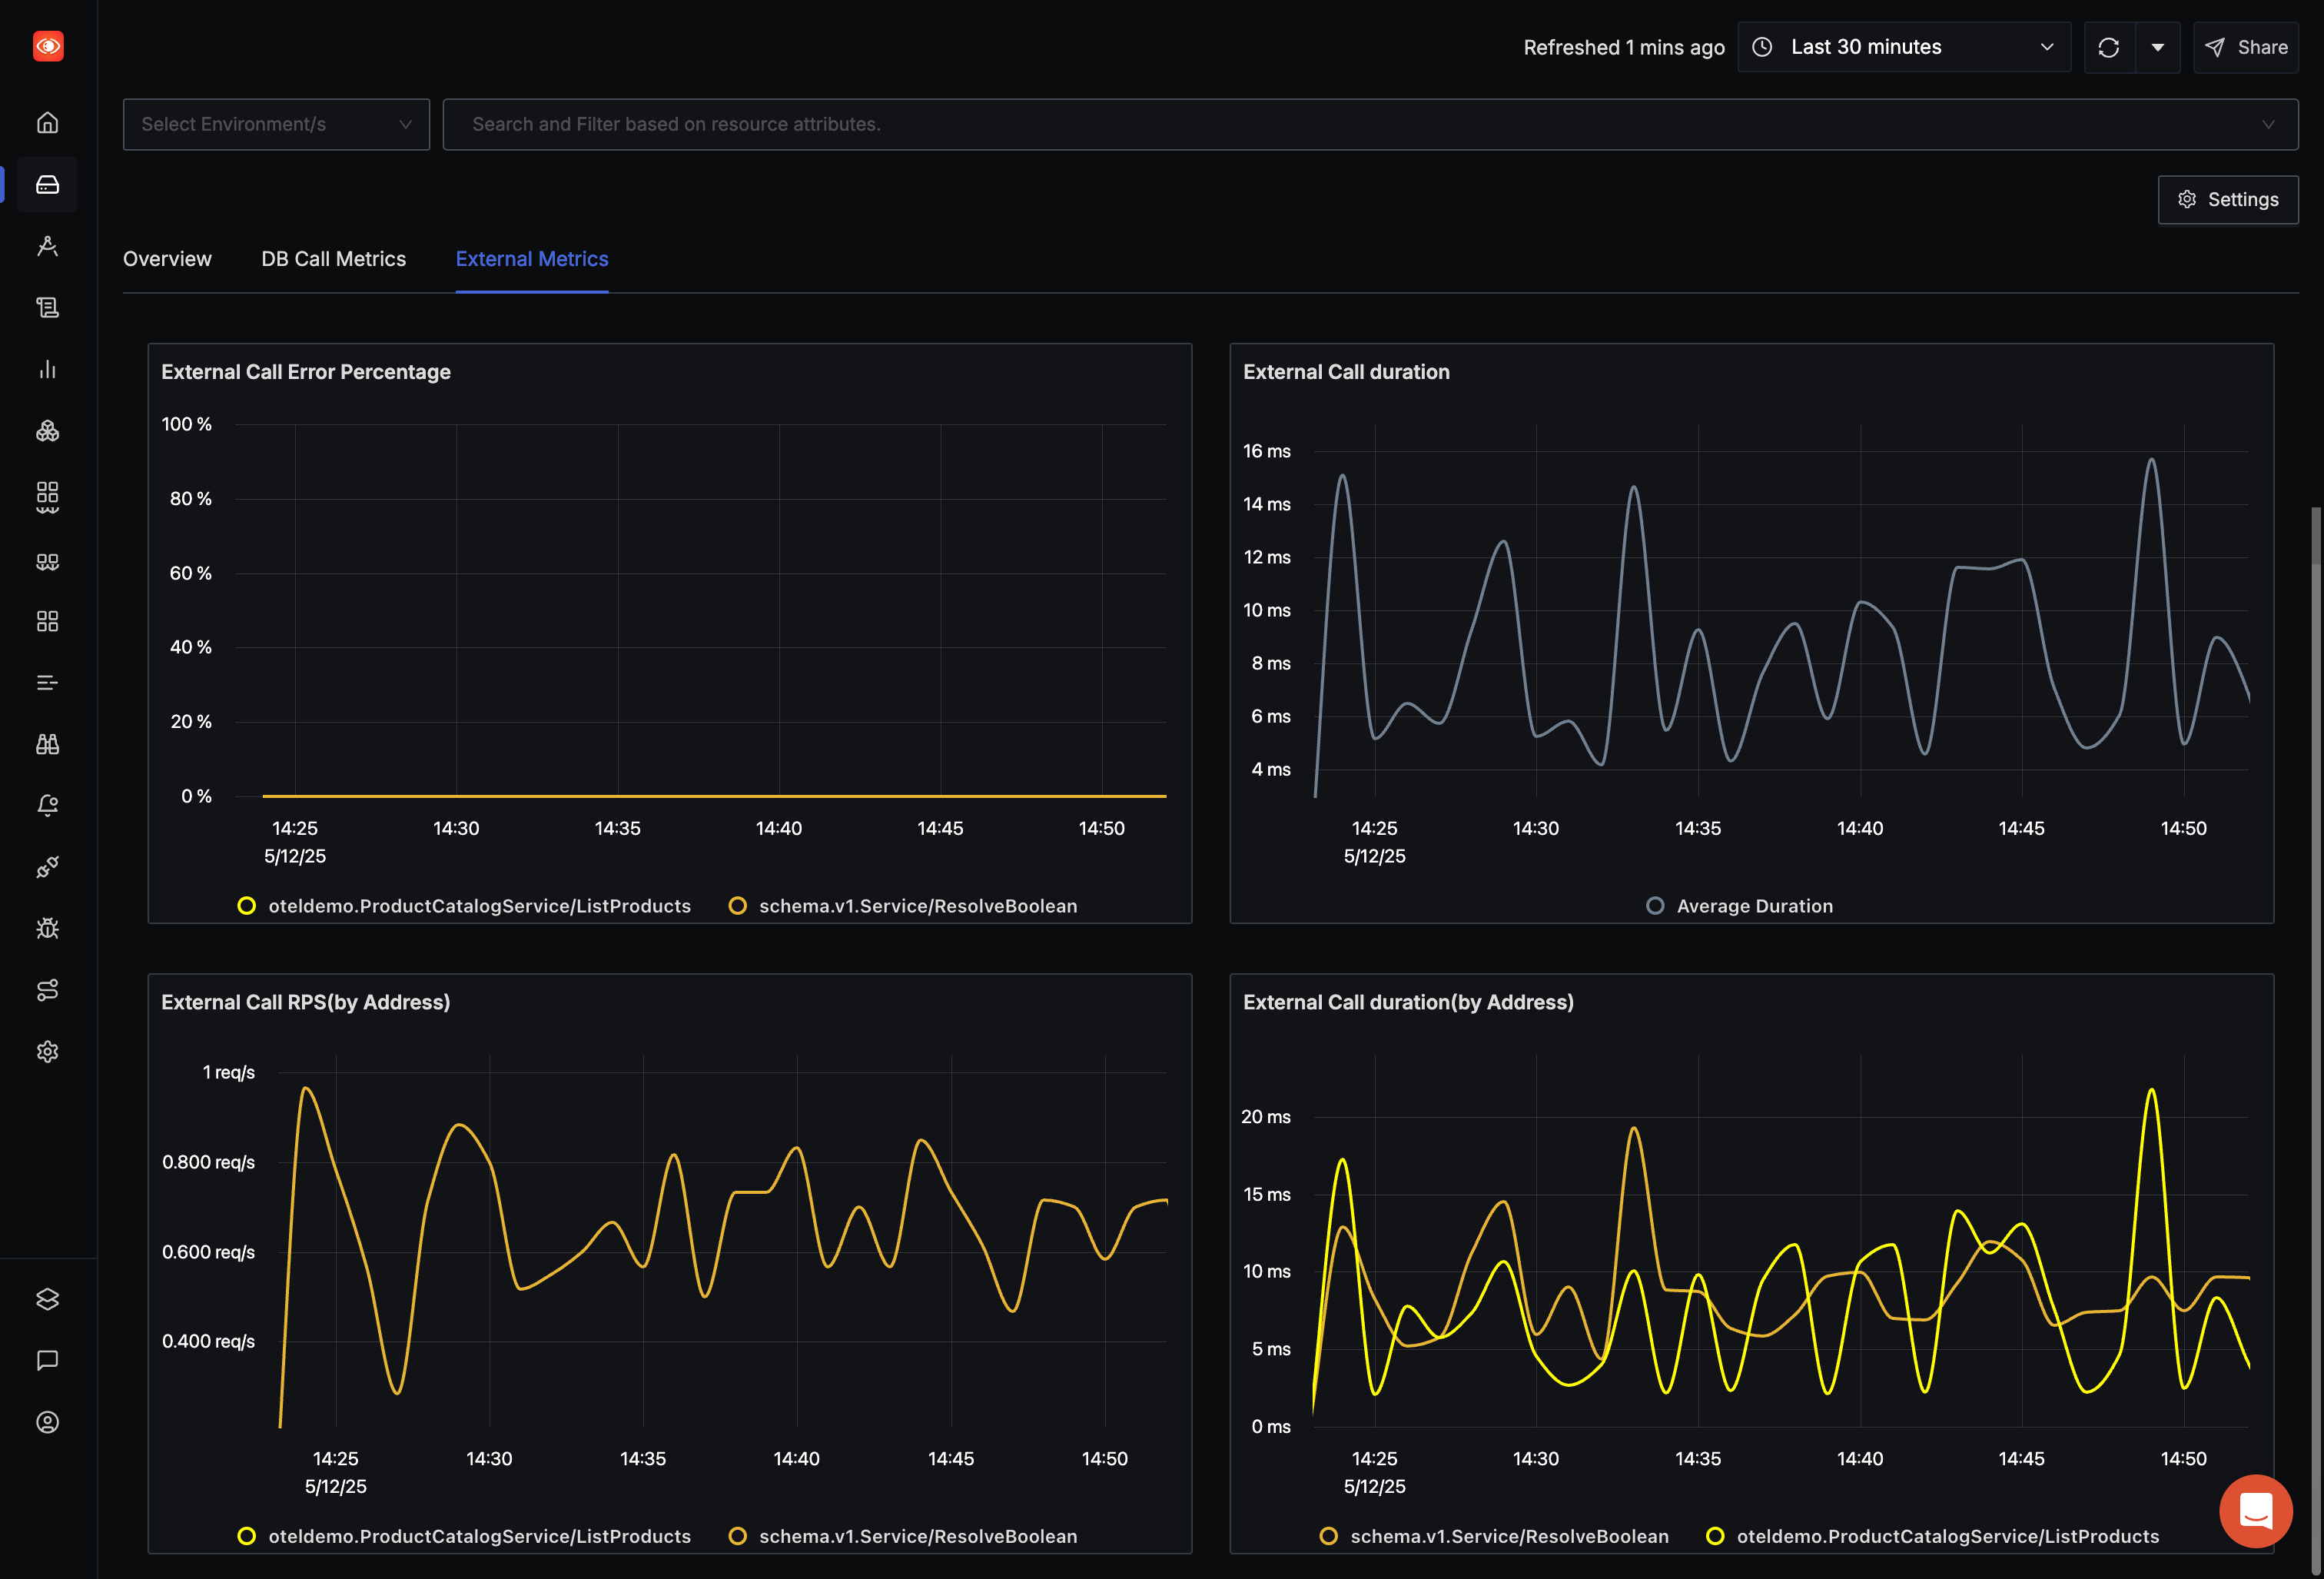
Benefits:
- Gain end-to-end visibility of downstream dependencies
- Identify slow or failing database/external calls at a glance
- Eliminate manual span instrumentation
Traces
Drill into individual requests in the Traces tab: apply attribute-based filters, run aggregate queries, and visualize the flow with flamegraphs and Gantt charts to pinpoint bottlenecks end-to-end.
SigNoz can handle traces of any size, even those with millions of spans - thanks to advanced virtualization and pagination techniques.
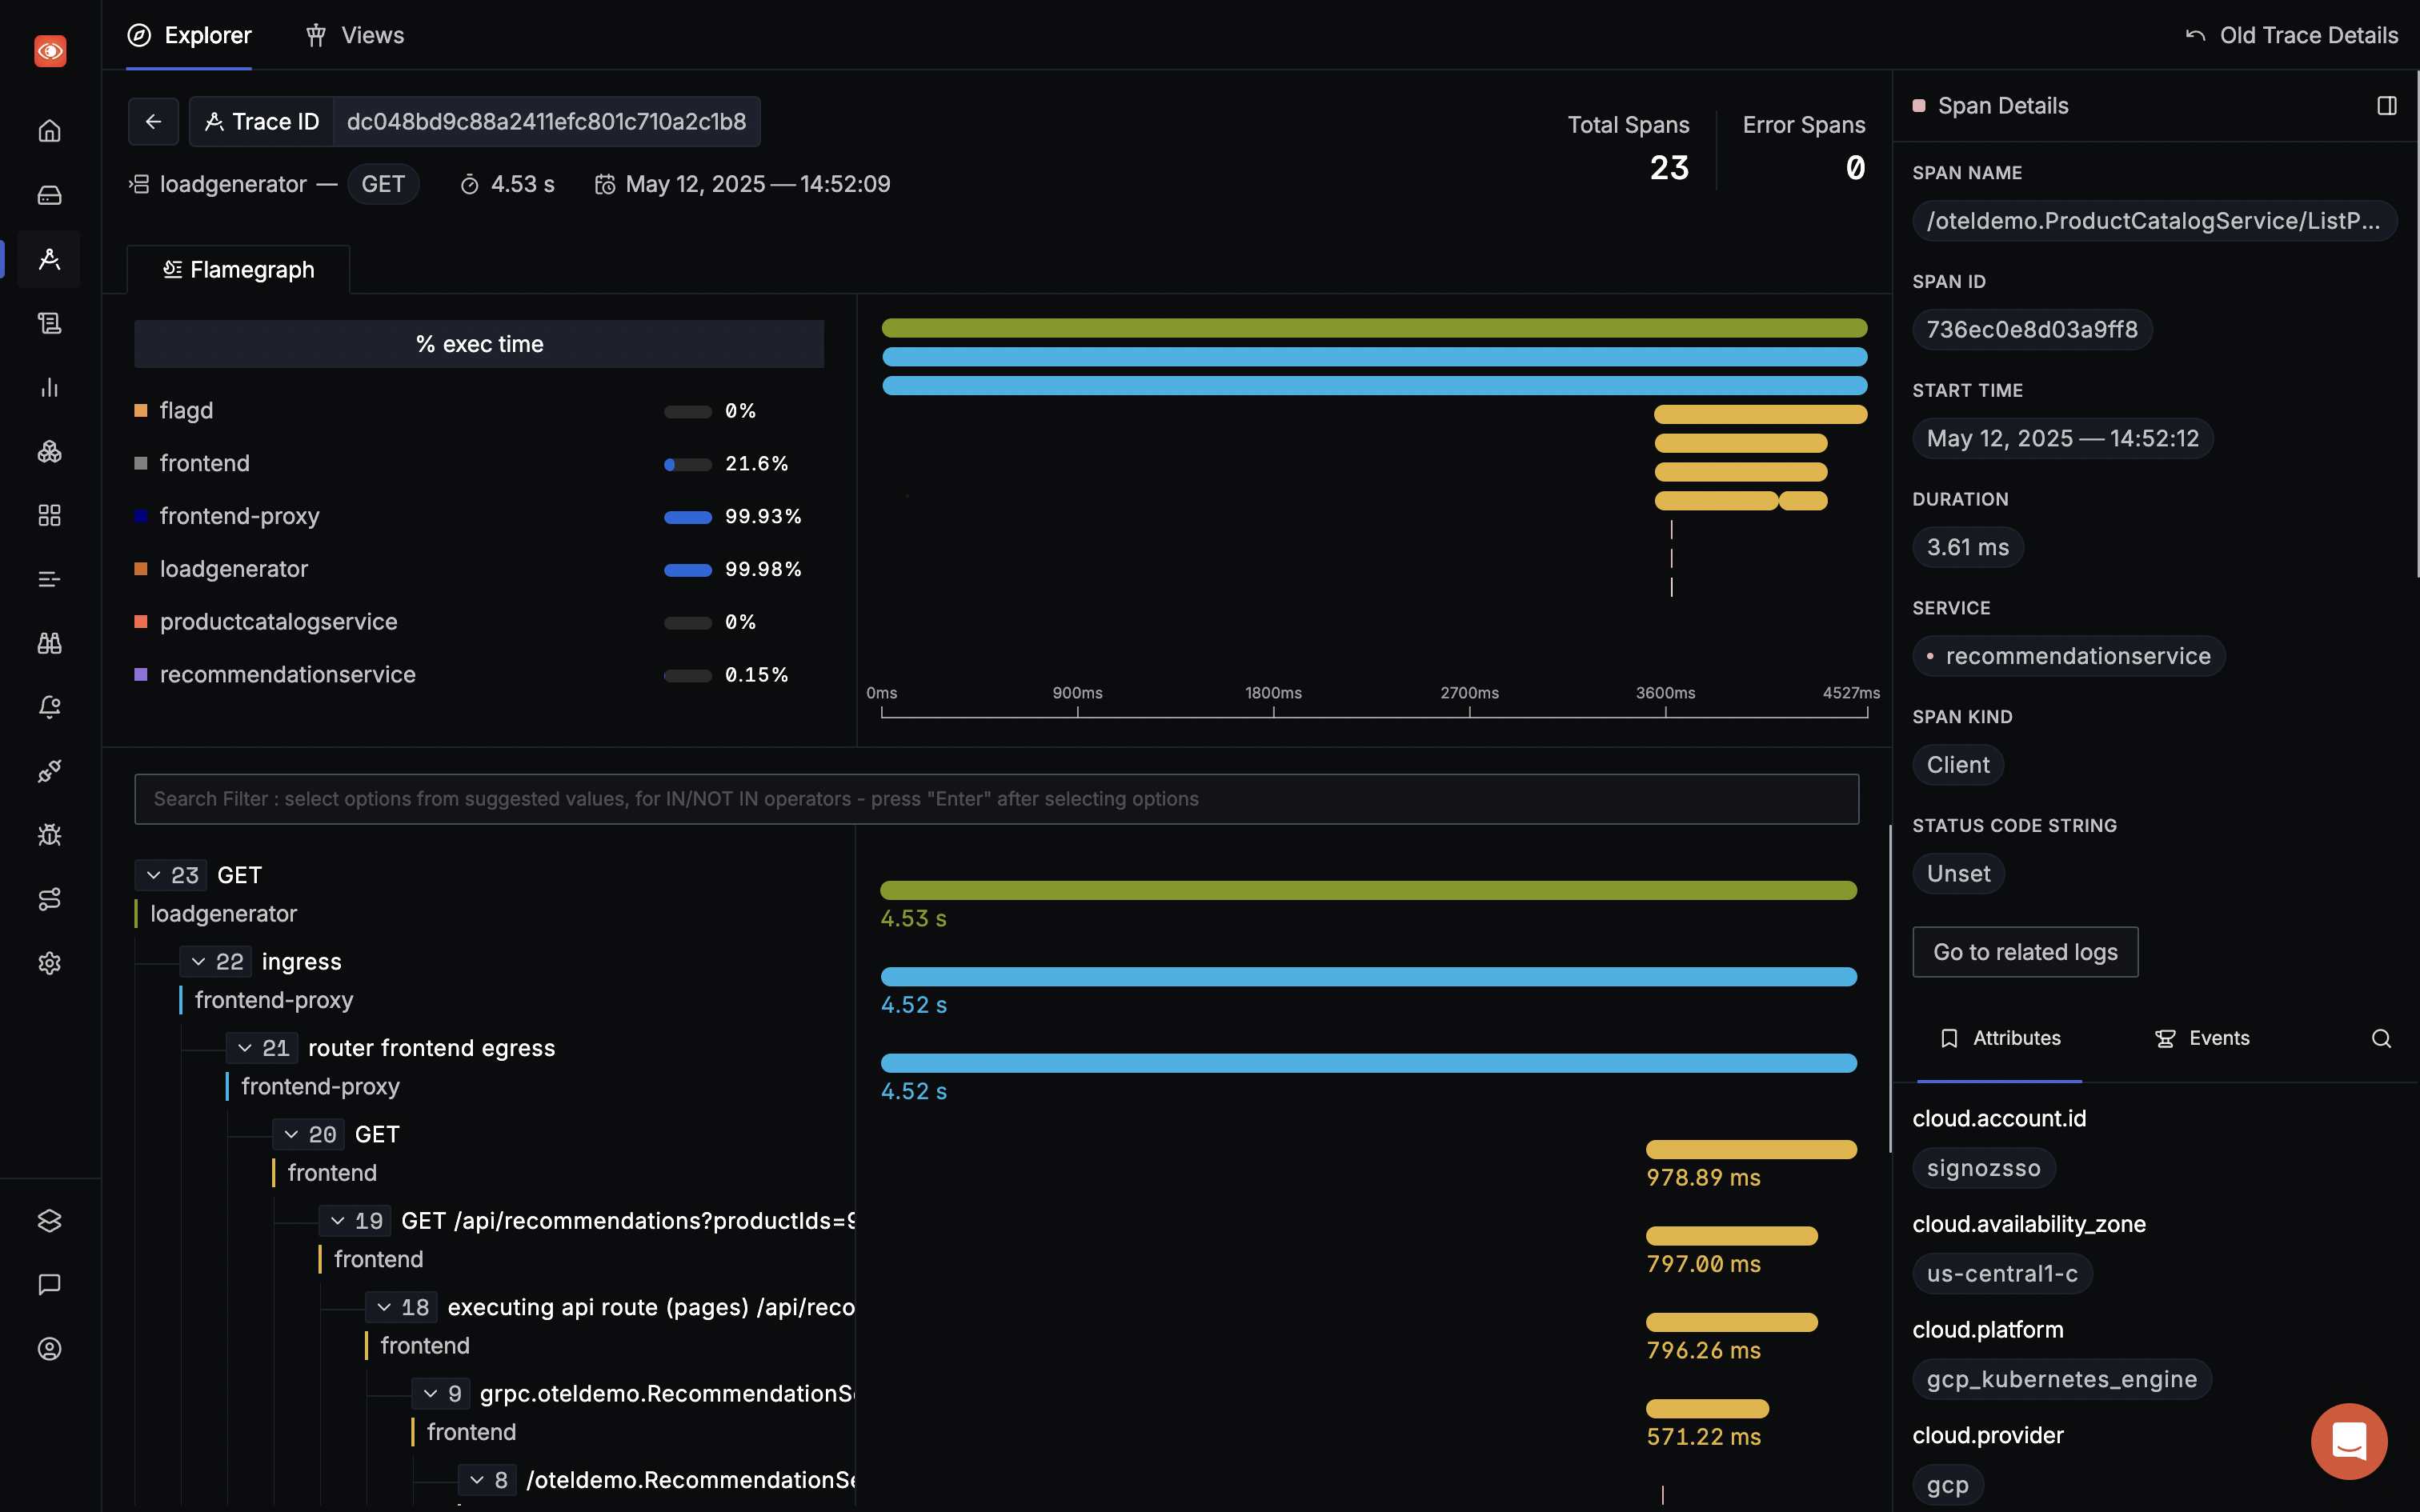
Benefits:
- Correlate spans across services to trace request paths
- Filter and aggregate traces to isolate problematic transactions
- Use flamegraphs and Gantt charts for precise latency analysis
Last updated: May 12, 2025
