Migrate Logs from New Relic
Migrating logs from New Relic to SigNoz involves reconfiguring your log collection pipeline to send data to SigNoz instead. This guide covers different approaches based on your current setup.
Understanding Log Collection Differences
Before migrating, it's important to understand the key differences between New Relic and SigNoz logs:
| Feature | New Relic | SigNoz | Notes |
|---|---|---|---|
| Collection Methods | APM agents, Infrastructure agent, Fluentd, API | OpenTelemetry Collector, FluentBit | Different collection methods |
| Query Language | NRQL, Lucene-like | ClickHouse SQL, Query Builder | Different query syntax |
| Storage | NRDB | ClickHouse | Different backend storage |
| Log Processing | Pattern detection, attribute extraction | Log pipelines, structured logging | Similar capabilities with different implementation |
Migration Approaches
1. Using OpenTelemetry Collector for Logs
The most straightforward approach is to use the OpenTelemetry Collector to collect logs directly from files, containers, or other sources.
Setting Up the OpenTelemetry Collector for Logs
- Install the OpenTelemetry Collector if not already done
- Configure log collection using the filelog receiver:
receivers:
  filelog:
    include: [ /var/log/*.log ]
    start_at: beginning
    operators:
      - type: regex_parser
        regex: '^(?P<time>\d{4}-\d{2}-\d{2} \d{2}:\d{2}:\d{2}) (?P<severity>[A-Z]*) (?P<message>.*)$'
        timestamp:
          parse_from: attributes.time
          layout: '2006-01-02 15:04:05'
- Add the receiver to your logs pipeline:
service:
  pipelines:
    logs:
      receivers: [filelog]
      processors: [batch]
      exporters: [otlp]
- Configure the exporter to send logs to SigNoz:
exporters:
  otlp:
    # For SigNoz Cloud
    endpoint: "ingest.{region}.signoz.cloud:443"
    headers:
      "signoz-ingestion-key": "<your-ingestion-key>"
    tls:
      insecure: false

    # For Self-hosted SigNoz
    # endpoint: "<signoz-otel-collector>:4317"
    # tls:
    #   insecure: true
For more detailed instructions, follow the SigNoz Logs Management guide.
2. Using FluentBit with OpenTelemetry
If you're already using FluentBit to forward logs to New Relic, you can reconfigure it to work with OpenTelemetry. First, configure FluentBit to forward logs to the OpenTelemetry Collector:
[OUTPUT]
  Name        forward
  Match       *
  Host        ${OTEL_COLLECTOR_HOST}
  Port        8006
Once FluentBit is configured to forward logs to the OpenTelemetry Collector, you can configure the OpenTelemetry Collector to receive logs from FluentBit following this guide.
3. Migrating from New Relic APM Agent Log Forwarding
If your logs were being collected via New Relic APM agents:
- Remove the New Relic agent configuration for log forwarding
- Implement one of these approaches:
- Configure application to write logs to files and collect using the filelog receiver
- Use a log forwarder like FluentBit or Fluentd to collect and forward logs
- If using Java, Node.js, or other languages with OpenTelemetry logging support, consider using the OpenTelemetry Logging SDK
Log Parsing and Enrichment
SigNoz provides powerful log processing capabilities through log pipelines. Here are some examples of common log parsing configurations. For more detailed examples and advanced techniques, see Parsing Logs with the OpenTelemetry Collector:
JSON Log Parsing
For applications that output logs in JSON format:
processors:
  - json_parser:
      source: body
      preserve_to: raw_body
This configuration will:
- Parse the JSON in the
bodyfield - Extract all JSON fields as top-level attributes
- Preserve the original log in the
raw_bodyfield
Structured Logs with Regex Parser
For logs with a common pattern like [2023-04-22 15:04:05] ERROR: Database connection failed:
processors:
  - regex_parser:
      source: body
      regex: '^\[(?P<timestamp>\d{4}-\d{2}-\d{2} \d{2}:\d{2}:\d{2})\] (?P<level>\w+): (?P<message>.*)$'
      timestamp:
        source: timestamp
        format: '%Y-%m-%d %H:%M:%S'
This configuration will:
- Extract timestamp, log level, and message as separate fields
- Parse the timestamp into a standard format
New Relic APM Log Format
If you're migrating logs from New Relic APM agents, you may have logs in this format:
2023-04-22 15:04:05 [INFO] [MyApp] [txn=WebTransaction/Controller/users/show] [traceId=abc123] Message content
Use this pipeline configuration:
processors:
  - regex_parser:
      source: body
      regex: '^(?P<timestamp>\d{4}-\d{2}-\d{2} \d{2}:\d{2}:\d{2}) \[(?P<level>\w+)\] \[(?P<service>\w+)\] \[txn=(?P<transaction>[^\]]+)\] \[traceId=(?P<trace_id>[^\]]+)\] (?P<message>.*)$'
      timestamp:
        source: timestamp
        format: '%Y-%m-%d %H:%M:%S'
This configuration extracts all the relevant fields from your New Relic logs, enabling easy filtering and correlation in SigNoz.
Using the SigNoz Logs Explorer
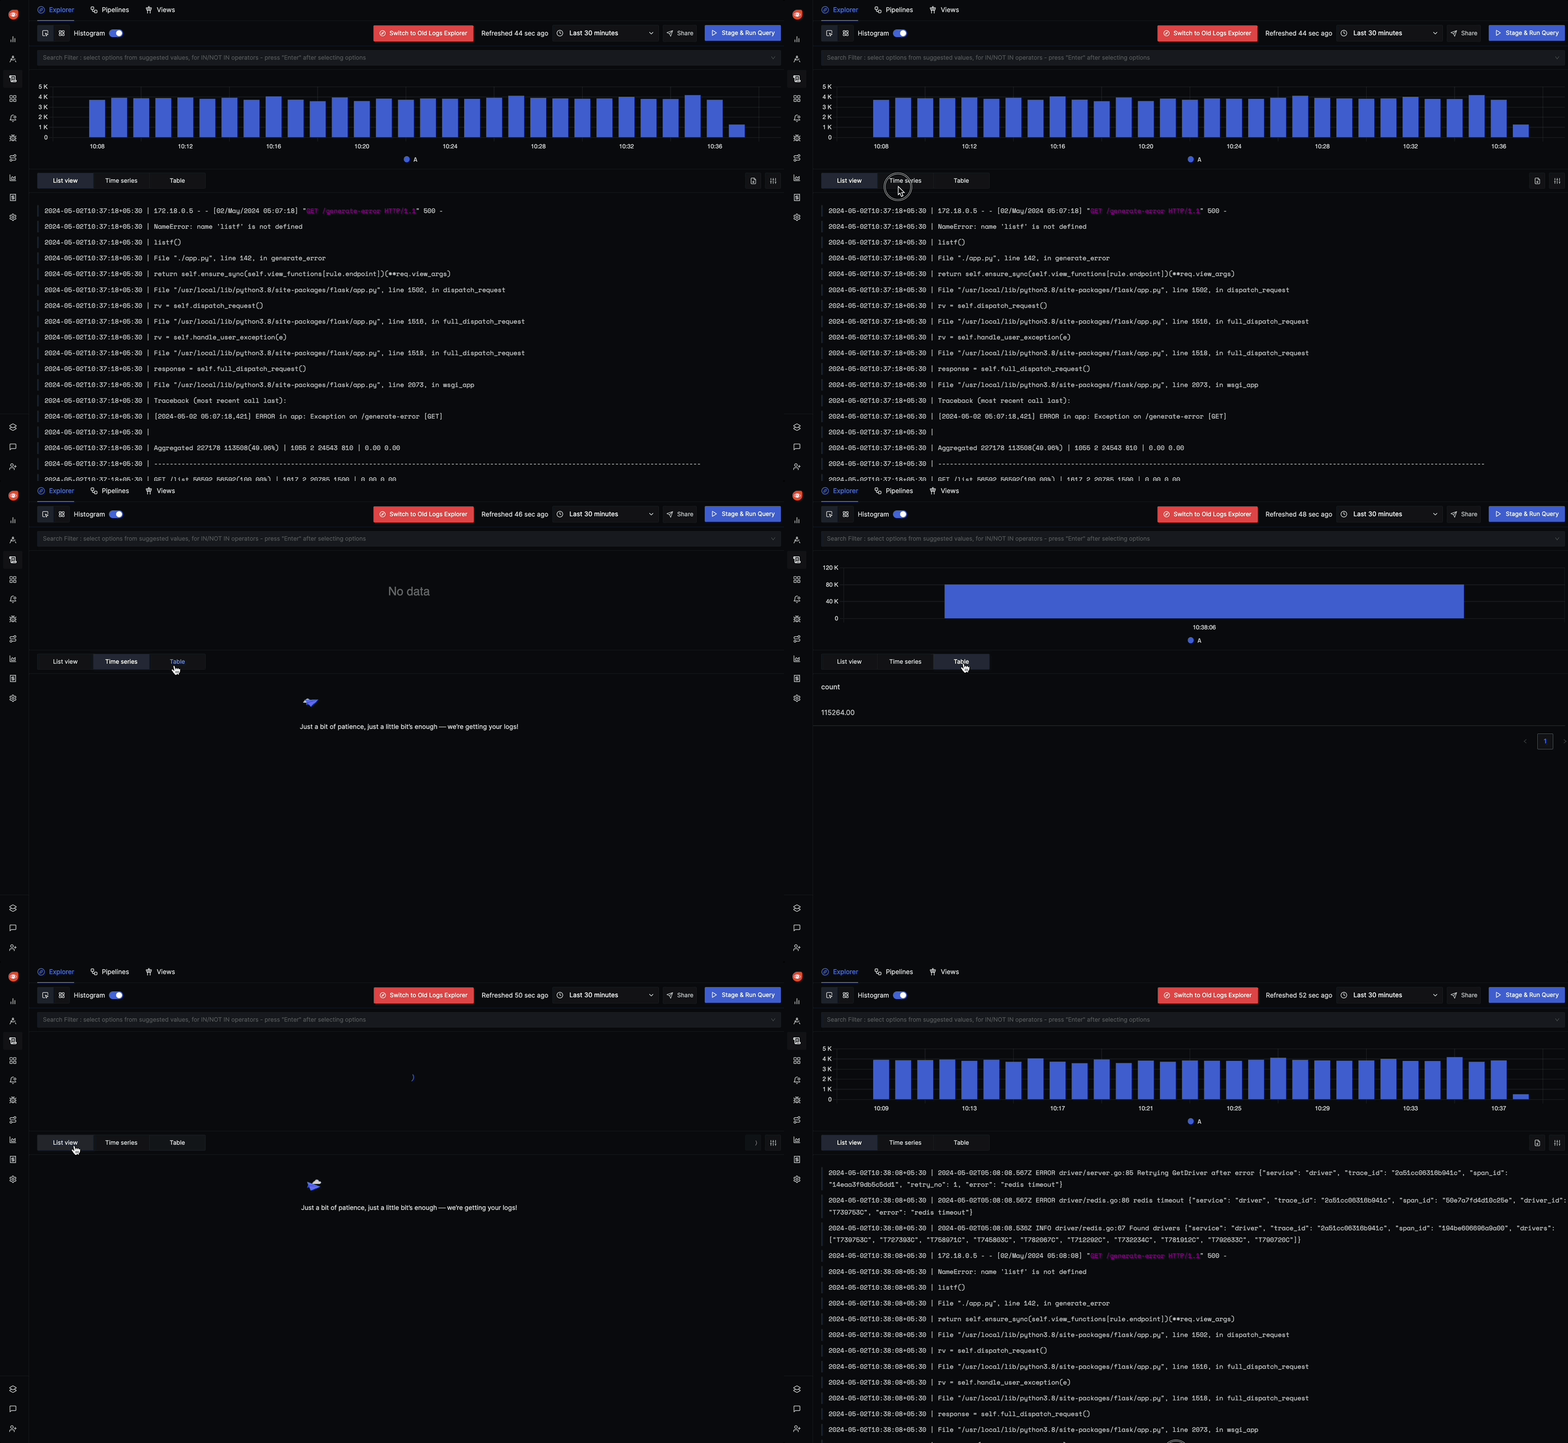
The Logs Explorer in SigNoz provides a powerful interface for searching, filtering, and analyzing your logs.

Key features of the Logs Explorer include:
- Full-text search: Search across the
bodyof all logs - Advanced filtering: Filter logs by any attribute or field
- Live Tail: Watch logs in real-time as they arrive
- Trace correlation: Connect logs to related traces for context
For detailed information on how to use all the features of the Logs Explorer, refer to the Logs Explorer documentation.
In case you will be querying logs from dashboards using ClickHouse SQL, you can refer to the Logs Schema.
Verifying Log Migration
After setting up log collection in SigNoz, verify that logs are being collected correctly:
- Navigate to the
Logssection in SigNoz - Check that logs are appearing with the expected fields and format
- Verify that any custom attributes are being extracted correctly
- Test queries to ensure they return the expected results
- Compare with New Relic to ensure all logs are being captured
Next Steps
Once your logs are successfully migrating to SigNoz, consider:
- Creating dashboards with log-based panels
- Setting up log-based alerts for important log patterns
- Configuring log processing pipelines for advanced log enrichment and structuring
- Correlating logs with traces for comprehensive observability
Last updated: May 12, 2025
