Migrate Metrics from New Relic
Migrating metrics from New Relic to SigNoz involves reconfiguring your metrics collection to work with OpenTelemetry. This guide provides several approaches depending on your current setup.
Understanding Metric Collection Differences
Before migrating, it's important to understand the key differences between New Relic and SigNoz metrics:
| Feature | New Relic | SigNoz | Notes |
|---|---|---|---|
| Collection Method | Proprietary agents, Prometheus integration | OpenTelemetry, Prometheus Receiver | SigNoz uses open standards |
| Data Model | Dimensional metrics in NRDB | OpenTelemetry metrics model | Similar concept, different implementation |
| Query Language | NRQL | PromQL, ClickHouse SQL | Migration requires query translation |
| Storage | NRDB | ClickHouse | Different backend storage technology |
Migration Approaches
SigNoz offers multiple ways to migrate your metrics from New Relic. Choose the approach that best fits your infrastructure and requirements.
1. Switch to OpenTelemetry for Metrics Collection
The recommended approach is to adopt OpenTelemetry for metrics collection. OpenTelemetry is an open-source standard that provides vendor-neutral instrumentation.
Setting Up the OpenTelemetry Collector
- Install the OpenTelemetry Collector in your environment
- Configure appropriate receivers based on your infrastructure
- Configure the collector to send metrics to SigNoz:
exporters:
  otlp:
    # For SigNoz Cloud
    endpoint: "ingest.{region}.signoz.cloud:443"
    headers:
      "signoz-ingestion-key": "<your-ingestion-key>"
    tls:
      insecure: false

    # For Self-hosted SigNoz
    # endpoint: "<signoz-otel-collector>:4317"
    # tls:
    #   insecure: true
2. Use Prometheus Receiver for Existing Exporters
If you're using Prometheus with New Relic, you can redirect those metrics to SigNoz:
- Configure the Prometheus Receiver in your OpenTelemetry Collector:
Example configuration:
receivers:
  prometheus:
    config:
      scrape_configs:
        - job_name: 'prometheus'
          scrape_interval: 10s
          static_configs:
            - targets: ['localhost:9090']
- Point your existing Prometheus exporters to the OpenTelemetry Collector instead of New Relic.
3. Replace New Relic Agents with OpenTelemetry Instrumentation
For applications using New Relic agents:
- Remove the New Relic agent from your application
- Follow the appropriate language-specific instrumentation guide from the SigNoz instrumentation documentation
- Configure the OpenTelemetry SDK to send metrics to your OpenTelemetry Collector
SigNoz provides detailed instrumentation guides for various languages and frameworks including:
4. Migrate Infrastructure Metrics
For infrastructure metrics previously collected by New Relic Infrastructure:
- Configure the OpenTelemetry Host Metrics Receiver:
receivers:
  hostmetrics:
    collection_interval: 30s
    scrapers:
      cpu:
      disk:
      load:
      filesystem:
      memory:
      network:
      paging:
      process:
- Add the receiver to your metrics pipeline in the OpenTelemetry Collector configuration:
service:
  pipelines:
    metrics:
      receivers: [hostmetrics]
      processors: [batch]
      exporters: [otlp]
This configuration will collect system metrics similar to those gathered by New Relic Infrastructure, including CPU usage, memory utilization, disk I/O, and network statistics.
5. Migrating Cloud Infrastructure Integrations
If you were using New Relic to monitor cloud infrastructure (AWS, Azure, GCP), SigNoz provides [native integrations)(/docs/cloud/) to help you migrate your cloud monitoring setup.
SigNoz offers a one-click integration for AWS, making it easy to bring in metrics from your AWS services. Integrations for Azure and GCP are coming soon, but in the meantime, you can use the OpenTelemetry Collector with the appropriate receivers or Prometheus exporters to collect metrics from these platforms.
6. Migrating Synthetics/Availability Monitoring
New Relic Synthetics provides advanced synthetic monitoring features such as scripted browser checks and API tests. SigNoz currently supports HTTP endpoint monitoring, which allows you to track the availability and response time of your web services and APIs.
To migrate basic uptime and HTTP check monitoring from New Relic Synthetics to SigNoz, you can use the built-in HTTP endpoint monitoring feature. This enables you to set up periodic checks for your endpoints and receive alerts if they become unavailable or respond slowly.
For more details and setup instructions, refer to the Monitor HTTP Endpoints documentation.
Using the SigNoz Metrics Explorer
The Metrics Explorer in SigNoz provides a powerful interface for querying and visualizing your metrics data.
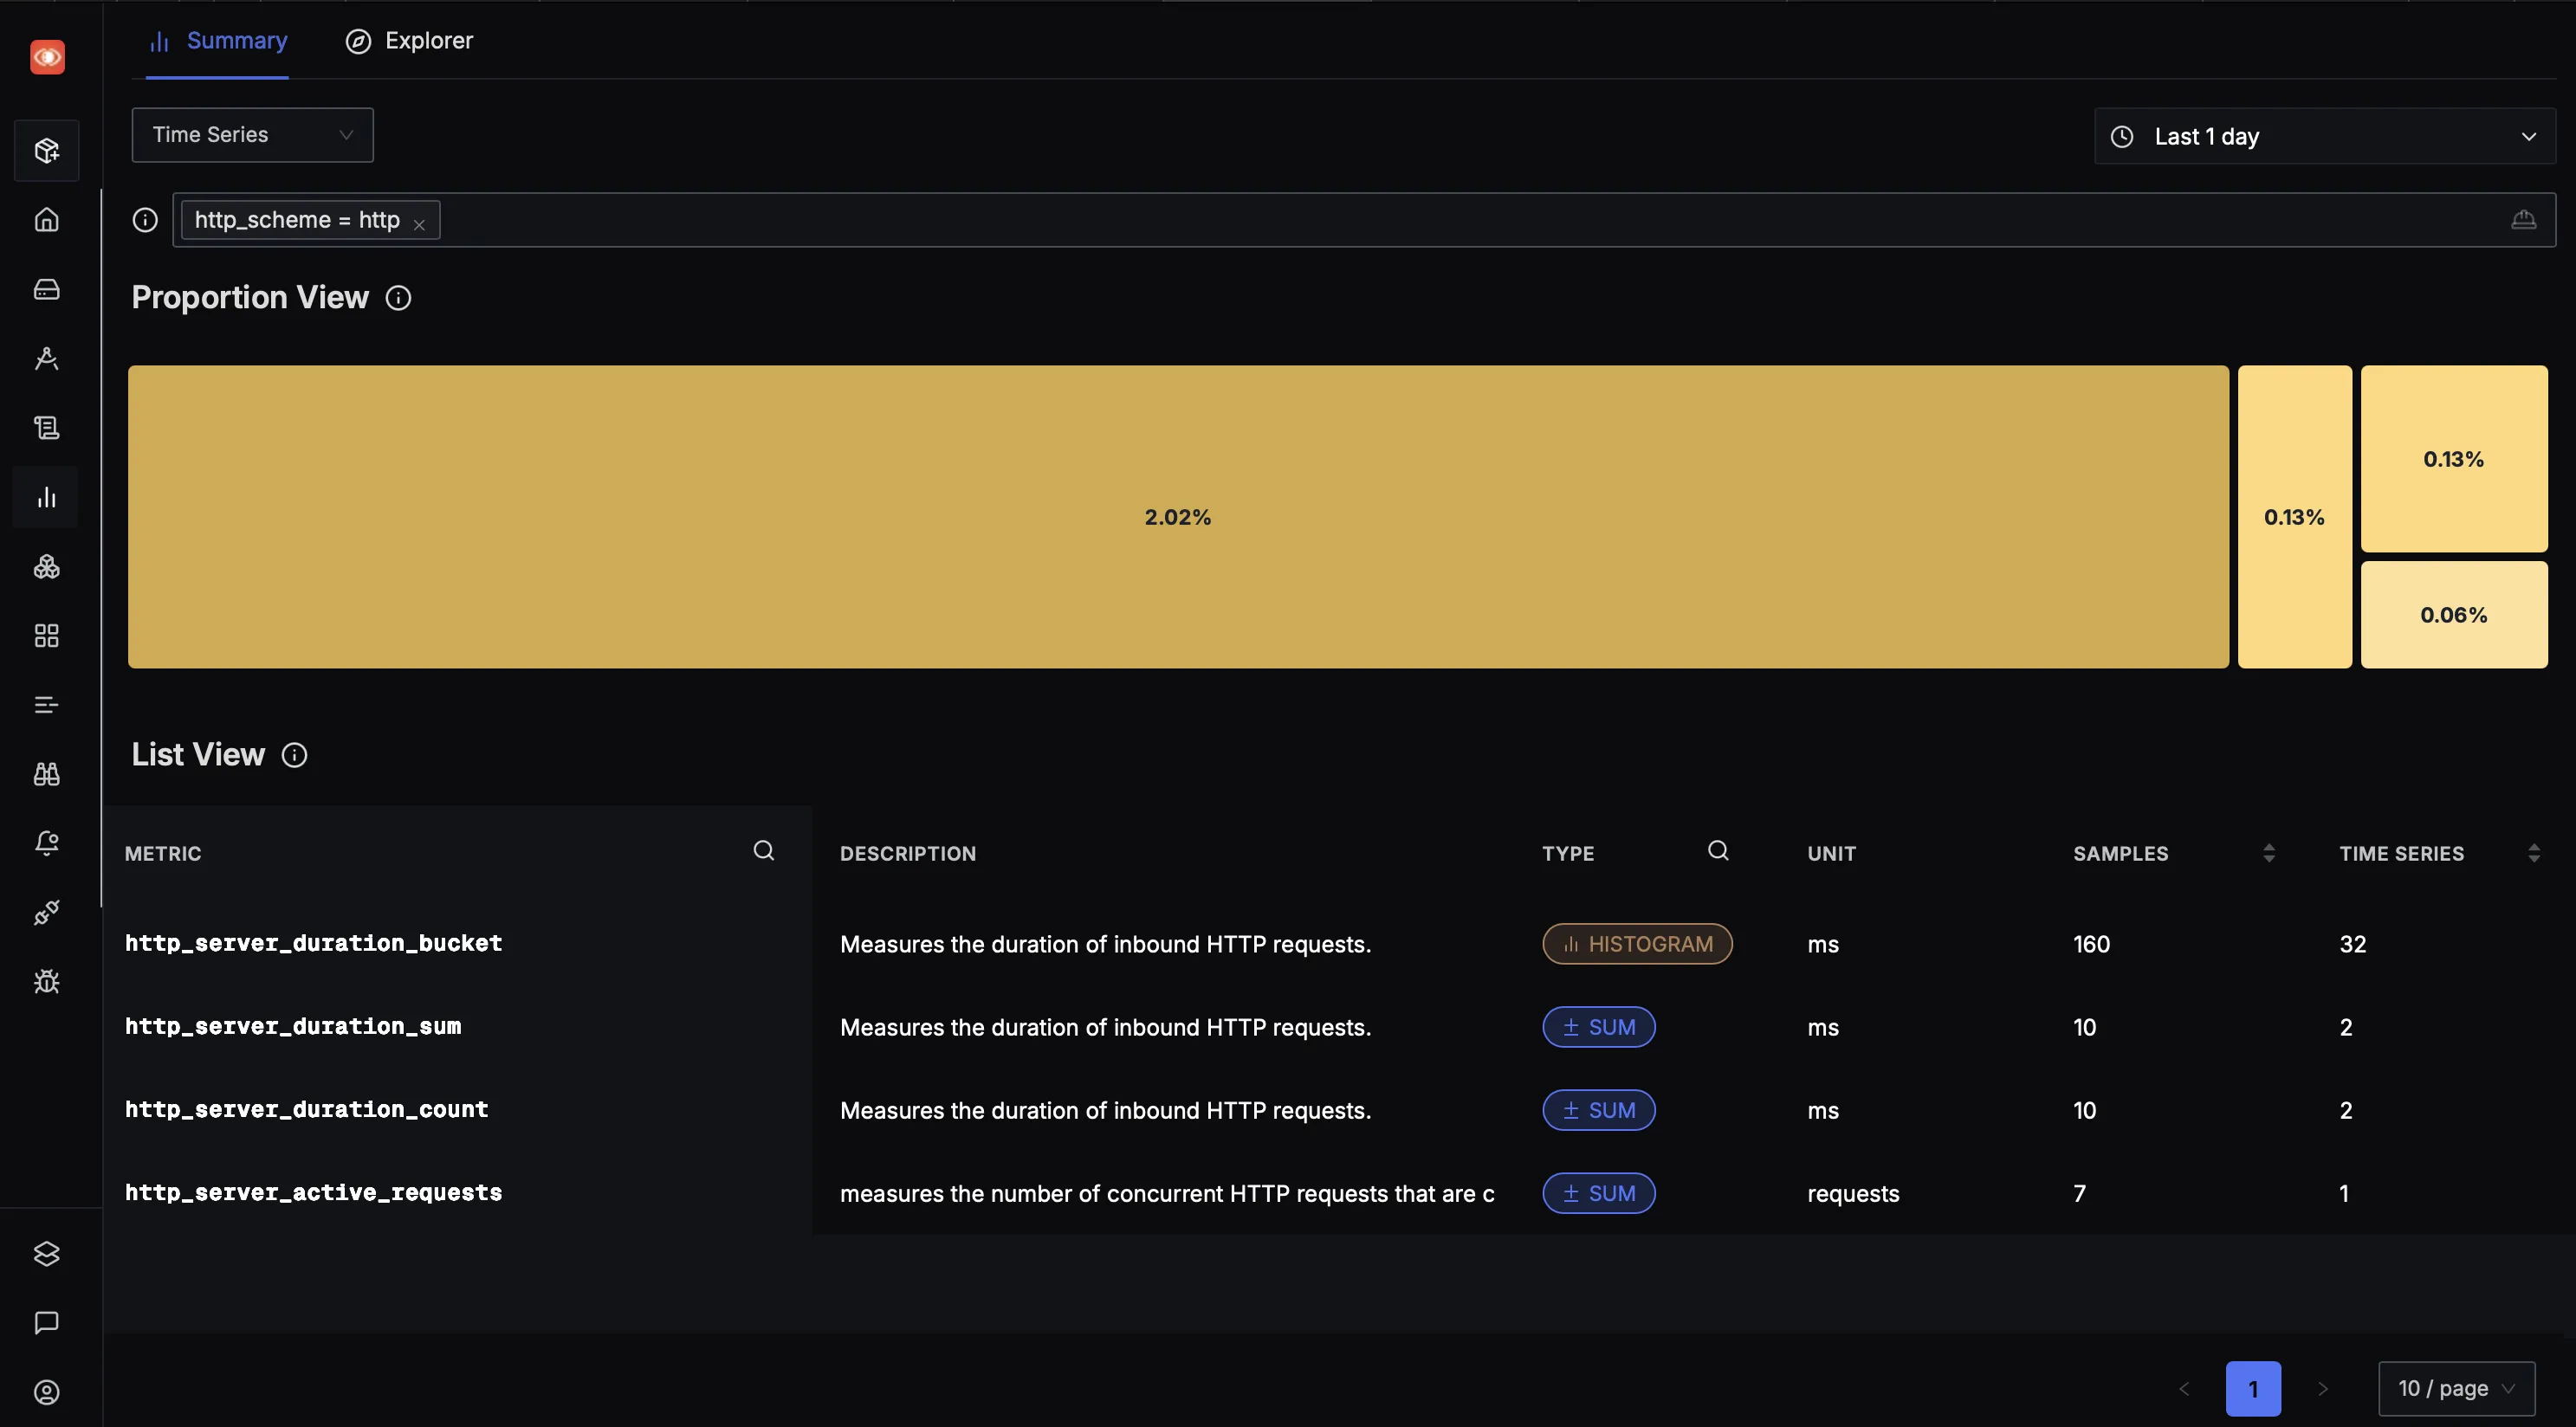
To explore your metrics in SigNoz:
- In the SigNoz UI, click on
Metricsin the left sidebar - Find a metric from the
List View - Check metric attributes by clicking on the metric name
- Alternatively, use the
Search Filterto find metrics with specific attributes
Using the SigNoz Query Builder
In addition to supporting PromQL and ClickHouse SQL, SigNoz provides a powerful UI-based Query Builder. This tool allows you to build complex queries and visualizations without writing code, making it easy to explore your data and create dashboards. You can access the Query Builder from the Metrics and Logs Explorer sections in the SigNoz UI.
For more details, see the Query Builder documentation.
Translating NRQL Queries to SigNoz
Here are examples of translating common New Relic NRQL queries to SigNoz:
| Metric Type | New Relic NRQL | SigNoz PromQL Query |
|---|---|---|
| Response Time | SELECT average(duration) FROM Transaction WHERE appName = 'MyApp' | avg(http_server_duration_milliseconds{service_name="MyApp"}) |
| Throughput | SELECT count(*) FROM Transaction WHERE appName = 'MyApp' | sum(rate(http_server_request_count{service_name="MyApp"}[5m])) |
| Error Rate | SELECT percentage(count(*), WHERE error IS true) FROM Transaction | sum(rate(http_server_request_count{status_code=~"5.."}[5m])) / sum(rate(http_server_request_count[5m])) * 100 |
| Host CPU Usage | SELECT average(cpuPercent) FROM SystemSample WHERE hostname = 'host1' | avg(system_cpu_usage{host="host1"}) |
| Memory Usage | SELECT average(memoryUsedPercent) FROM SystemSample | avg(system_memory_usage{state="used"} / (system_memory_usage{state="used"} + system_memory_usage{state="free"}) * 100) |
In case you will be querying metrics from dashboards using ClickHouse SQL, you can refer to the Metrics Schema.
Common Metrics Mapping
When migrating from New Relic to SigNoz, you'll need to map New Relic metric names to their OpenTelemetry equivalents. Here are some common mappings:
| New Relic Metric | OpenTelemetry Metric |
|---|---|
httpResponseTime | http.server.duration |
throughput | http.server.request.count |
errorRate | Calculated from http.server.request.count |
cpuPercent | system.cpu.usage |
memoryUsedPercent | system.memory.usage |
diskUtilizationPercent | system.filesystem.usage |
garbageCollectionTime | process.runtime.jvm.gc.duration |
heapMemoryUsage | process.runtime.jvm.memory.heap |
Verifying Metrics in SigNoz
After migrating your metrics collection to SigNoz, it's important to verify that everything is working correctly:
- Check that metrics are being received in SigNoz
- Verify that the metrics have the correct labels and values
- Compare with New Relic to ensure data consistency
- Set up dashboards to monitor key metrics
Next Steps
Once your metrics are successfully migrated to SigNoz, consider:
- Creating dashboards for your most important metrics
- Setting up alerts based on these metrics
- Migrating your traces for end-to-end observability
- Migrating your logs to complete your observability stack
Last updated: May 12, 2025
