View Traces in SigNoz
This page shows how you can use distributed tracing to retrieve detailed telemetry data and see how your applications are performing. This section explains:
- How to visualize aggregate metrics from traces
- How to filter your spans
- How to inspect a span
Prerequisites
- This section assumes that your application is already instrumented. For details about how you can instrument your application, see the Instrument Your Application section.
- This section assumes that you are familiar with the basics of monitoring applications.
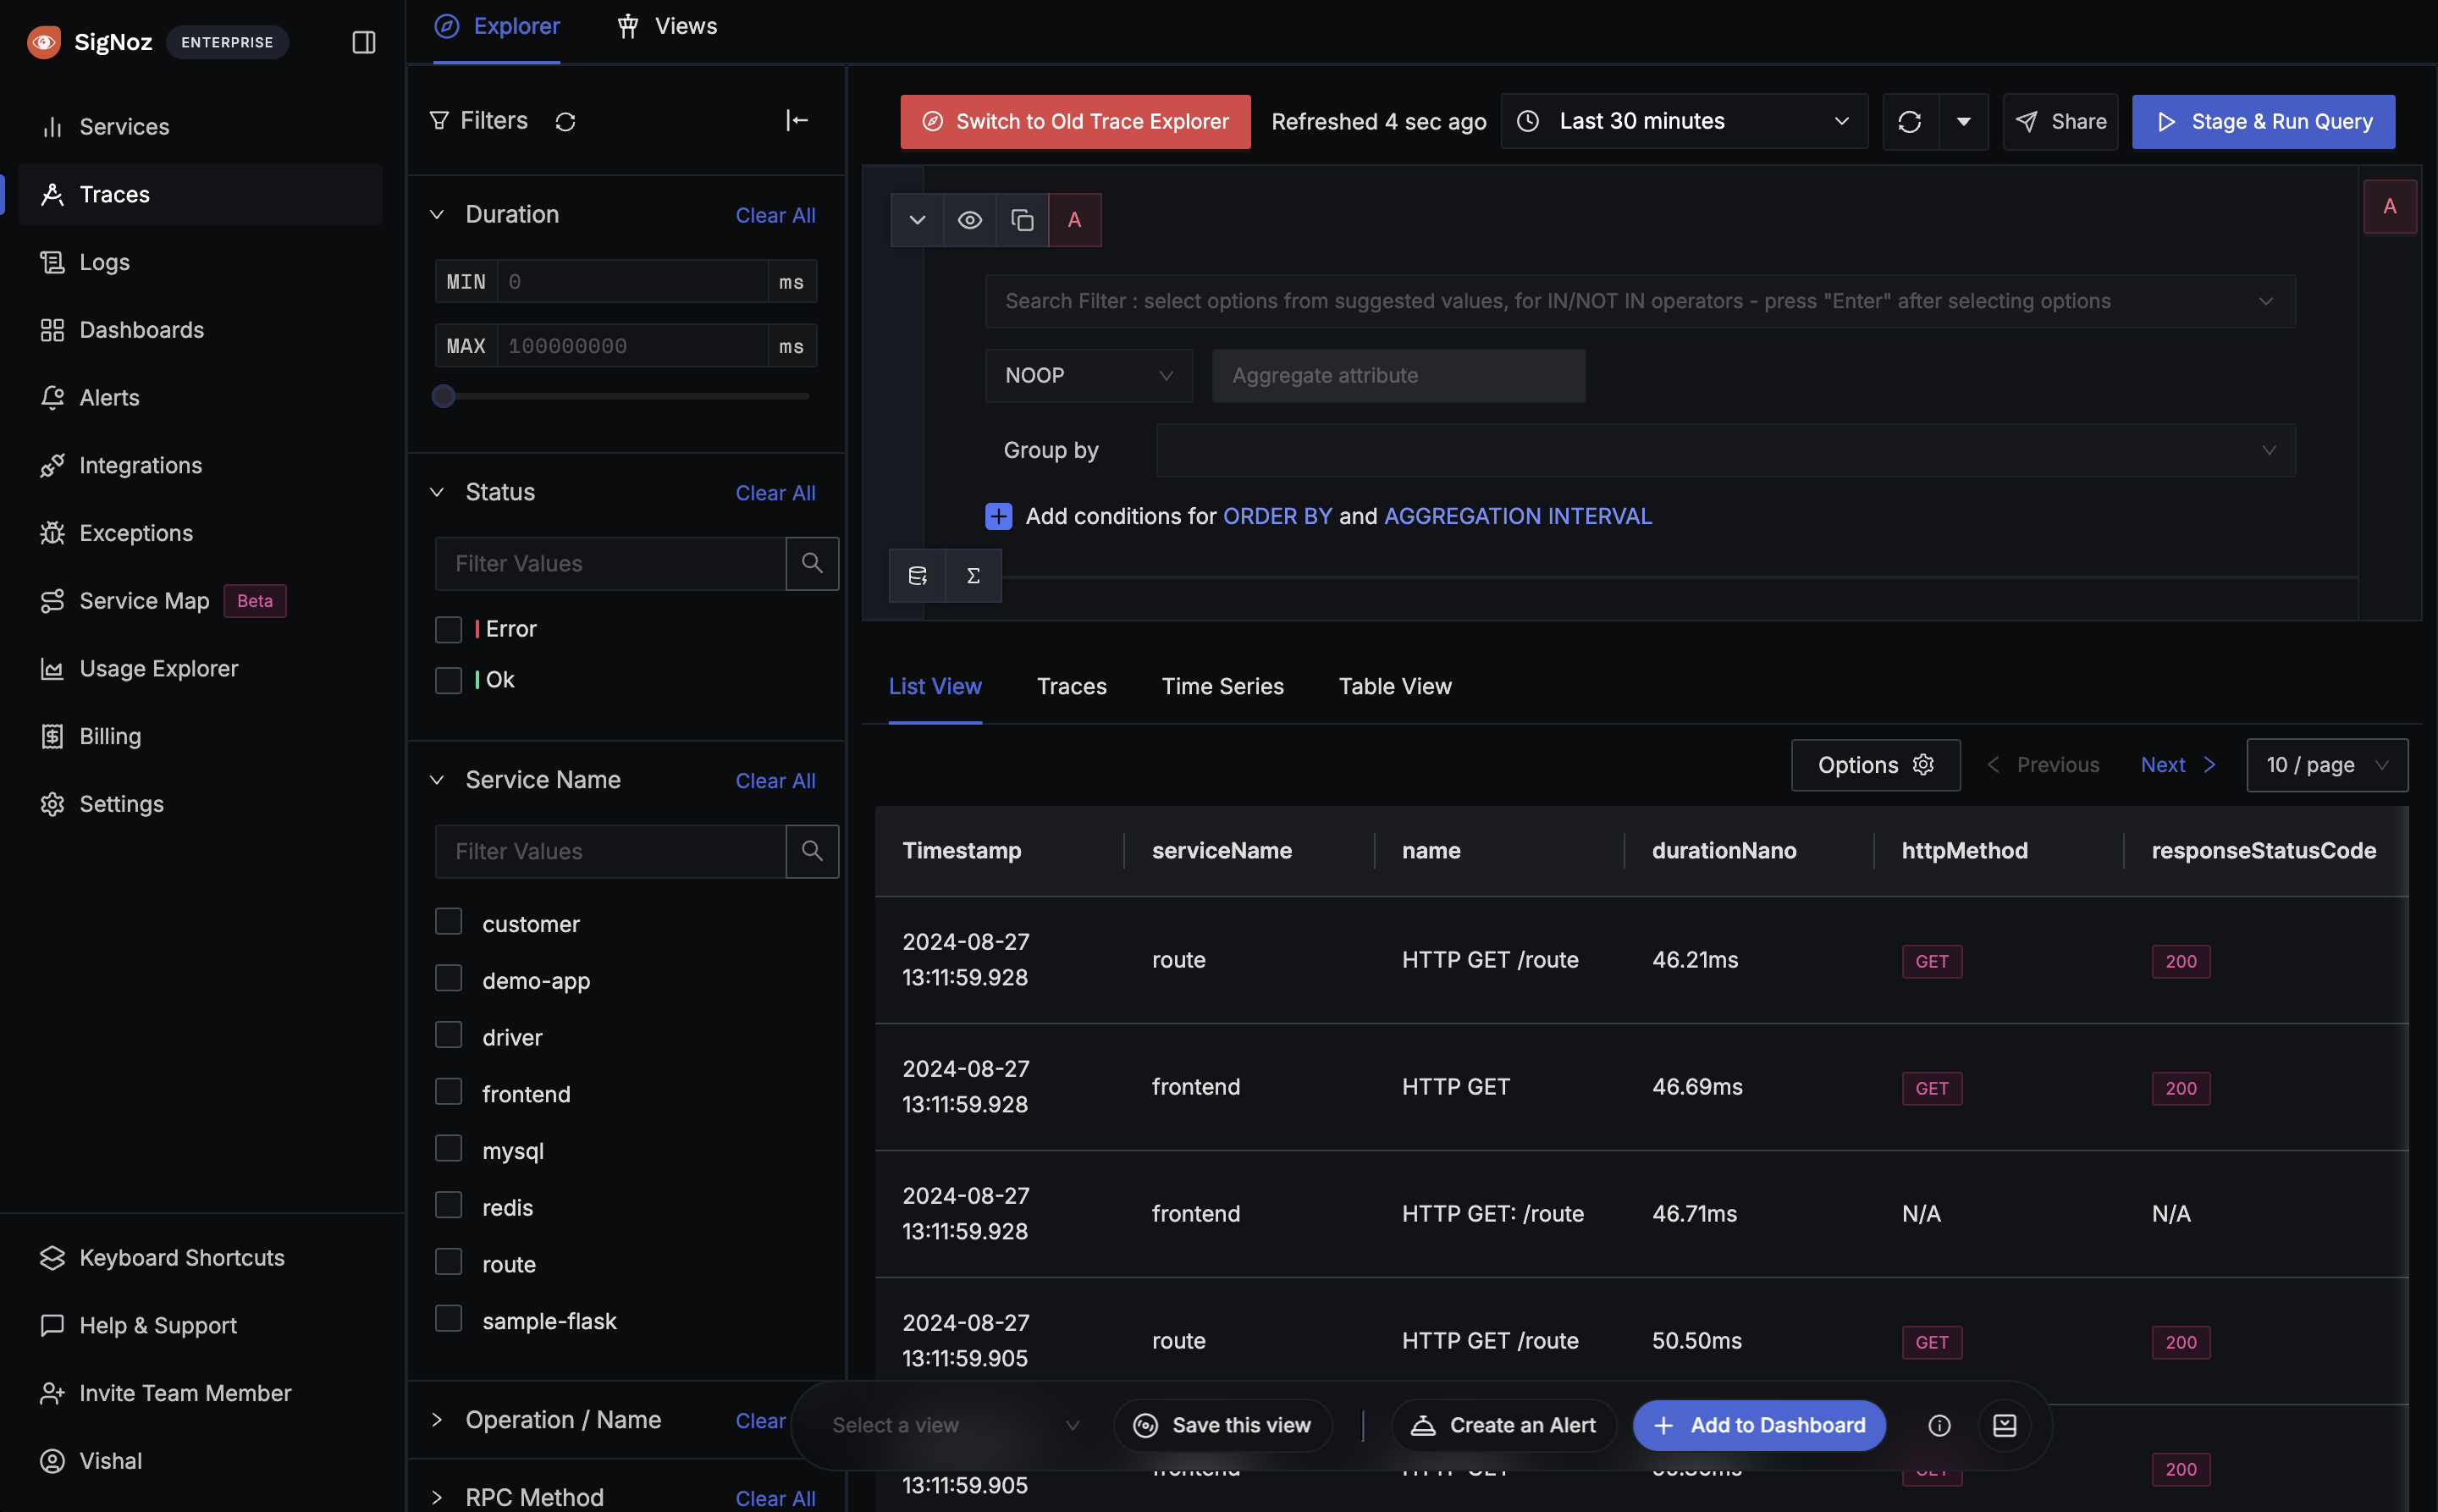
Open the Traces Section
From the sidebar, select Traces:
Visualize Aggregate Metrics from Traces
SigNoz allows you to create aggregates of your filtered traces with various aggregate functions. Refer to query builder aggregation docs here
Filter Spans by Tags/Attributes
The Traces Explorer in SigNoz provides a feature for quick filtering of spans using various parameters. This functionality allows users to quickly search their specific spans, making it easier to analyze and debug applications.
There are two ways in which you can filter traces by tags:
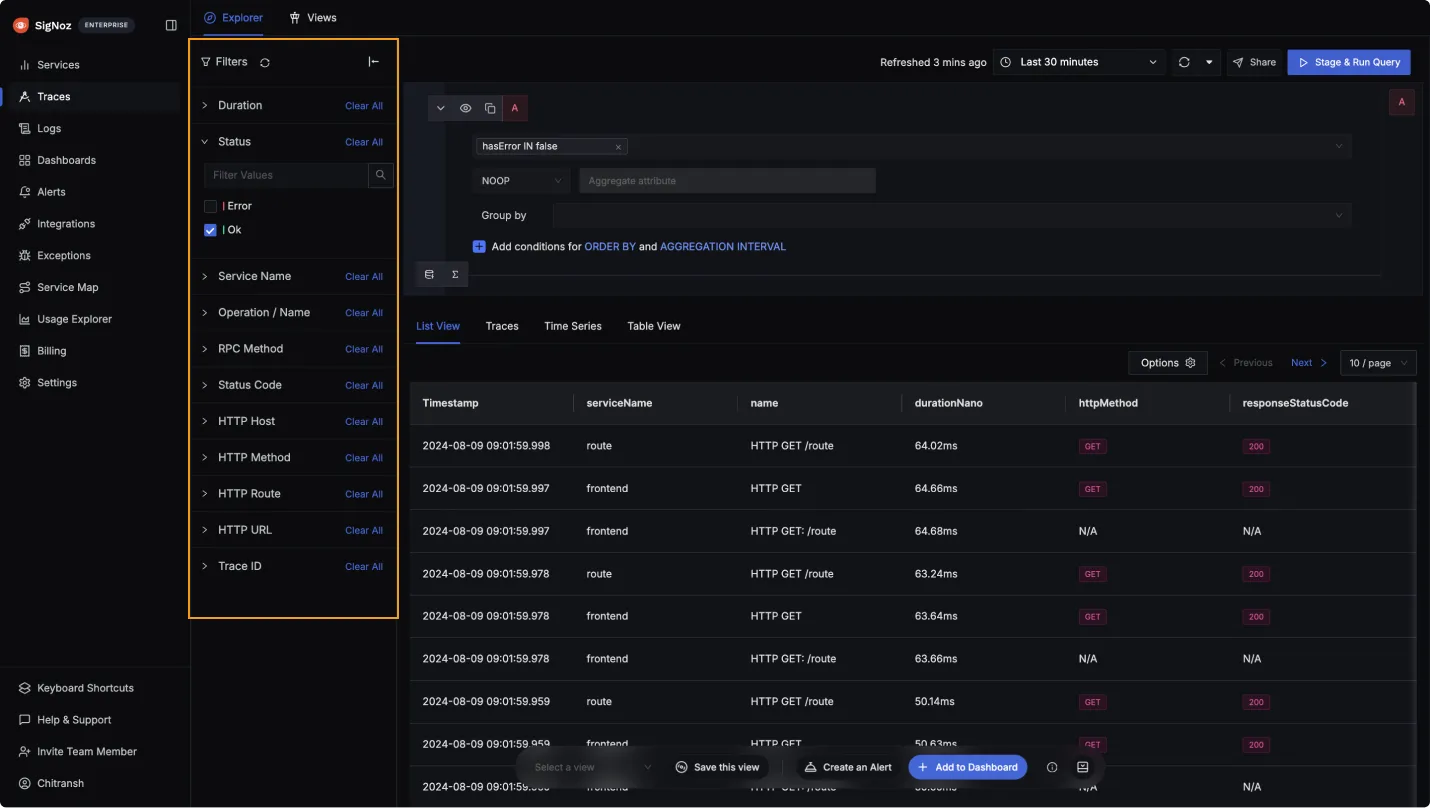
- You can select a filter from the Quick Filter. More details on available quick filters are here
- You can use the query builder. To access the query builder, select the Search Filter input. Then, use the dropdown list to select a key from the list of your attributes, select an operator and enter a value. When you’ve finished, select the Stage and Run Query button. Refer to this doc for more details on Query Builder.
Inspect a Span
To further troubleshoot your application, you can select a span from the list to view its details. For details, see the Span Details page.
Missing Spans
If you are seeing missing spans in your traces, it could be due to the following reasons:
One of the service is instrumented but not sending spans to SigNoz. For example, the service might not be exporting spans to SigNoz.
The spans are not being sent to SigNoz. For example, the spans might be dropped due to network issues or the spans might be dropped due to sampling.
Span Gaps
Sometimes it's possible that there are gaps between consequent spans. This happens when some process/code are not traced. For Example, by default OpenTelemetry auto instrumentation libraries do not trace the custom functions/methods. This can be fixed by adding manual instrumentation to the code.

Get Help
If you need help with the steps in this topic, please reach out to us on SigNoz Community Slack.
If you are a SigNoz Cloud user, please use in product chat support located at the bottom right corner of your SigNoz instance or contact us at cloud-support@signoz.io.
Last updated: June 6, 2024
