Record Exceptions Automatically and
See detailed Stack Traces
Monitor exceptions automatically in Python, Java, Ruby, and Javascript.
For other languages, just drop in a few lines of code and start monitoring exceptions.


SigNoz

Monitor Exceptions with no-code changes
Monitor exceptions automatically in Python, Java, Ruby, and Javascript. For other languages, just drop in a few lines of code and start monitoring exceptions.
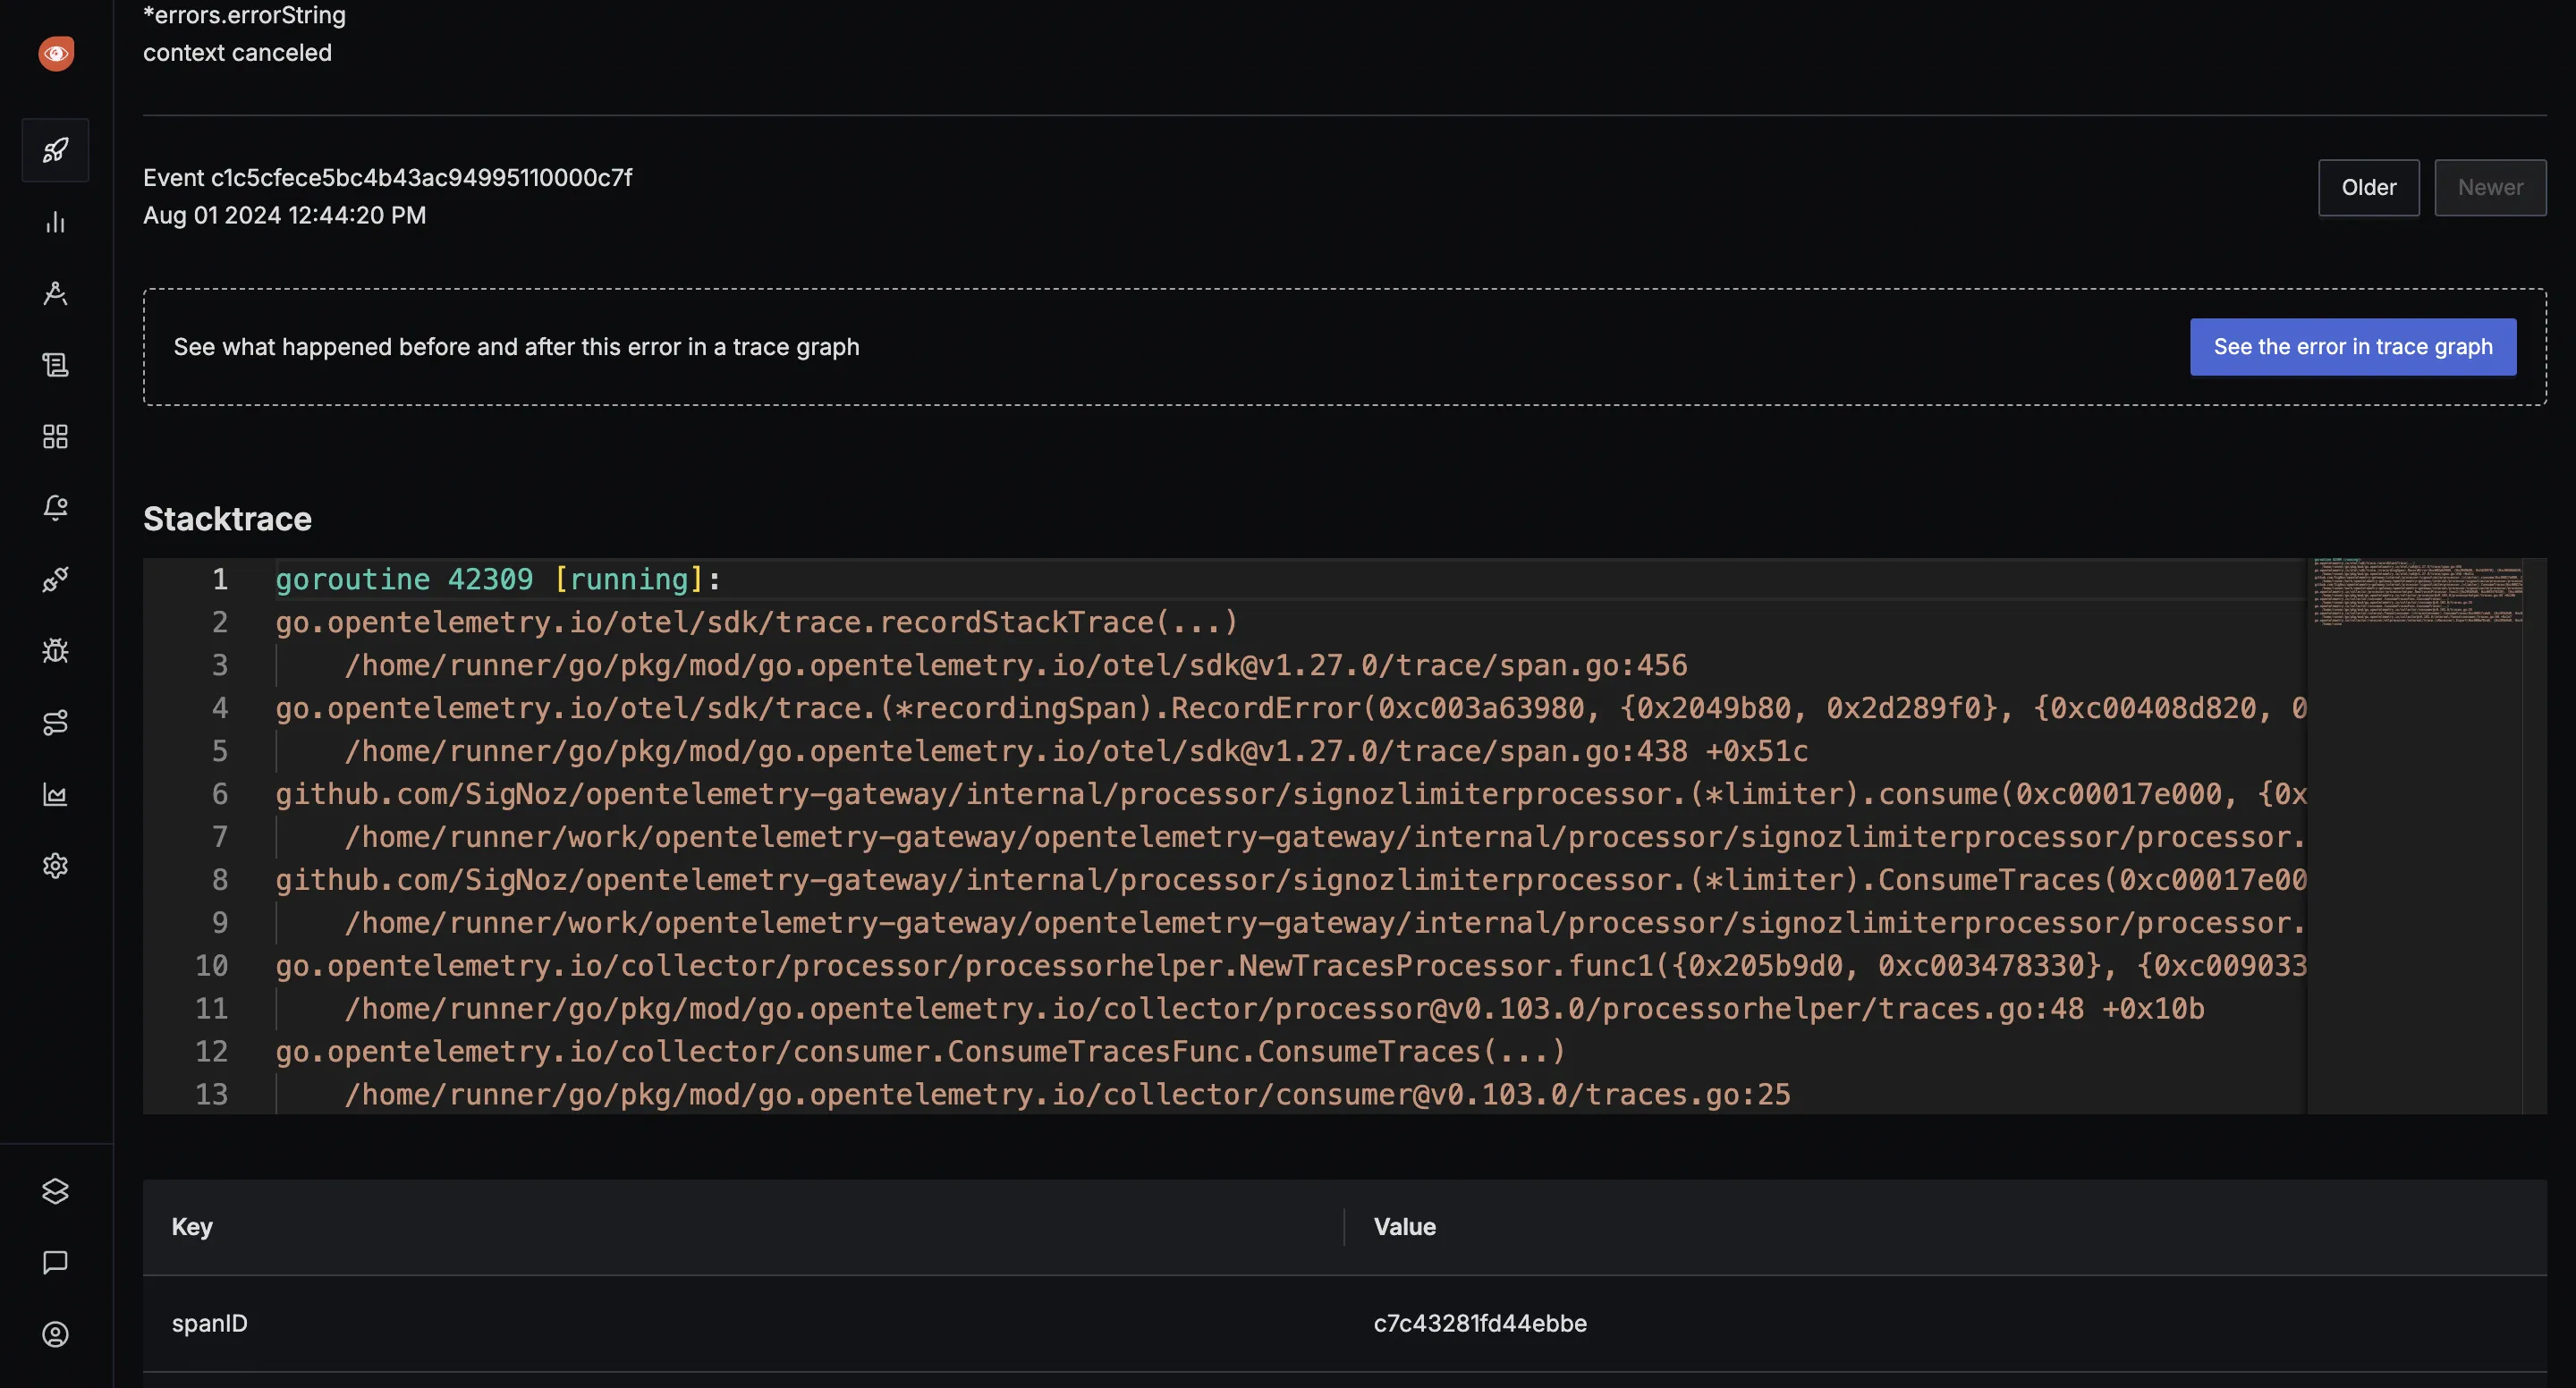
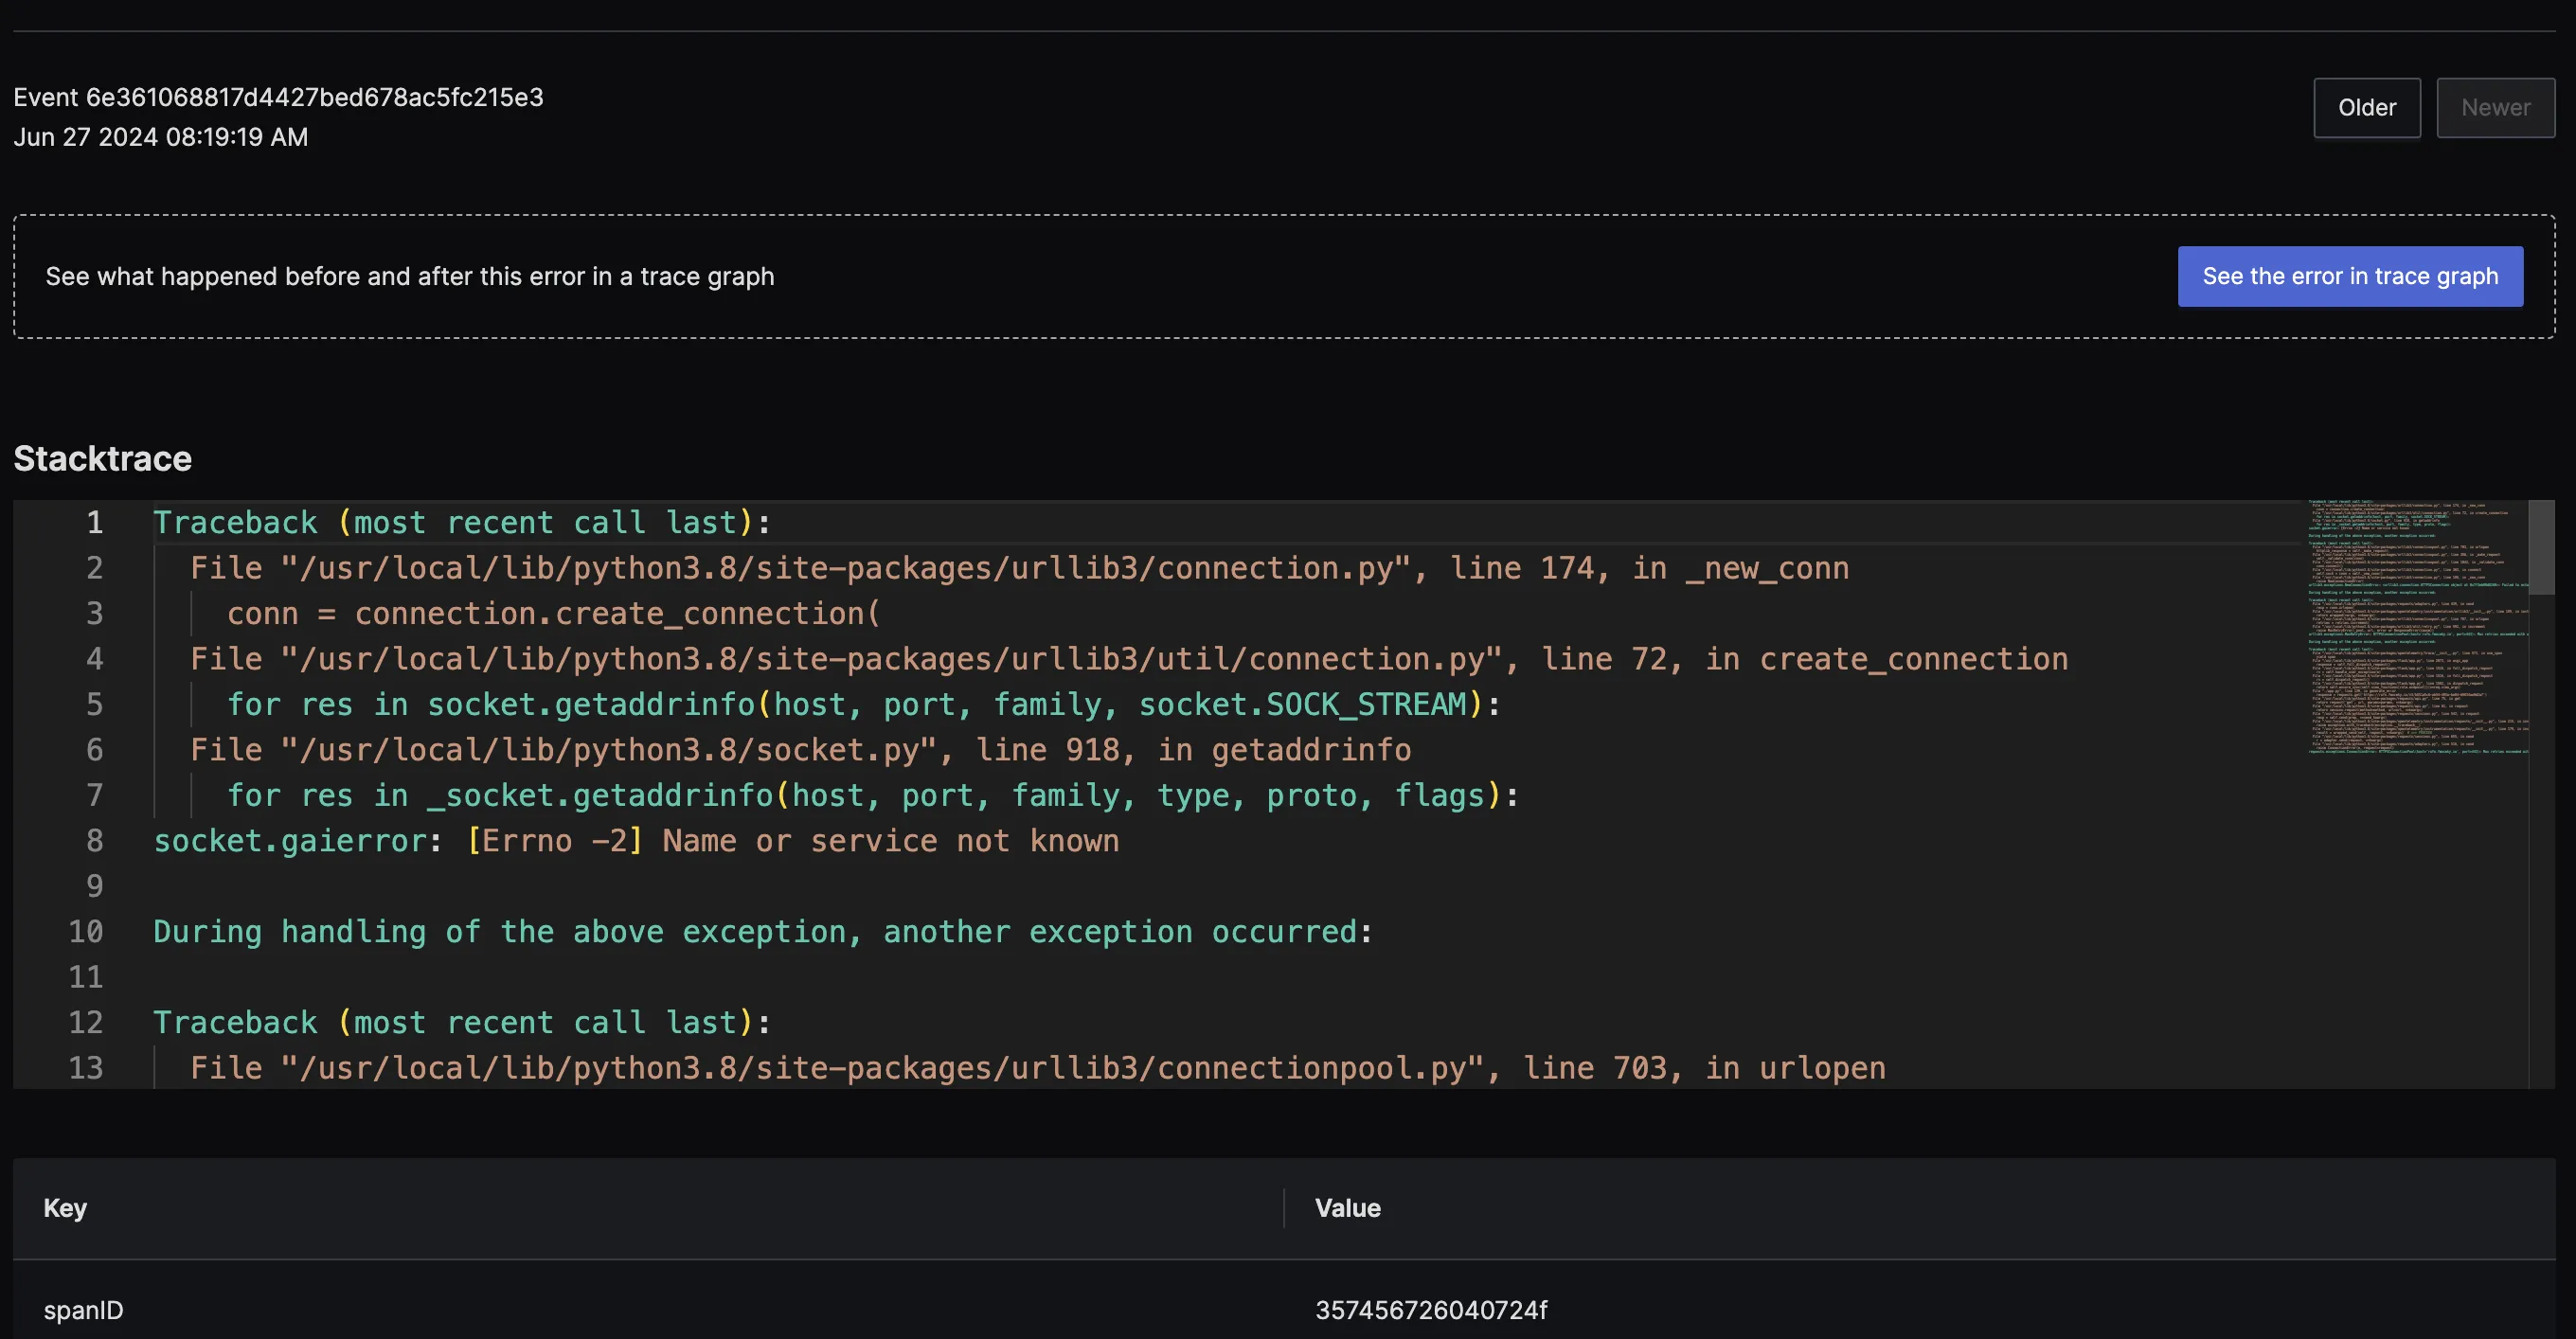
See detailed Stacktraces
See detailed stacktrace for all exceptions caught from your application. You can also log in custom attributes to add more context to your exceptions. For example, you can add attributes to identify users for which exceptions occurred.
Exceptions to Traces
We capture exceptions from trace data powered by OpenTelemetry. See your exception in the trace graph to get a richer context for debugging your exceptions. Traces will make it clear where the exception occurred in the request flow—one of the perks of using OpenTelemetry.
Overview
Record exception automatically
Monitor exceptions automatically in Python, Java, Ruby, and Javascript. For other languages, just drop in a few lines of code and start monitoring exceptions.
Detailed Stacktrace with every exception

See detailed stacktrace for all exceptions caught from your application. You can also log in custom attributes to add more context to your exceptions. For example, you can add attributes to identify users for which exceptions occurred.
Correlate exceptions with traces
See your exception in the trace graph to get a richer context for debugging your exceptions. Traces will make it clear where the exception occurred in the request flow—one of the perks of using OpenTelemetry.
Granular control
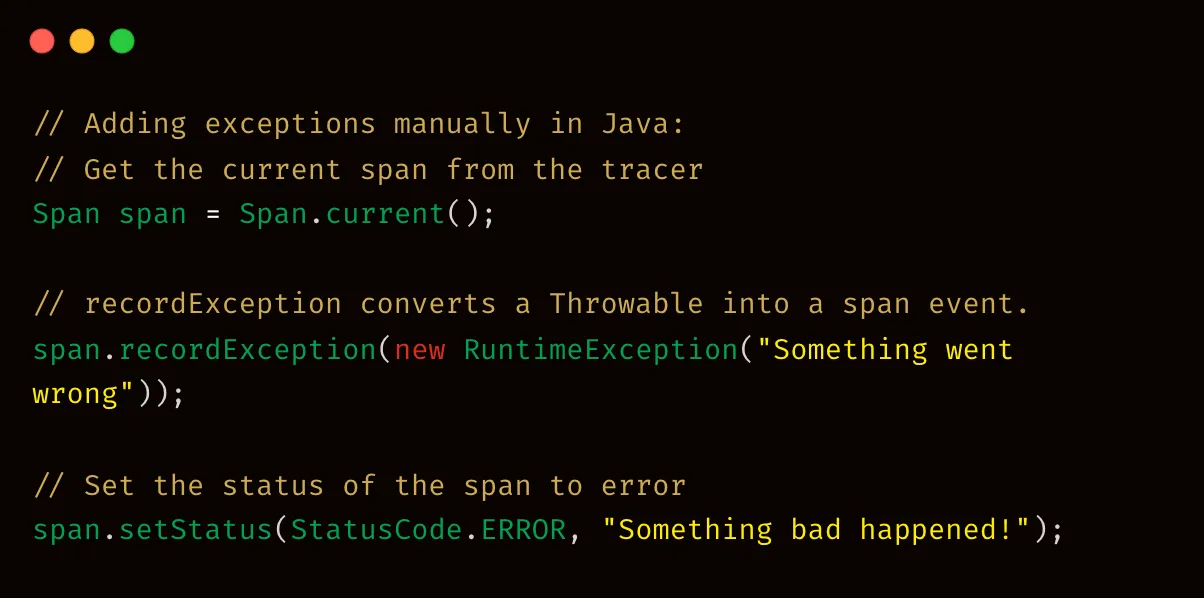
You can configure your code to catch exceptions for custom use cases with manual instrumentation - just drop in a few lines of code.
Simple
usage-based
pricing
Tired of Datadog’s unpredictable bills or New Relic’s user-based pricing?
We’re here for you.
Pay only for data you send
We don’t have any SKU-based pricing. Get access to all features in the plan selected and only pay for the data you send. Pay only $0.1 per million samples for metrics.
No special pricing for custom metrics
Vendors like Datadog charge $0.05 per custom metric, which limits a team’s ability to send and analyze custom metrics for monitoring. SigNoz does not treat custom metrics any differently. The charges remain $0.1 per million samples no matter what type of metrics you send.
Add unlimited team members
Observability should be available to every developer at your company. After all, anyone can need debugging. That’s why we don’t charge for user seats, and you can add as many team members as you want.
No Host (container or node) based pricing
For modern cloud-based applications it doesn’t make sense to charge on the basis of number of hosts or containers. You don’t need to worry about auto-scaling during peak hours. Only pay for the amount of data sent no matter the number of hosts.
Developers
Love
SigNoz

10 million+
OSS Downloads

22k+
GitHub Stars

140+
Contributors

4.5k+
Community Members
Get started with
SigNoz Cloud today

