Cloud performance monitoring is crucial for businesses relying on AWS infrastructure. As applications grow more complex, traditional monitoring methods fall short. AWS observability offers a comprehensive solution to this challenge. It provides deep insights into your cloud environment, helping you maintain optimal performance and reliability. This guide explores AWS observability, its key components, and how to implement it effectively in your cloud infrastructure.
What is AWS Observability and Why is it Important?
AWS observability is a comprehensive approach to understanding and monitoring the health and performance of your cloud infrastructure and applications. It goes beyond basic monitoring by offering deeper insights into how your systems operate and how they may encounter issues.
AWS observability is built on three core pillars:
- Metrics: Metrics are quantitative metrics that provide different aspects of an application's performance in a numerical representation. They provide a high-level overview of the functionality and state of the system.
- Traces: Traces provide detailed records of transactions as they flow through an application. They track the path of individual requests and show how they interact with various system components. Traces can show how a user request moves through different services, databases, and third-party APIs. They highlight the duration of each step, helping to identify slow or failing components.
- Logs: Logs are text-based records of events and errors within an application. They provide a chronological record of what has happened within the system. Logs can include error messages, debug information, and audit trails. They record events such as user logins, database queries, and application errors.
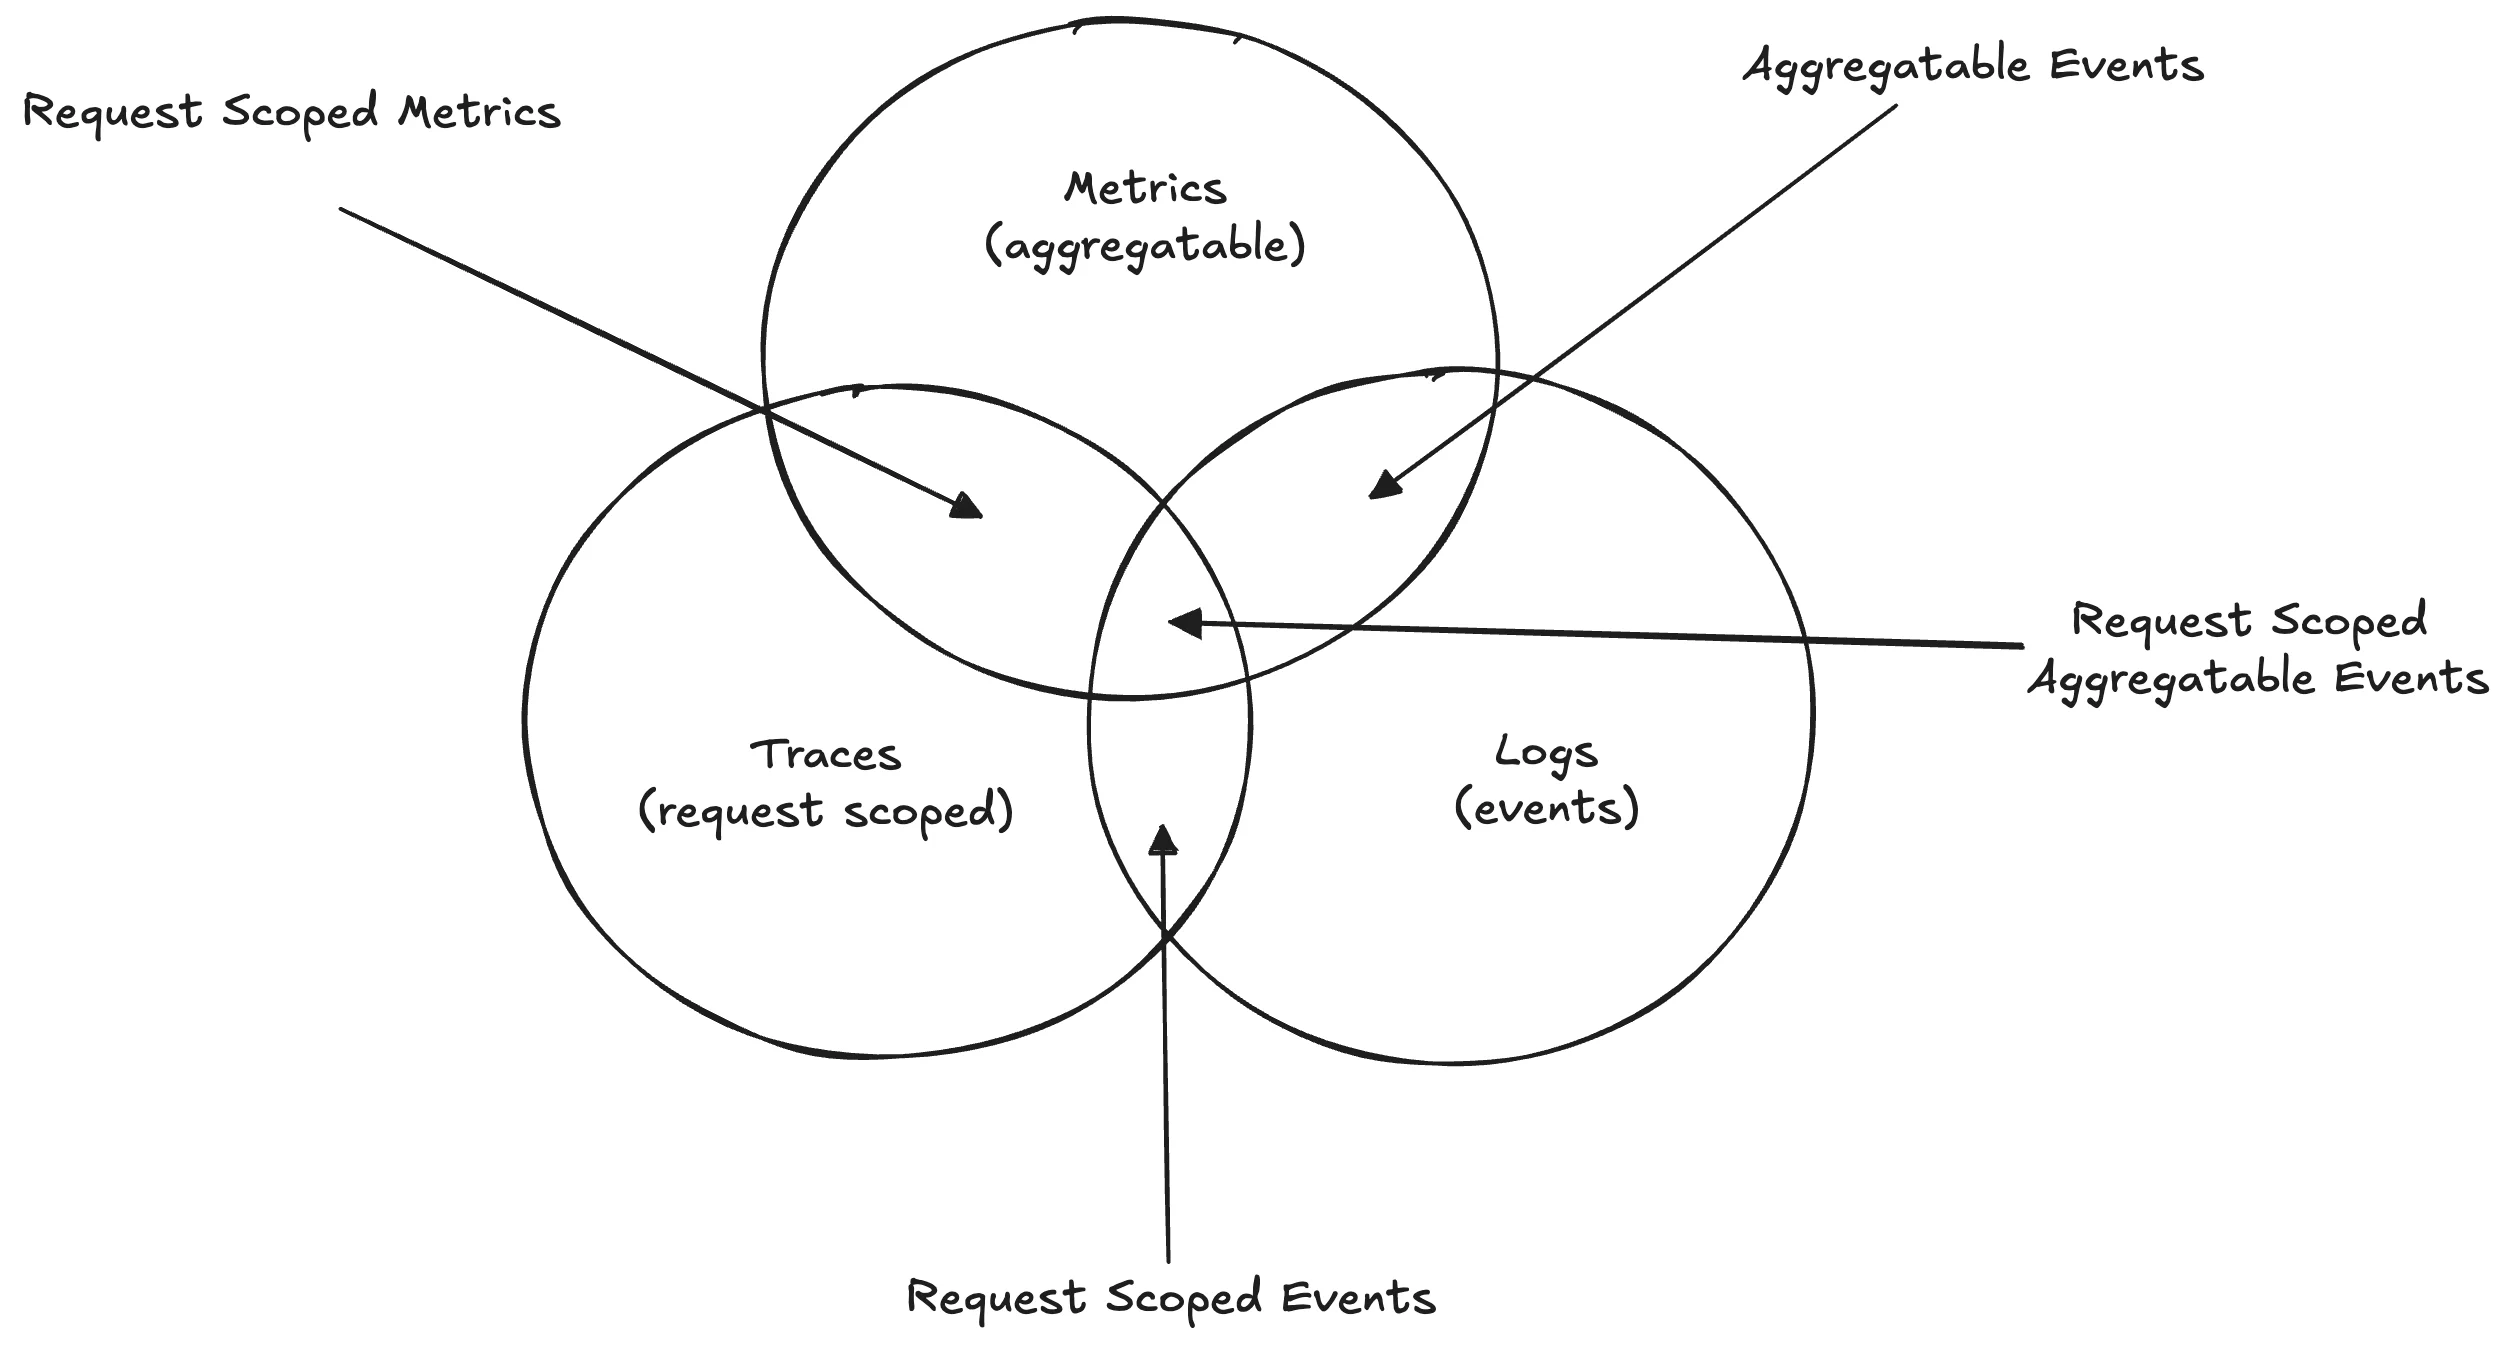
Example: Imagine you have an e-commerce application, and users report that the checkout process is slow. To identify the root cause:
- First, you check metrics and see that CPU utilization for the payment server has spiked to 95%, and the payment API response time has increased significantly, indicating a bottleneck.
- Next, you review logs and find database timeout errors in the payment service, providing details on why the checkout is slowing down.
- Finally, you examine traces and follow a user's transaction across services, identifying a delay in the payment service's communication with the database as the issue.
AWS observability is important because it:
- Provides real-time insights: It allows you to monitor the current state of your system, ensuring you can quickly detect and address issues.
- Aids in issue identification and troubleshooting: With detailed data, you can diagnose problems more effectively and find solutions faster.
- Supports proactive problem prevention: Understanding system behaviour allows you to predict and handle possible issues before they impact users.
- Improves data-driven decision-making: With detailed insights, you can make sound decisions to improve system performance and dependability.
Unlike traditional monitoring, which often relies on predefined metrics, observability enables you to explore and understand your system in depth. This approach allows you to ask new questions and discover insights that were not anticipated, providing a more flexible and thorough understanding of your cloud environment. To learn more, refer to Observability vs Monitoring vs Telemetry - Key Differences.
Key Components of AWS Observability
AWS provides several essential tools for implementing observability in your cloud environment. Each tool plays a specific role in monitoring and analyzing your infrastructure and applications:
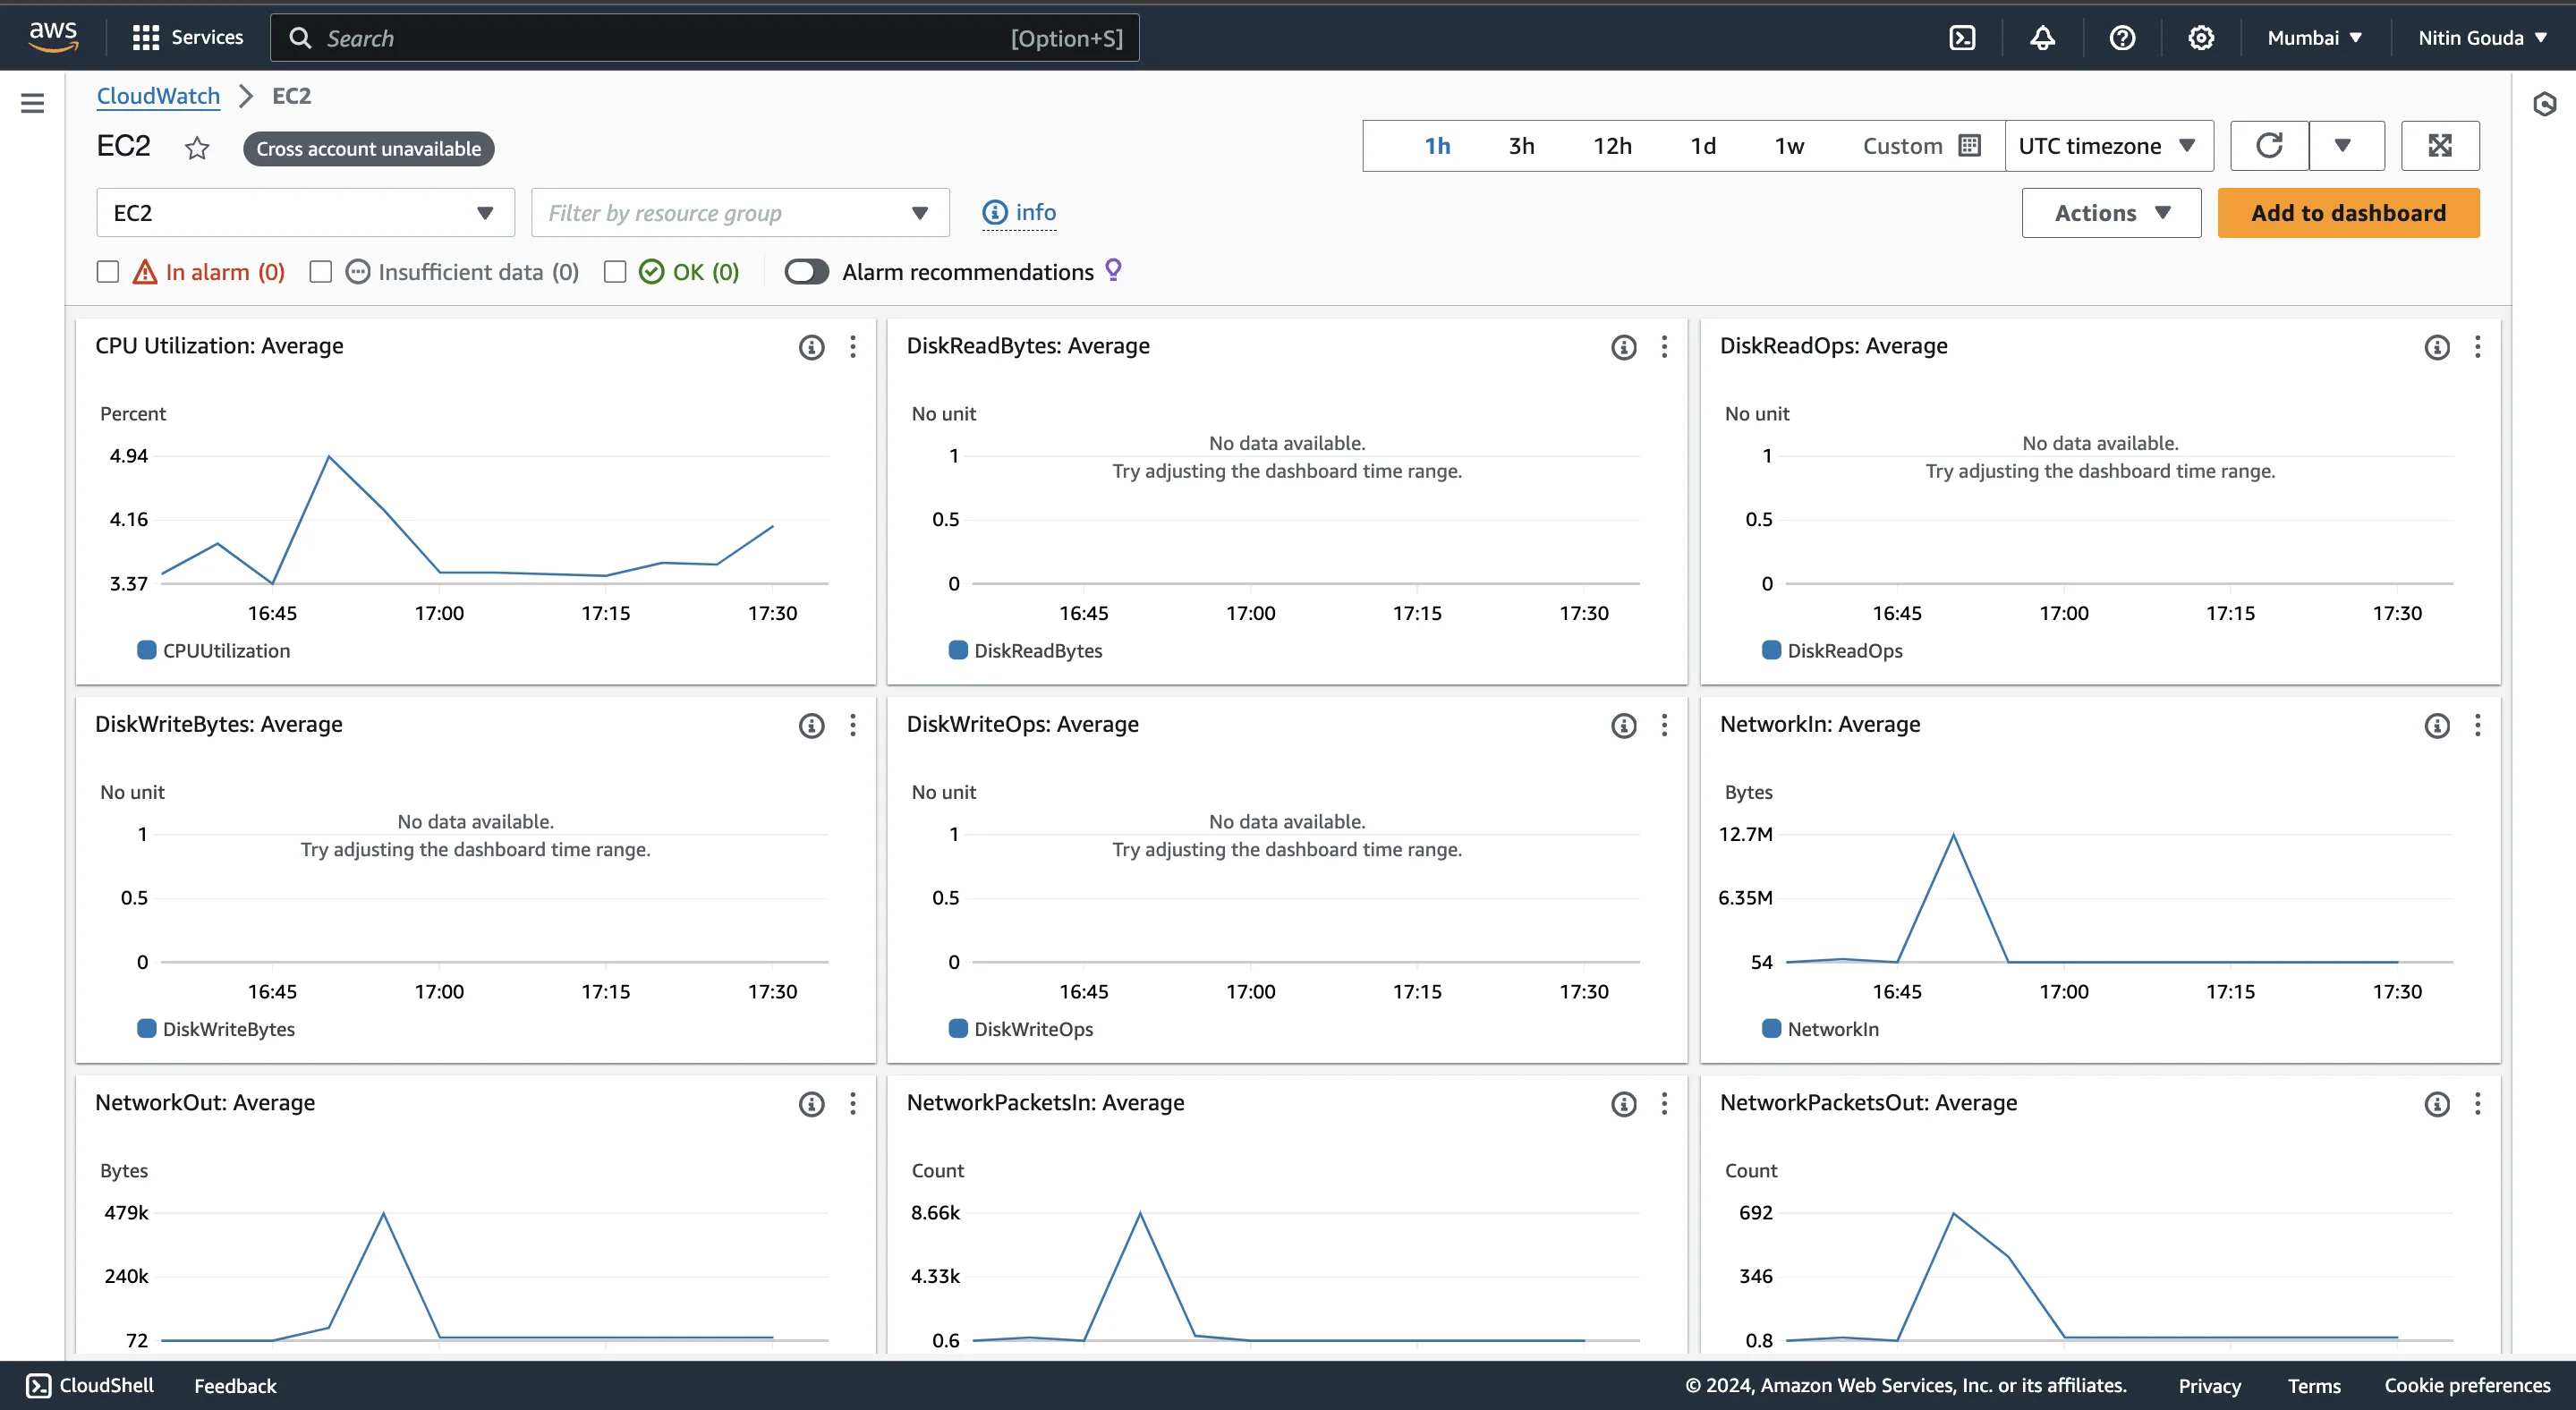
AWS CloudWatch
CloudWatch is the primary service for collecting and tracking metrics, logs, and events. It provides:
- Customizable Dashboards: Create and configure dashboards to visualize important metrics and gain a clear overview of your system’s performance. You can arrange various widgets to track different aspects of your infrastructure, allowing for tailored insights.
- Alarms: Set up alarms to automatically notify you of significant events or conditions, such as high CPU usage or low disk space. These alarms can trigger automated responses, such as scaling up resources or sending notifications, helping you manage potential issues proactively.
- Log Insights: Analyze log data to discover trends, identify patterns, and diagnose issues. Log Insights allows you to run queries on log data to extract meaningful information, which can be used to improve application performance and troubleshoot problems.
AWS X-Ray
AWS X-Ray offers distributed tracing, which provides valuable insights into how requests flow through your application. It helps you:
- Track Requests: Monitor the path of requests as they traverse various components and services within your application. This visibility helps you understand how different parts of your system interact and identify potential issues.
- Identify Bottlenecks: Detect and analyze performance bottlenecks by pinpointing where delays or inefficiencies occur in your system. This helps you optimize performance and ensure a smooth user experience.
- Troubleshoot Errors: Diagnose and resolve errors by understanding where and why issues occur within your distributed system. X-Ray provides detailed information on failures and performance issues, aiding in faster resolution.
AWS CloudTrail
AWS CloudTrail focuses on tracking API and user activity within your AWS environment. It provides:
- Event History: Access a comprehensive record of API calls and user activities, which is essential for auditing and understanding changes within your environment. This detailed history helps you track who did what and when.
- Compliance Auditing: Utilize event history to ensure that your operations meet regulatory requirements and internal policies. CloudTrail helps you maintain compliance by providing a transparent view of all actions taken within your AWS accounts.
- Security Analysis: Analyze API calls and user activities to detect and investigate potential security threats or unauthorized actions. CloudTrail’s data supports security audits and helps you respond to security incidents.
Amazon Managed Service for Prometheus and Grafana
These managed services enhance your observability with:
- Prometheus: A robust and scalable solution for collecting and storing metrics from various sources. Prometheus enables efficient performance monitoring and provides flexible querying capabilities for analyzing metric data.
- Grafana: A powerful tool for visualizing metrics and setting up alerts. Grafana allows you to create detailed dashboards and configure alerts to monitor system performance in real-time, helping you quickly respond to changes and issues.
By leveraging these AWS tools, you can implement a comprehensive observability strategy that provides detailed monitoring, analysis, and insights into your cloud infrastructure.
Understanding Metrics, Logs, and Traces in AWS
AWS provides essential observability tools to help users gain visibility into their cloud environment. The three key components—Metrics, Logs, and Traces—offer a comprehensive way to monitor, troubleshoot, and optimize your AWS applications and infrastructure. To learn more about Metrics, Logs and Traces, refer to Three Pillars of Observability.
Metrics
Metrics are quantitative data points that are collected over time. These data points help track the performance and health of your systems. Metrics are typically aggregated at intervals (such as per minute, per second, or per hour, depending on the monitoring system) and provide insight into system behaviors, such as CPU utilization, memory usage, or network activity.
Use Cases:
- Monitoring Performance Trends: Metrics help you identify how a resource or application performs over time. By analyzing trends, you can proactively respond to potential issues. Example: Monitoring CPU utilization in an EC2 instance to determine if it's consistently under or over-utilized.
- Setting Alerts: CloudWatch metrics can be paired with alarms that notify you when predefined thresholds are crossed. Example: Creating an alarm to alert you if the request count for a web application exceeds 1,000 per minute, indicating high traffic or possible service overload.
- Capacity Planning: Metrics guide infrastructure scaling by providing data on resource utilization, ensuring you're neither under-provisioned nor wasting resources. Example: Analyzing metrics over time to understand peak hours of demand, allowing you to plan resource scaling accordingly.
Logs
Logs are detailed records of events and actions occurring within your AWS environment. Logs are essential for gaining insight into the behavior of applications, security events, and system processes. AWS provides services such as CloudWatch Logs to collect, store, and manage log data.
Use Cases:
- Debugging Application Issues: Logs provide detailed information on system errors, failures, or unexpected behaviors. By analyzing log data, you can identify the root cause of problems. Example: Using application logs to trace a request that failed due to an exception, helping to pinpoint the exact location in the code that caused the error.
- Tracking User Activity: Logs can be used to audit user activities across your AWS environment, which is essential for security and compliance. Example: CloudTrail logs track all API calls made by users in your account, giving visibility into who performed specific actions, such as launching or terminating an EC2 instance.
- Security and Auditing: Logs play a key role in monitoring security events, detecting breaches, and ensuring compliance with industry regulations. Example: Analyzing security logs to detect unauthorized access attempts or unusual activities, such as multiple failed login attempts.
AWS CloudWatch Logs Insights provides powerful querying capabilities to analyze logs efficiently, helping you identify patterns, detect anomalies, and diagnose system issues quickly.
Traces
Traces are used to understand the journey of requests as they traverse through different components of a distributed system. In modern architectures like microservices, requests often travel through multiple services, making it crucial to track each step to identify bottlenecks or failures. AWS X-Ray is the service responsible for capturing distributed traces, enabling visibility into the flow of requests across your application.
Use Cases:
- Understanding Request Flow: Traces give insight into how a request travels from the frontend to backend services and databases, providing visibility into each step. Example: Tracing a user login request from the web application through the authentication service and the database, identifying if there's any delay in one of these services.
- Detecting Bottlenecks: In complex applications, delays can occur in certain services or APIs. Traces help you pinpoint where those bottlenecks exist so you can resolve performance issues. Example: Using AWS X-Ray to identify that a specific microservice is adding latency to the overall response time, prompting you to optimize that service.
- Troubleshooting Distributed Systems: Distributed applications often make debugging more challenging. Traces help visualize the end-to-end request lifecycle, making it easier to identify where errors or failures are occurring. Example: Identifying a timeout error in a specific backend service during a payment transaction process in an e-commerce application.
By using metrics, logs, and traces together, AWS observability ensures that you're not only able to monitor your system but also proactively troubleshoot and optimize it. This integrated approach provides the necessary tools to maintain high performance and resolve issues before they impact your users.
Implementing AWS Observability: Best Practices
To implement effective AWS observability, follow these steps:
Set up robust alerting and notification systems
AWS CloudWatch is a monitoring service that gathers and tracks information including CPU utilisation, memory use, and error rates. You may set alerts in CloudWatch to continually monitor these essential parameters.
Purpose of CloudWatch Alarms:
- CloudWatch alarms are designed to keep an eye on the performance and health of your AWS resources. When a metric exceeds a predefined threshold, the alarm is triggered.
- For example, you can set an alarm to notify you if CPU utilization exceeds 80% for more than 5 minutes. This alert helps you recognize when a resource is under stress, potentially leading to performance issues if not addressed promptly.
Use Simple Notification Service(SNS) Topics: Amazon Simple Notification Service (SNS) is a fully managed messaging service that enables you to send notifications or messages to a large number of recipients in a scalable and reliable manner. SNS supports various communication protocols, including email, SMS, and mobile push notifications, making it a versatile tool for alerting and automated notifications.
- SNS topics act as channels through which notifications are sent. When a CloudWatch alarm is triggered, SNS can deliver messages to multiple subscribers via different communication methods like email, SMS, or even invoking Lambda functions for automated responses.
- You can create an SNS topic and subscribe your desired communication endpoints (e.g., email addresses, phone numbers) to it.
- Link your CloudWatch alarms to the SNS topic. When an alarm is triggered, SNS will automatically send notifications to all subscribers, ensuring that your operations team is informed immediately.
- Example: Suppose you have a critical application running on AWS, and you've set a CloudWatch alarm to monitor its CPU utilization. By configuring an SNS topic linked to this alarm, you can automatically send an email alert to your operations team whenever the CPU utilization exceeds 80% for more than 5 minutes. This proactive approach allows your team to investigate and address the issue before it escalates into a more serious problem.
Implement proper tagging and resource organization
Consistent Tagging:
- Apply consistent tagging strategies across all AWS resources. Tags are key-value pairs that help categorize and manage resources effectively. Use tags to group resources by environment (e.g., development, staging, production), application, or department.
- Example: Tag EC2 instances with "Environment: Production" and "Application: WebServer" to facilitate resource management and cost tracking.
Logical Grouping:
- Organize resources into logical groups or resource pools based on their functions or roles. This organization helps streamline management and makes it easier to apply policies or monitor related resources collectively.
- Example: Group all resources related to a specific application into a resource group, making it simpler to manage and monitor those resources as a unit.
Utilize AWS-native tools for cost-effective observability Leveraging AWS-native tools is essential for implementing a cost-effective observability strategy. AWS provides powerful tools like CloudWatch Logs Insights and AWS X-Ray, which offer deep visibility into your system without the need for extensive additional infrastructure.
CloudWatch Logs Insights
- CloudWatch Logs Insights is used to search, analyze, and visualize log data. It’s especially useful for identifying trends, troubleshooting issues, and understanding system performance over time. By using this tool, you can extract meaningful information from vast amounts of log data without needing to export it to external systems.
- Example: Suppose your application is experiencing intermittent errors, and you want to identify the root cause. Using CloudWatch Logs Insights, you can run a query to search for error messages within your application logs. For instance, you could filter logs by error level, aggregate the results by the specific error type, and analyze the time of occurrence to identify patterns. This proactive analysis helps you spot recurring issues, understand their impact, and take corrective actions to enhance application reliability.
AWS X-Ray
- X-Ray is used to trace requests as they travel through your application, from the frontend to the backend, across multiple microservices. This level of visibility is crucial for understanding the internal workings of complex, distributed systems, especially when diagnosing latency issues or errors.
- Imagine a scenario where users are reporting slow response times from your application. By using AWS X-Ray, you can trace a user request from the frontend (e.g., a web or mobile application) through multiple backend services (e.g., APIs, databases). X-Ray will show you a timeline of how long each service took to process the request. If you notice that a particular microservice is causing delays, you can focus your efforts on optimizing that service, such as by improving its code or scaling its resources.
Integrate observability into your CI/CD pipeline:
Observability Checks:
- Incorporate observability checks into your Continuous Integration/Continuous Deployment (CI/CD) pipeline to ensure that new code deployments are monitored effectively.
- This includes configuring monitoring tools to track performance metrics and log data as part of the deployment process.
- Example: Include steps in your CI/CD pipeline to automatically set up new CloudWatch alarms and update existing dashboards when deploying new versions of your application.
Automate Updates:
- Automate the process of updating dashboards and alerts to reflect changes made during deployments. Ensure that monitoring tools and visualizations are kept up to date with the latest system configurations and releases.
- Example: Use deployment scripts to update Grafana dashboards with new metrics or data sources associated with the latest application version.
Overcoming Common Challenges in AWS Observability
Implementing observability in AWS can be complex, and organizations often encounter several challenges. Here’s a detailed look at these common challenges and effective solutions to overcome them.
Data Volume and Retention
Challenge: Managing large volumes of observability data in AWS environments can be overwhelming, leading to storage, retrieval, and analysis challenges that may hinder effective monitoring and decision-making.
Solution:
- Implement Log Retention Policies: Set up retention policies in CloudWatch Logs to automatically delete old data that is no longer needed. This helps in reducing storage costs and keeping your logs manageable. For instance, you might choose to retain application logs for 30 days while keeping critical security logs for a longer duration.
- Use CloudWatch Logs Insights for Efficient Log Querying: CloudWatch Logs Insights allows you to efficiently query large volumes of log data without sifting through it manually. This can save time and resources when diagnosing issues or analyzing trends. The tool's powerful query language lets you filter and analyze logs quickly, helping you focus on the most relevant data.
- Leverage S3 for Long-Term Storage of Historical Data: Consider exporting logs to Amazon S3 for longer-term data storage. S3 is a cost-effective and scalable option for long-term storage, allowing you to preserve historical logs that are seldom viewed yet necessary for compliance or auditing.
Security and Compliance
Challenge: Ensuring that observability data in AWS environments is secure and compliant with regulations is challenging, as it involves safeguarding sensitive information while adhering to industry standards and legal requirements.
Solution:
- Use IAM Roles to Control Access to Observability Data: Use AWS Identity and Access Management (IAM) roles to implement rigorous access constraints. By assigning precise roles and permissions, you can guarantee that important observability data is only accessible to authorised people and services, lowering the risk of unauthorised access.
- Encrypt Data at Rest and in Transit: Protect your observability data by encrypting it both at rest and in transit. AWS provides several encryption options, including AWS Key Management Service (KMS), to secure your data. This is particularly important for compliance with regulations that mandate data protection measures.
- Implement Audit Trails Using CloudTrail AWS CloudTrail provides detailed logs of API activity across your AWS environment. By enabling CloudTrail, you can maintain a comprehensive audit trail that records who accessed what data and when, supporting both security and compliance efforts.
Cost Management
Challenge: Implementing observability in AWS environments can result in unexpected costs, making it difficult to manage budgets while maintaining comprehensive monitoring and visibility across the infrastructure.
Solution:
- Use CloudWatch Contributor Insights to Identify Top Contributors to Costs: CloudWatch Contributor Insights helps you analyze your observability data to identify the most significant contributors to your costs. By pinpointing specific services, users, or actions that generate high volumes of logs or metrics, you can take targeted actions to optimize and reduce expenses.
- Implement Data Sampling for High-Volume Metrics: For metrics that are collected at high volumes, consider using data sampling techniques to reduce the amount of data processed and stored. By sampling data, you can maintain visibility into system performance while keeping costs under control.
- Regularly Review and Optimize Your Observability Setup: Conduct periodic reviews of your observability configuration to identify areas where you can cut costs. This might involve adjusting retention policies, consolidating dashboards, or optimizing data collection practices.
Multi-Account and Multi-Region Observability
Challenge: Maintaining consistent observability across complex AWS environments, especially in multi-account and multi-region setups, poses significant challenges in ensuring unified monitoring, efficient data collection, and comprehensive visibility.
Solution:
- Use AWS Organizations for Centralized Management: AWS Organisations enables you to centrally manage many AWS accounts inside your organisation. Creating a hierarchical account structure allows you to impose similar observability policies across all settings, simplifying management and increasing visibility.
- Implement Cross-Account and Cross-Region CloudWatch Dashboards: CloudWatch supports cross-account and cross-region dashboards, enabling you to monitor metrics from different accounts and regions in a single, unified view. This helps maintain a consistent observability strategy across your entire AWS environment, regardless of its complexity.
- Leverage AWS Control Tower for Standardized Observability Setups: AWS Control Tower provides a framework for setting up and governing a multi-account AWS environment. By using Control Tower, you can enforce standardized observability setups, ensuring that all accounts adhere to the same monitoring and logging practices from the start.
Advanced AWS Observability Techniques
Custom Metrics and Dimensions
Custom metrics allow you to track application-specific data points that standard metrics might not cover. By creating these metrics, you can monitor aspects of your application that are critical to your business, such as user interactions, transaction rates, or any other custom events.
Example: Suppose you want to monitor the number of user logins in a specific region. You can create a custom metric called UserLogins and add a dimension for Region to filter and analyze this data by geographical location. This enables you to see how user activity varies across different regions.
import boto3

cloudwatch = boto3.client('cloudwatch')

# Publish a custom metric
cloudwatch.put_metric_data(
    Namespace='MyApplication',
    MetricData=[
        {
            'MetricName': 'UserLogins',
            'Dimensions': [
                {
                    'Name': 'Region',
                    'Value': 'US-West'
                },
            ],
            'Value': 1
        },
    ]
)
In this example, every time a user logs in, a data point is sent to AWS CloudWatch, allowing you to monitor and respond to trends in user logins over time.
AWS Lambda Extensions for Serverless Observability
In serverless situations where typical monitoring tools may not be applicable, AWS Lambda extensions provide a strong option to improve observability. These extensions enable you to capture telemetry data like logs, metrics, and traces without having to change your Lambda function code.
How It Works: Lambda extensions operate within the Lambda execution environment and may collect data directly from the runtime, providing information on performance, execution times, and problems. This is especially handy when you wish to monitor functions that communicate with other AWS services or external APIs. Lambda extensions provide more insights into how your serverless applications function, making it simpler to debug and optimise performance.
Machine Learning for Anomaly Detection
Amazon CloudWatch Anomaly Detection is an advanced function that employs machine learning to automatically detect strange trends in your measurements. This is especially useful in dynamic contexts where performance may change owing to a variety of variables.
Why It is Important: Traditional threshold-based warnings may overlook minor issues or produce too many false positives. In contrast, anomaly detection uses past data to build a baseline of typical behaviour. When measurements diverge from this baseline, CloudWatch notifies you of possible issues before they worsen.
For example, if your application's request rate suddenly jumps or declines in an odd way compared to previous patterns, Anomaly Detection will highlight it as a problem, allowing you to examine and respond promptly.
Cross-Account Observability
In complex AWS environments, you may have multiple accounts handling different aspects of your operations, such as development, production, and testing. Cross-account observability helps you centralize monitoring across these accounts, providing a unified view of your infrastructure.
Steps to Implement:
- Set Up a Central Observability Account: Designate one AWS account as the central observability hub.
- Use CloudWatch Cross-Account Observability: Configure CloudWatch to collect and aggregate data from all your AWS accounts into the central account. This setup enables you to monitor logs, metrics, and traces across your entire environment from a single location.
- Create Consolidated Dashboards: Build dashboards that pull in data from all connected accounts, giving you a comprehensive view of your AWS ecosystem. These dashboards allow you to monitor key performance indicators, detect issues, and analyze trends across your entire organization.
By following these advanced techniques, you can enhance your AWS observability practices, making them more robust, scalable, and effective at identifying and addressing issues across your infrastructure.
Enhancing AWS Observability with SigNoz
To effectively monitor AWS Services, using an advanced observability platform like SigNoz can be highly beneficial. SigNoz is an open-source observability tool that provides end-to-end monitoring, troubleshooting, and alerting capabilities for your applications and infrastructure.
Here's how you can leverage SigNoz for AWS Monitoring solutions:
- Create a SigNoz Cloud Account
SigNoz Cloud provides a 30-day free trial period. This demo uses SigNoz Cloud, but you can choose to use the open-source version.
SigNoz cloud is the easiest way to run SigNoz. Sign up for a free account and get 30 days of unlimited access to all features.
You can also install and self-host SigNoz yourself since it is open-source. With 20,000+ GitHub stars, open-source SigNoz is loved by developers. Find the instructions to self-host SigNoz.
- Using SigNoz AWS Monitoring:
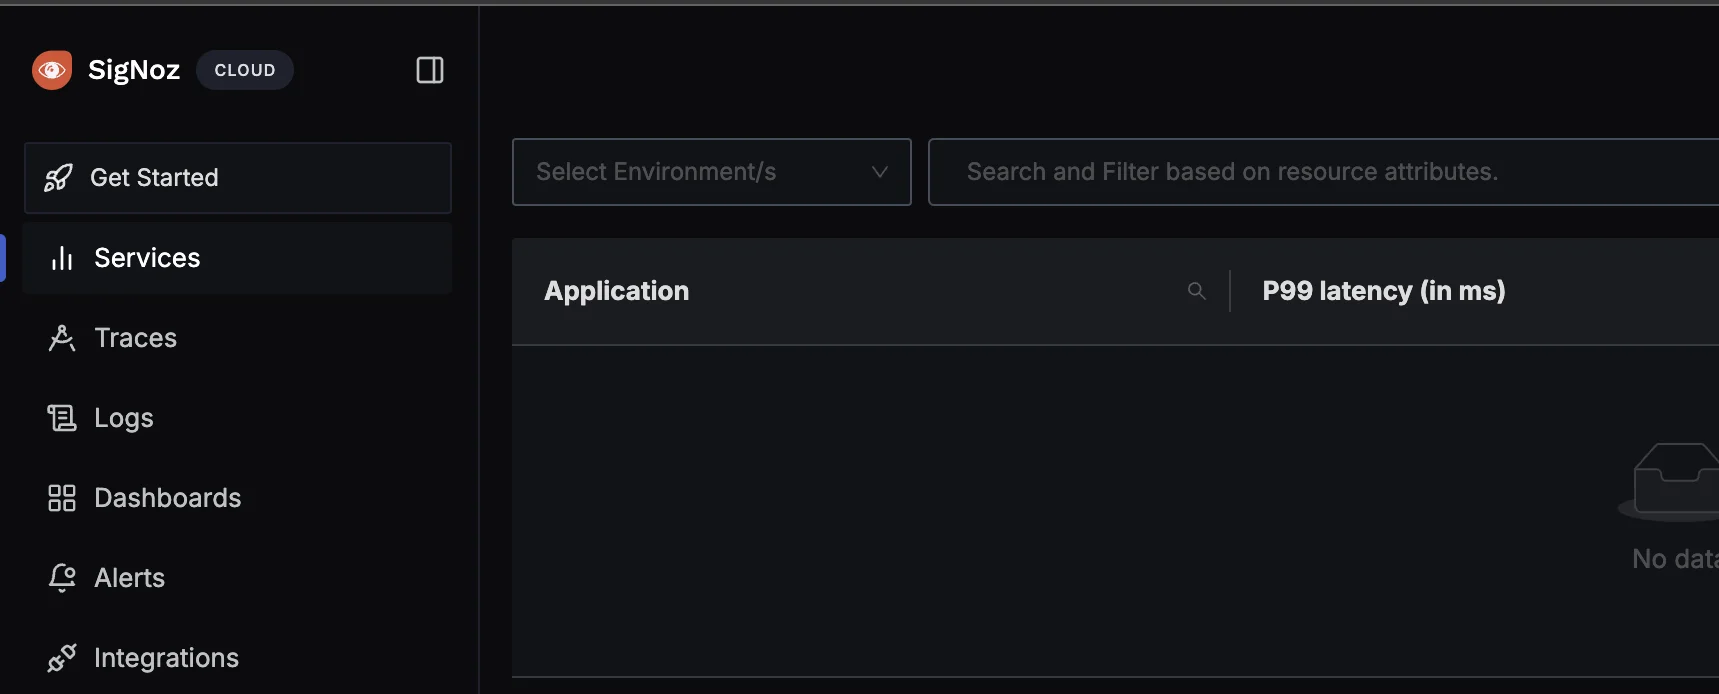
In the top left corner, click on Get Started.
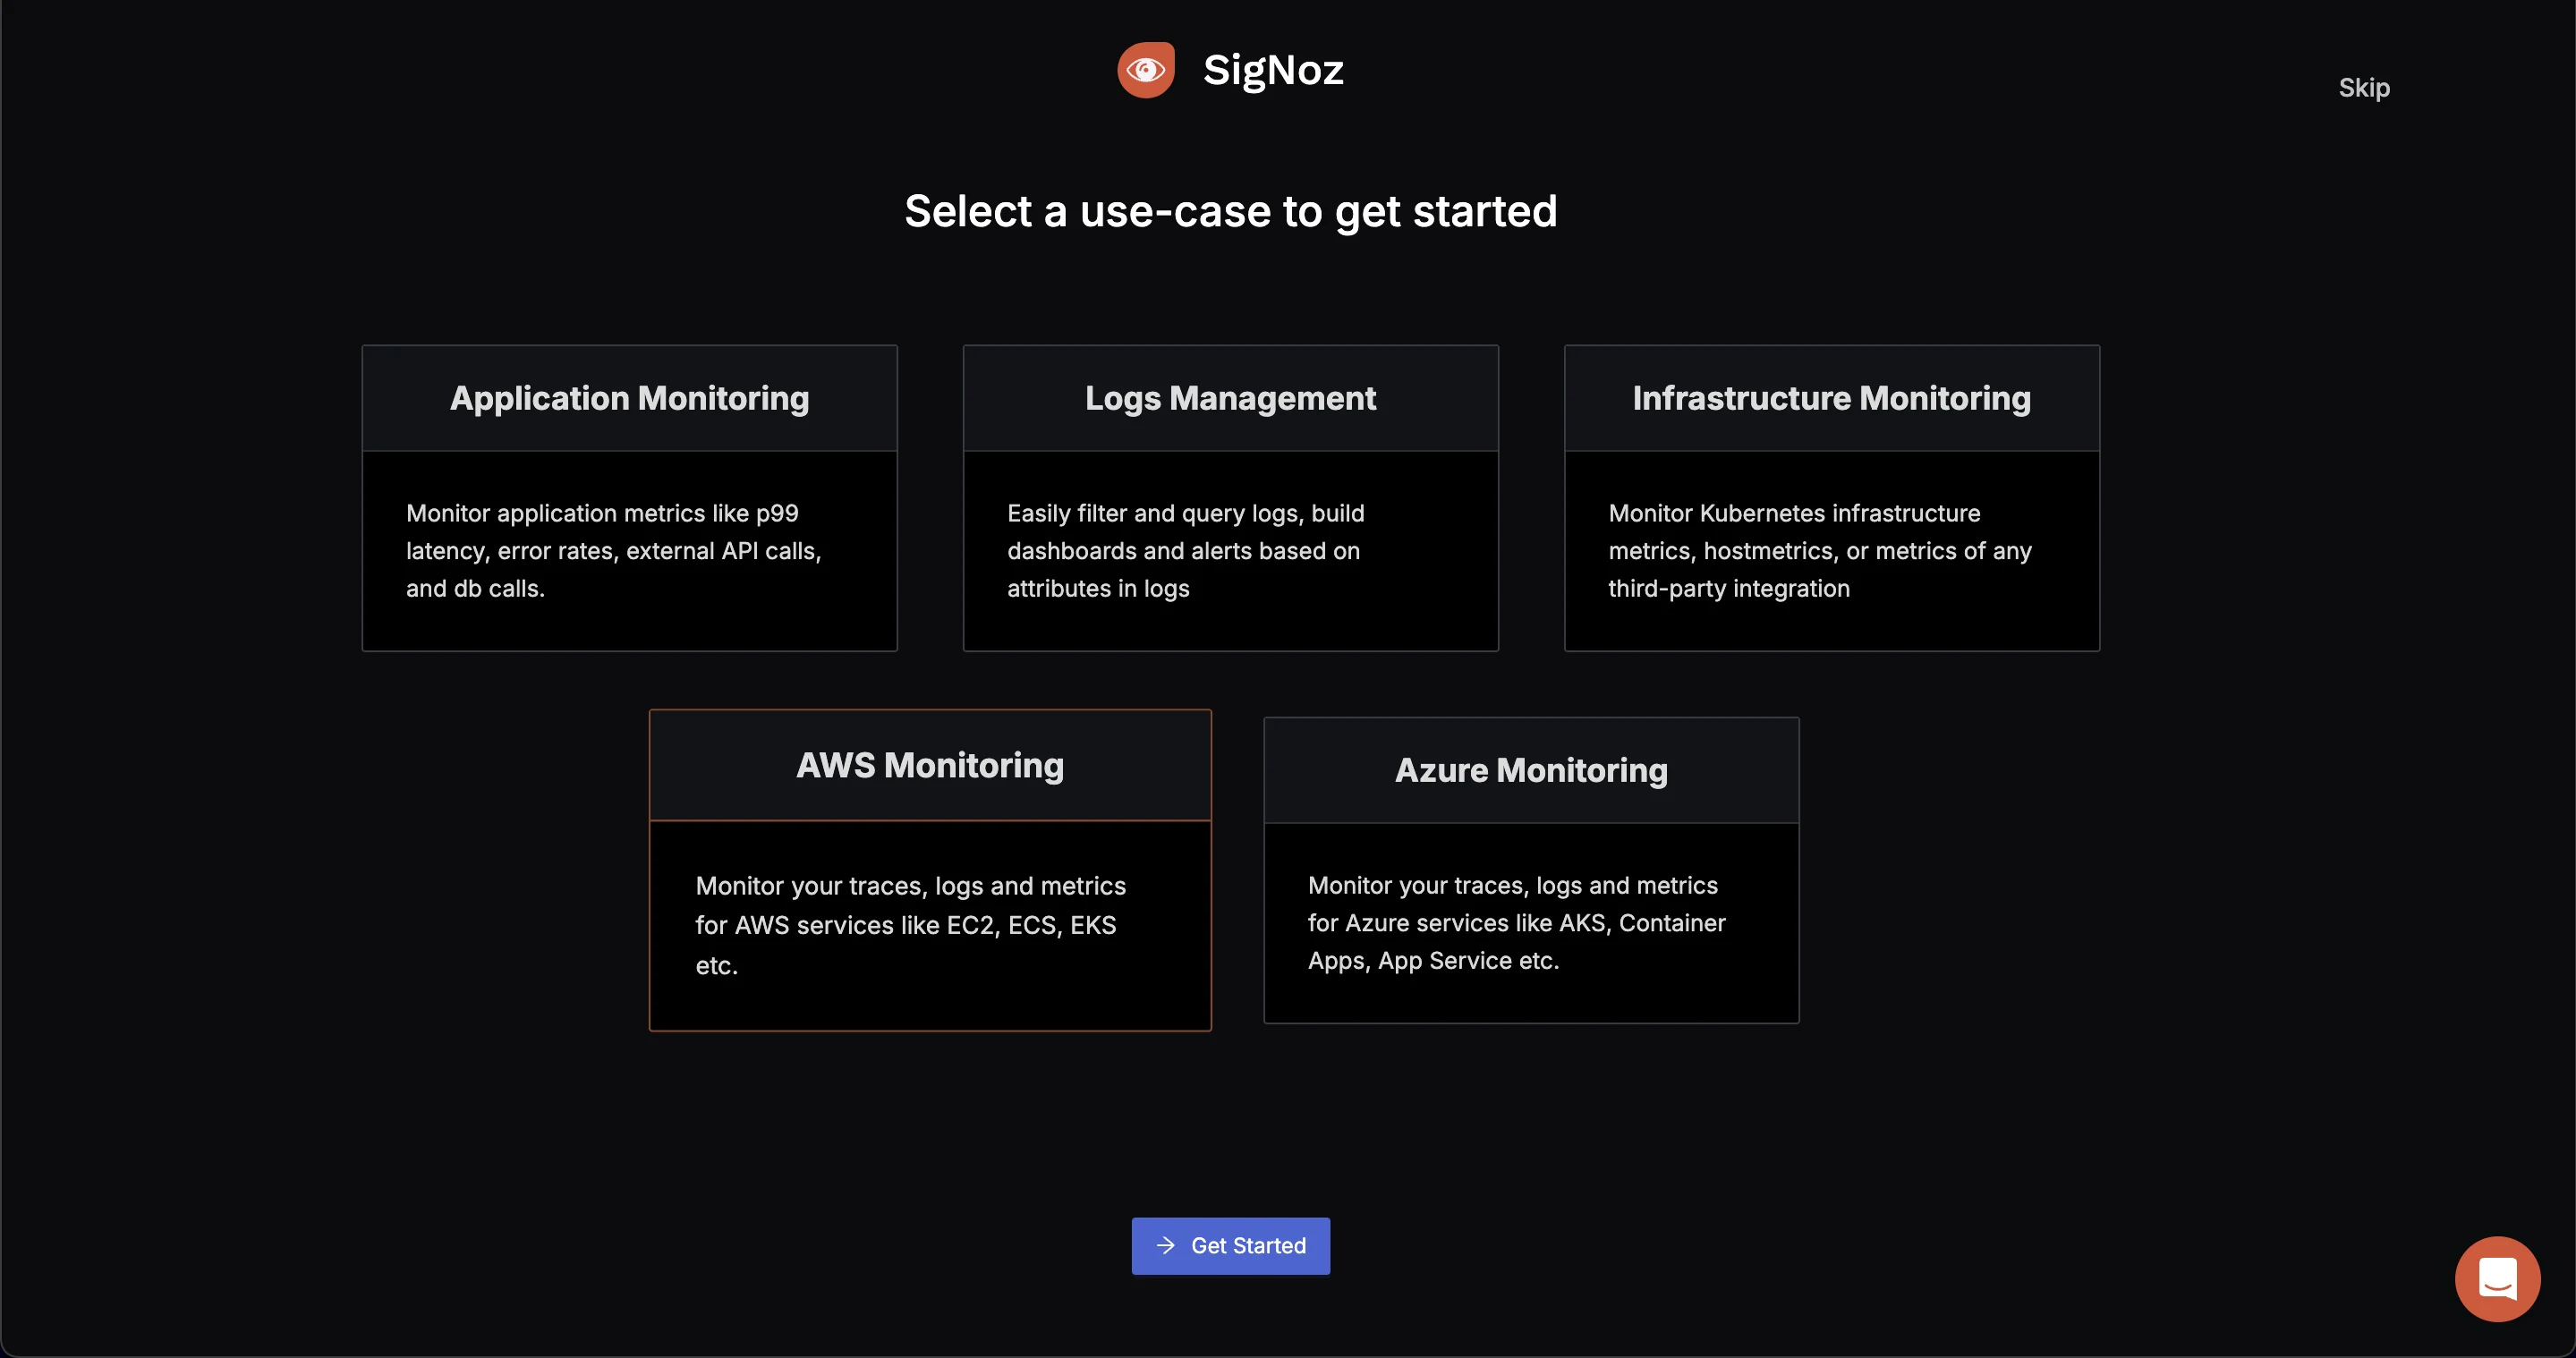
You will be redirected to “Get Started Page”. Choose AWS Monitoring.
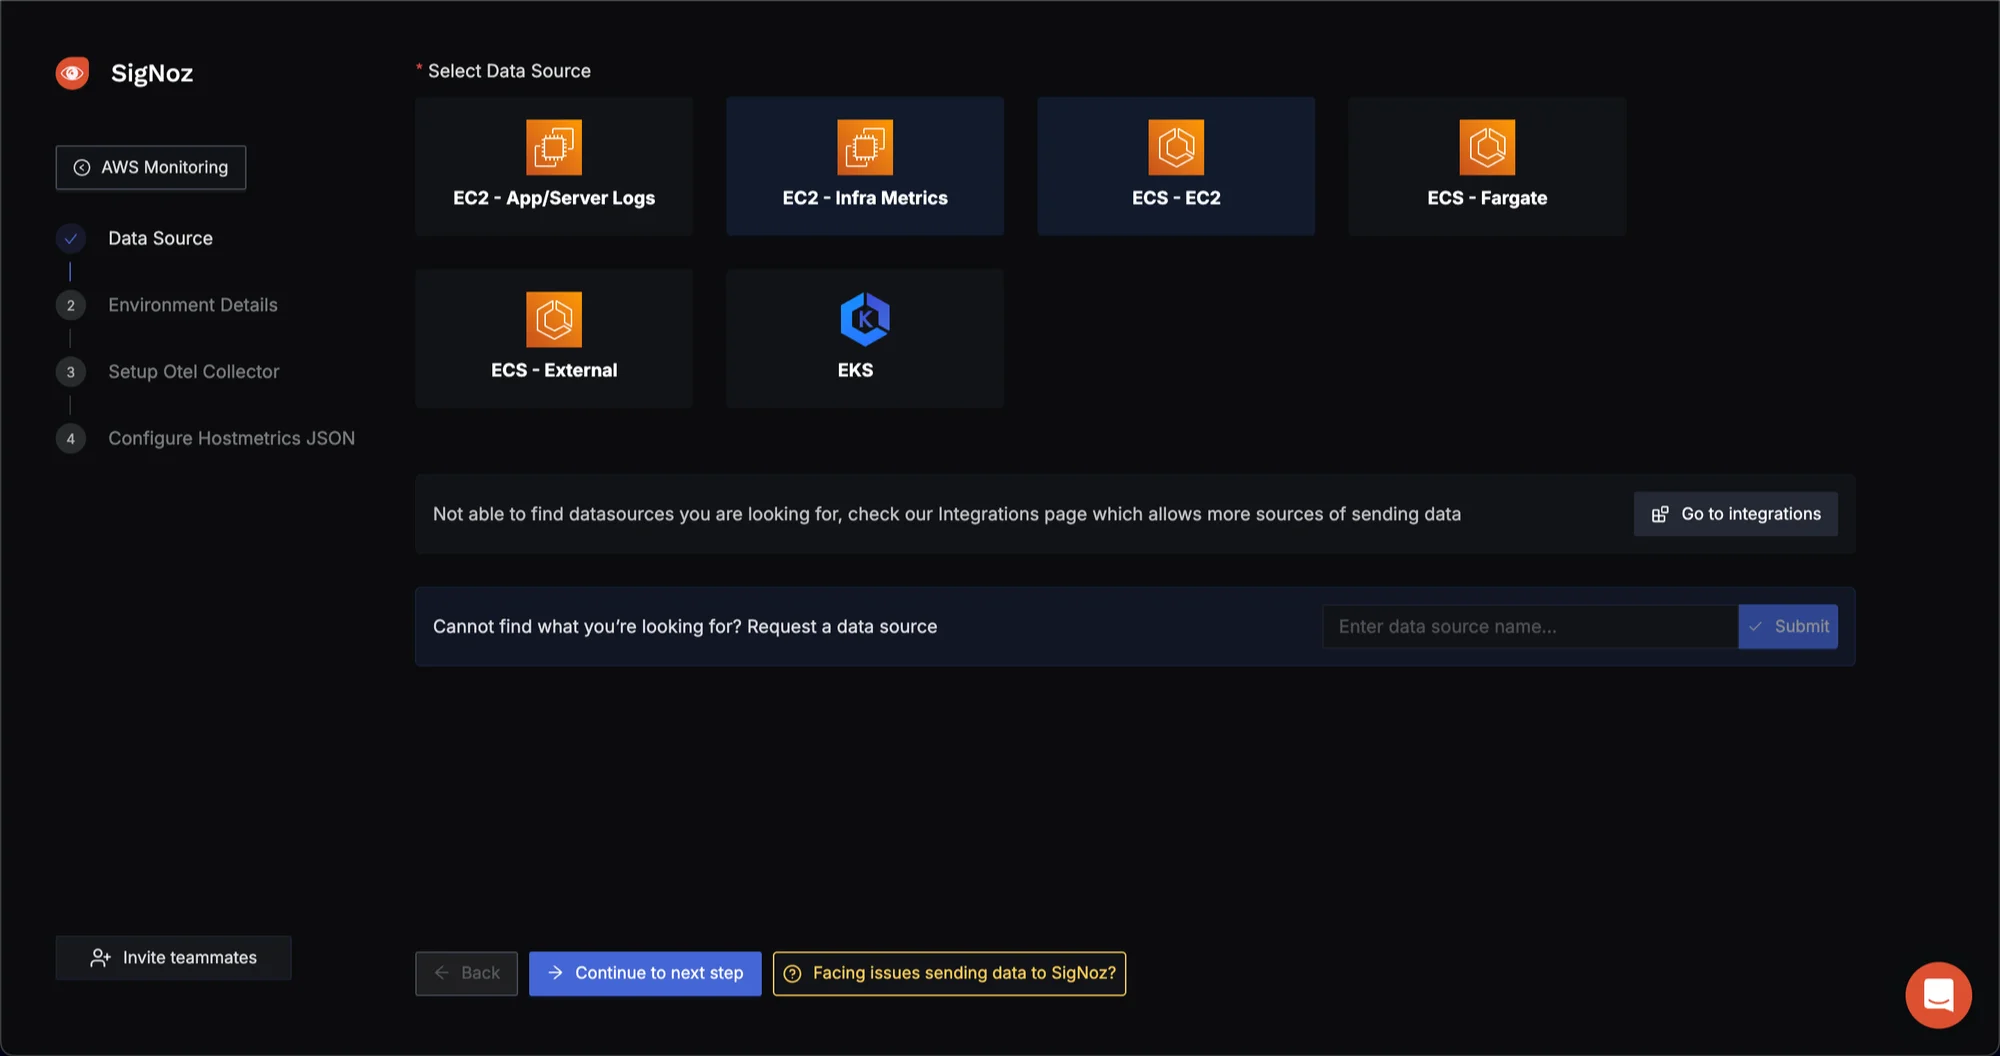
- Select Data Source: You need to select the Data Source. Since the metrics to be collected here are from the EC2 Infrastructure, select
EC2 - Infra Metrics.
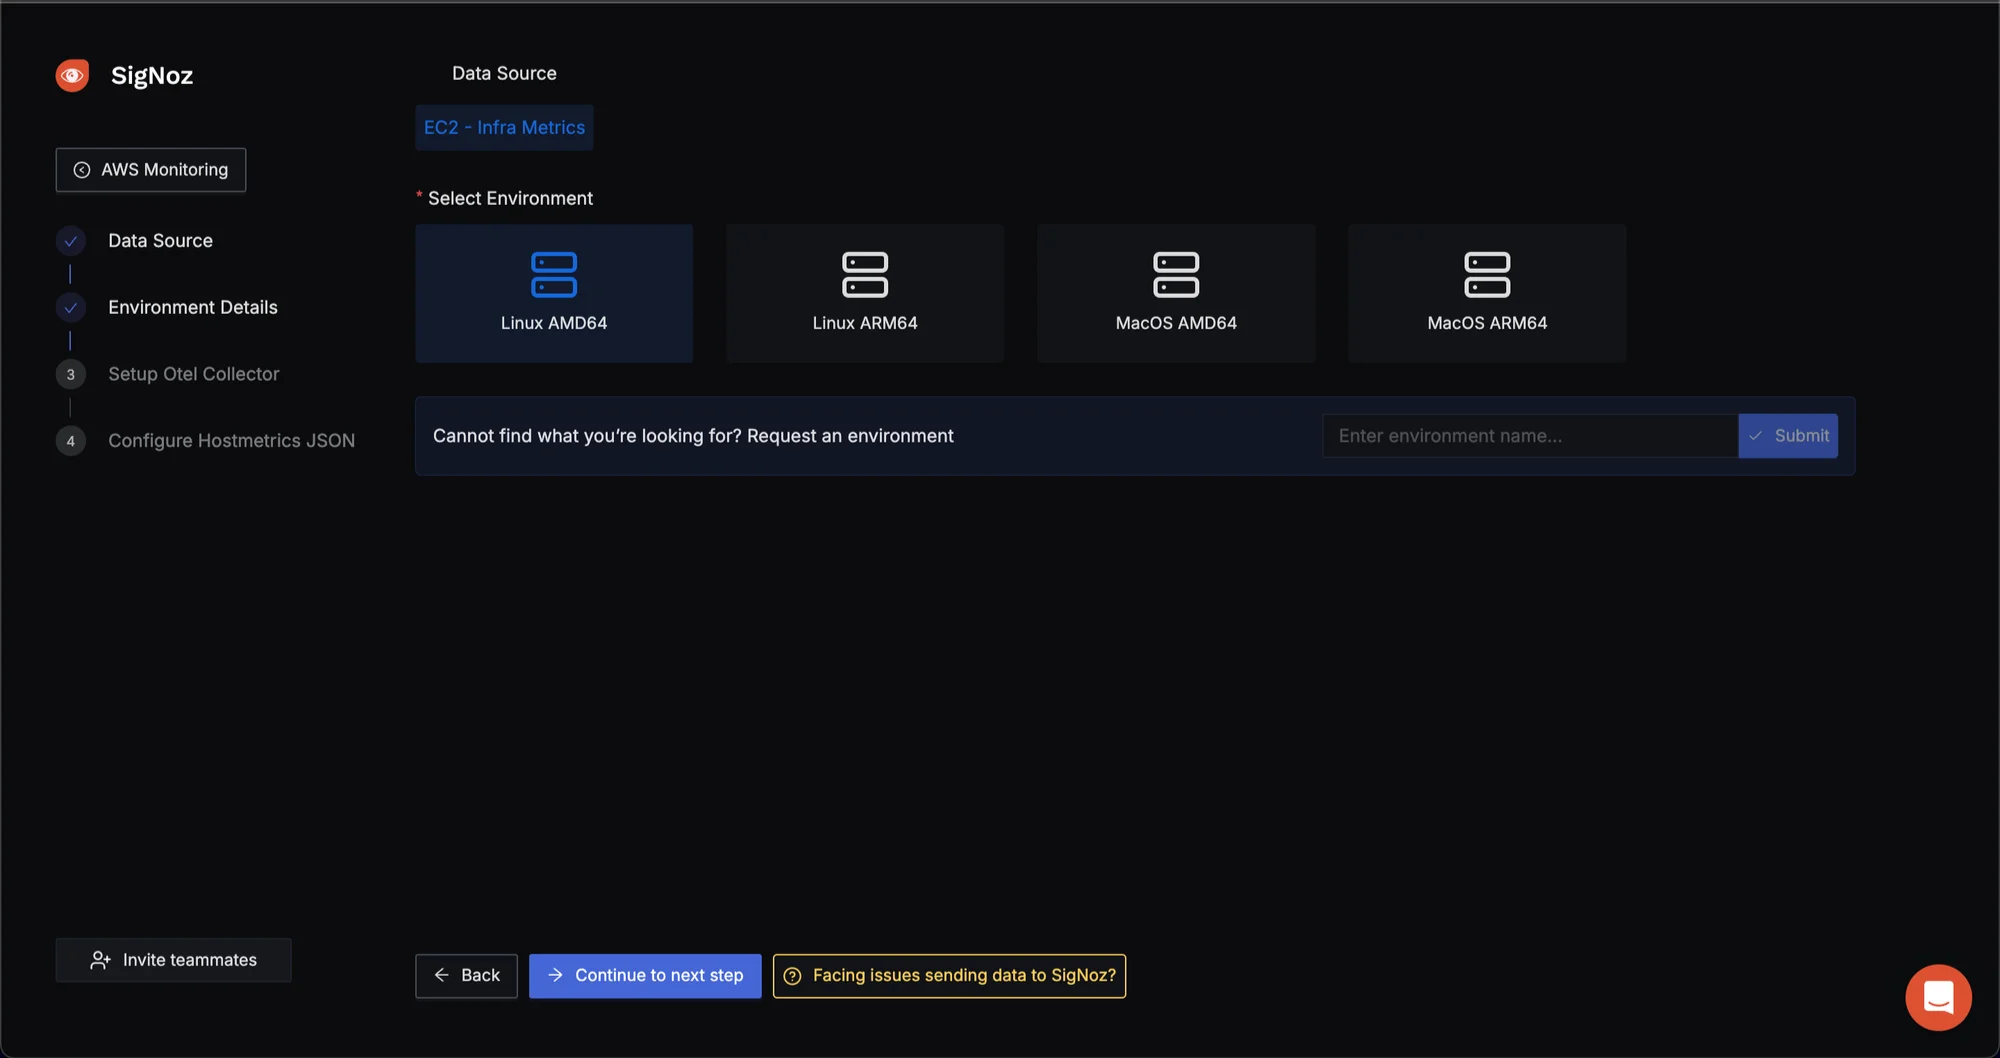
Choose the environment of your host system. For this demo, I am using my AWS EC2 t2.micro Instance, which is Linux AMD64, choose according to your infrastructure.
Setup OpenTelemetry Binary as an agent: Follow the steps in the SigNoz Cloud section of this tutorial to get your Otel Collector agent up and running.
Note: Download the latest version of the Otel Collector that matches your host operating system.
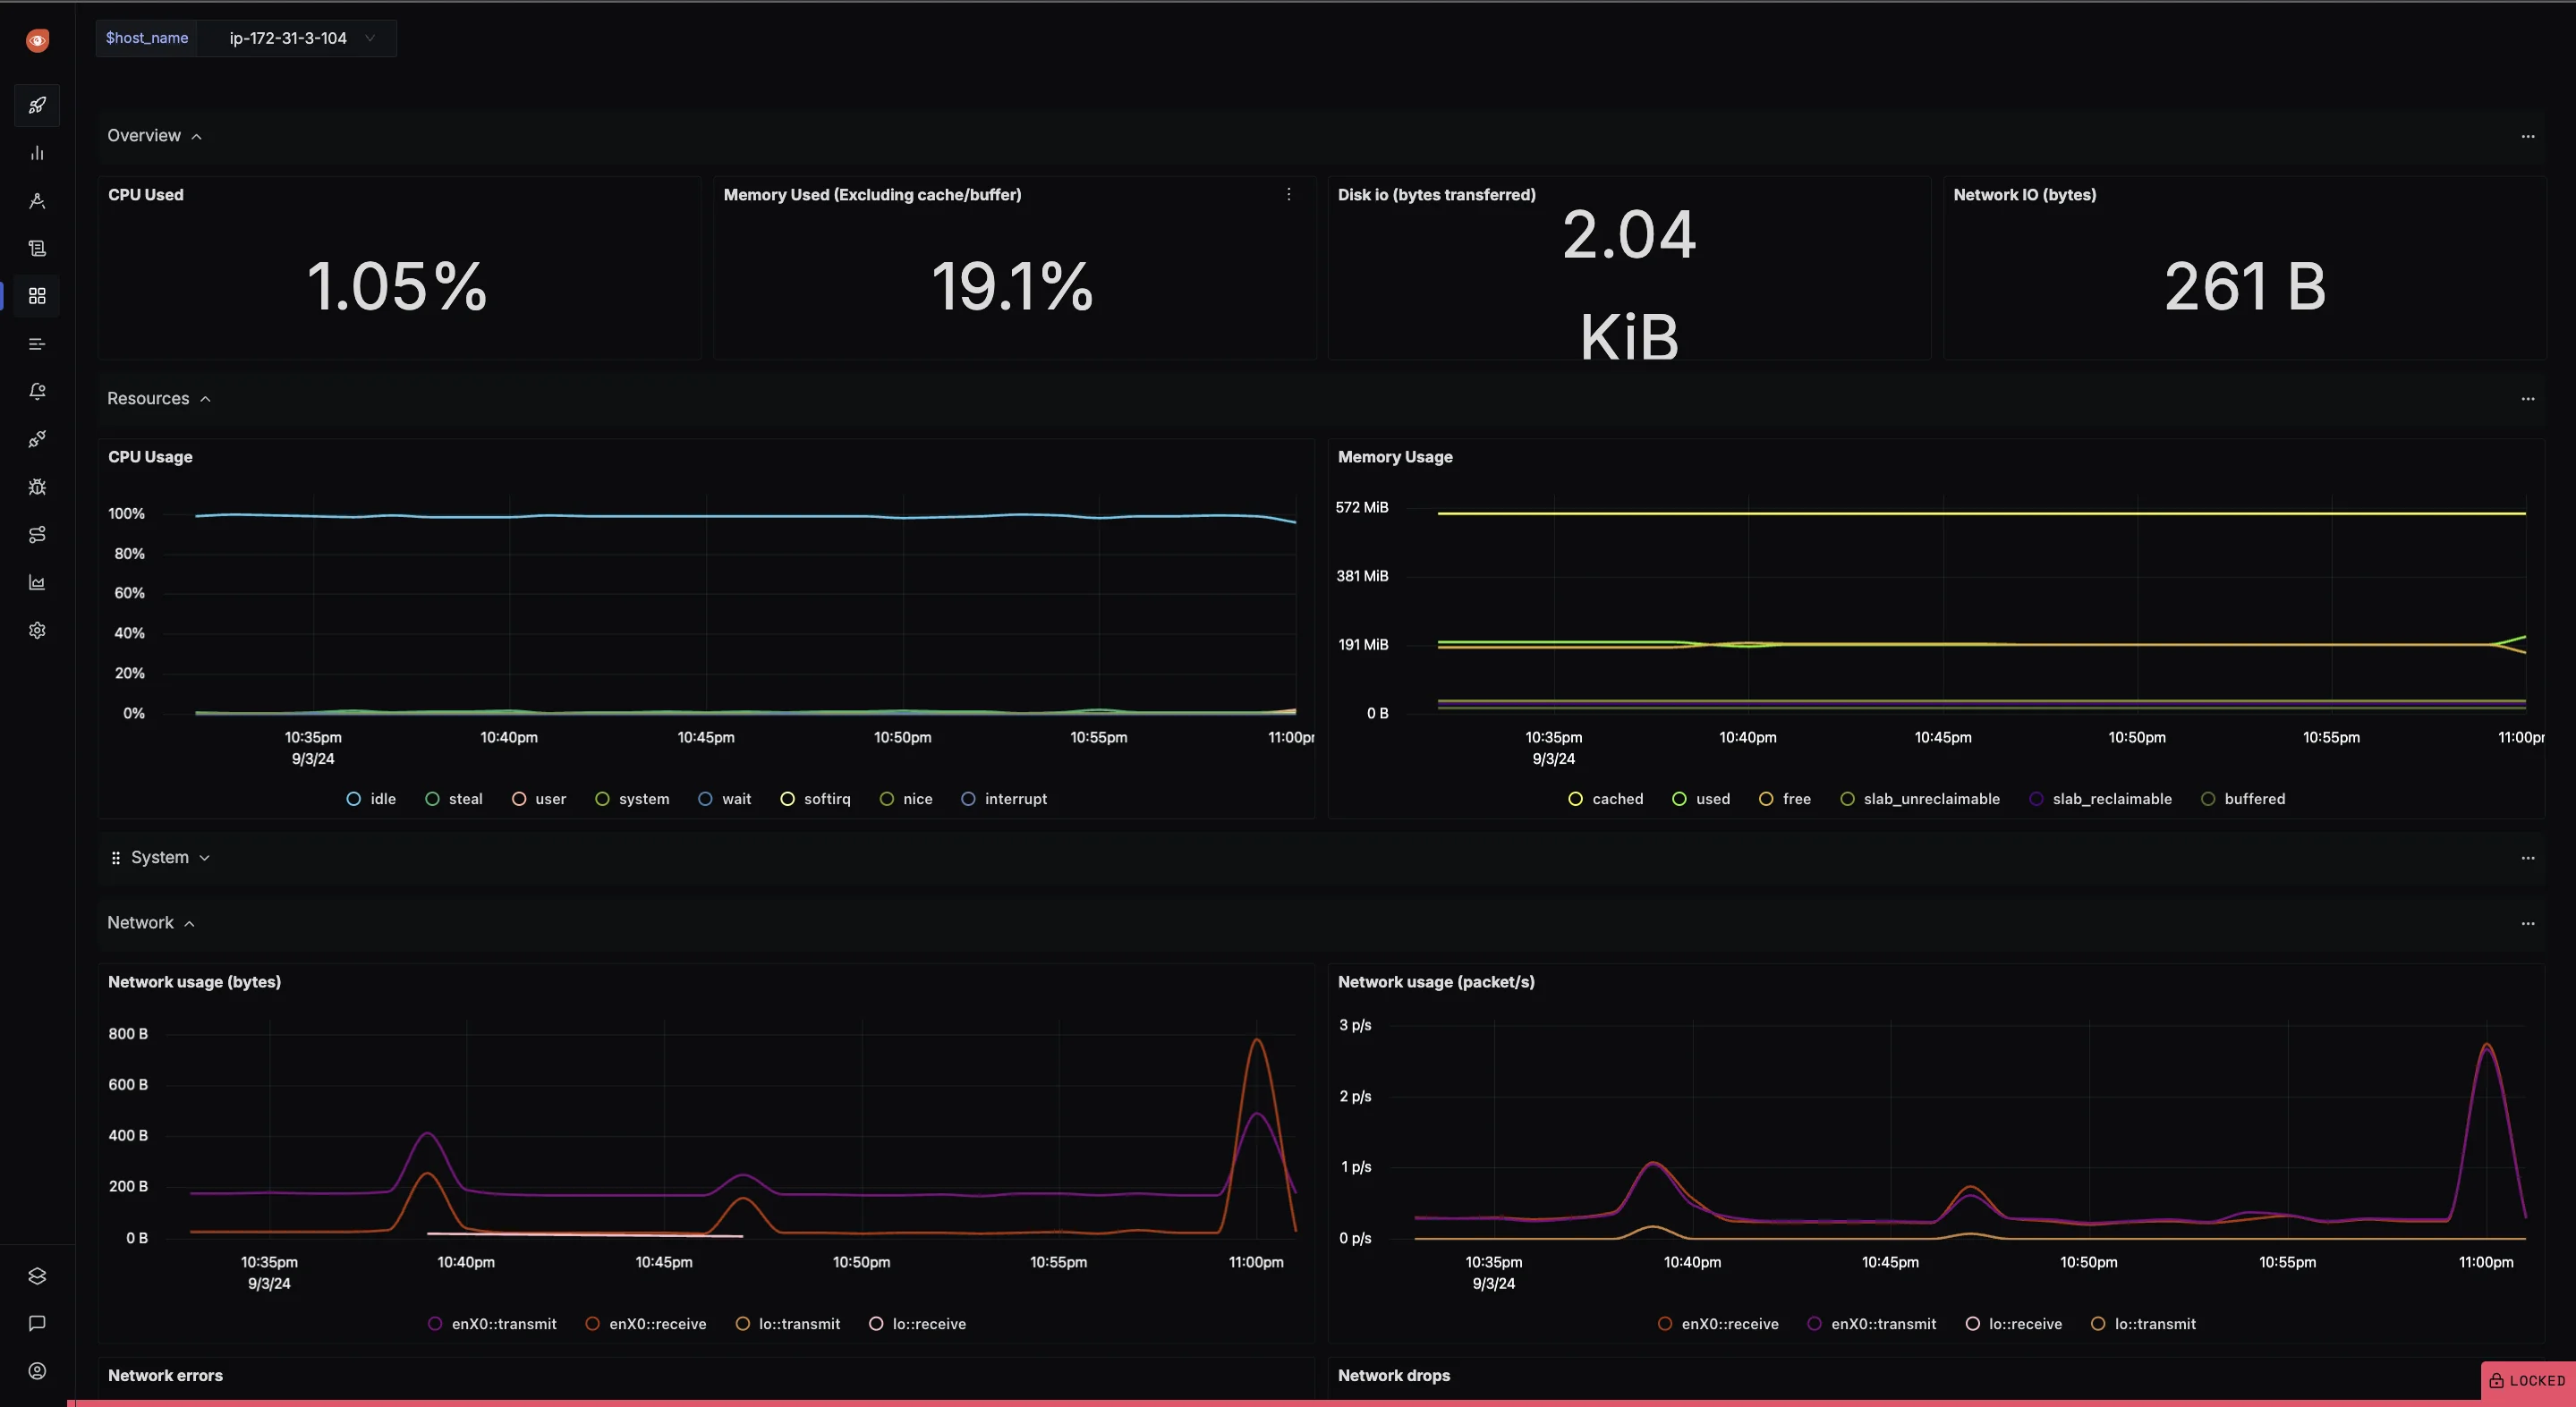
Configure the Host Metrics Dashboard: To send host metrics to SigNoz, refer to the documentation for detailed instructions.
Key Takeaways
- AWS observability integrates metrics, logs, and traces to provide a complete view of system performance and behavior.
- Use AWS tools like CloudWatch for metrics and logs, X-Ray for tracing, and CloudTrail for tracking API calls and user activity.
- Implement effective alerting, consistent tagging, and integrate observability into CI/CD pipelines to improve monitoring and response.
- Address challenges such as managing data volume, ensuring security, and controlling costs.
- Utilize advanced methods and third-party tools like SigNoz for enhanced observability and deeper insights.
- Use custom metrics and logs tailored to your applications for more relevant insights and improved monitoring accuracy.
- Employ real-time data processing to quickly identify and address issues, minimizing their impact.
- Apply cross-account monitoring to consolidate observability across multiple AWS accounts.
- Explore automated remediation to proactively address issues and reduce manual intervention.
- Ensure observability practices meet compliance requirements and support auditing for better security and regulatory adherence.
FAQs
What's the difference between monitoring and observability in AWS?
Monitoring: Monitoring involves the systematic gathering and analysis of predefined metrics and logs to track system performance and health. It focuses on recognized measures like CPU utilization or memory consumption and is crucial for detecting and responding to anticipated issues.
Observability: Observability, on the other hand, takes a more comprehensive approach, enabling a deep understanding of system behavior by correlating various data sources. It extends beyond monitoring by allowing the exploration and analysis of a system's internal states without predefined metrics. Essentially, monitoring observes specific data points, while observability comprehends the broader context and underlying causes of any anomalies.
How does AWS observability help in reducing cloud costs?
AWS observability helps reduce cloud costs by providing detailed insights into how your resources are used. It enables you to:
- Right-size resources: By analyzing usage patterns, you can adjust the size of your instances and other resources to match actual demand, avoiding over-provisioning.
- Eliminate waste: Observability tools identify underutilized or idle resources, allowing you to shut them down or consolidate them, reducing unnecessary expenses.
- Optimize architecture: With a clearer understanding of resource utilization, you can design more cost-effective architectures, ensuring you only pay for what you need.
Can AWS observability tools work with non-AWS resources?
Yes, many AWS observability solutions are compatible with non-AWS resources. Amazon CloudWatch, for example, may collect bespoke data from on-premises servers or cloud-based apps, resulting in a unified picture of your whole infrastructure.
What are the key considerations when implementing observability in a multi-account AWS environment?
- Centralized management of observability data: Ensure all observability data is collected and managed in a central location for easier access and analysis.
- Consistent tagging and naming conventions: Use uniform tags and naming conventions across all accounts to simplify data organization and retrieval.
- Scalable data collection and storage solutions: Design solutions that can handle the growing volume of observability data across multiple accounts without compromising performance.
- Cross-account access controls: Implement robust access controls to ensure that the right stakeholders can access the observability data they need while maintaining security.
- Create dashboards that combine data from all accounts, giving you a full picture of your AWS environment for better monitoring and insights.
