Monitoring containerized environments effectively is crucial for debugging, capacity planning, and maintaining uptime. In this guide, we'll walk through a hands-on setup of Prometheus and Grafana entirely on Docker, ideal for local development, POCs, or staging environments, no Kubernetes required.
Why Use Docker for Prometheus and Grafana?
Docker simplifies and secures the deployment of Prometheus and Grafana with these key benefits:
Isolation & Security
Containers provide process isolation via namespaces and cgroups. Combined with Docker's security features like seccomp and read-only filesystems, this reduces risk and surface area for attacks.
Persistent Storage
Docker volumes retain Prometheus TSDB data and Grafana configs across restarts, ensuring observability data isn’t lost during container lifecycle events.
Network Control
Docker networks (bridge, overlay) enable secure, isolated communication. Port mapping and firewall rules limit external exposure (e.g., 9090, 3000), enhancing security.
Environment Consistency
Docker guarantees consistent behavior across dev, staging, and prod, eliminating environment drift and simplifying debugging.
Prerequisites for Installing Prometheus and Grafana on Docker
Before setting up, ensure the following prerequisites are met to avoid compatibility or runtime issues:
- Docker ≥ 20.10 and Docker Compose ≥ 1.29 installed. Install Docker | Install Compose
- System resources: Minimum 2 vCPUs, 4 GB RAM, and 2 GB of free disk space.
- Open ports: Ensure default ports — 9090 (Prometheus), 3000 (Grafana), and optionally 8080 (cAdvisor) — are available, unless you've configured these services to use different ports.
- Administrative privileges:
sudoor root access to install Docker and manage containers.
Step-by-Step Guide to Install Prometheus on Docker
Prometheus is a robust monitoring and alerting system, and Docker makes it easy to deploy and manage. Follow these steps to containerize Prometheus using Docker Compose.
Create a Dedicated Docker Network
Create a user-defined bridge network for Prometheus and Grafana to enable container-to-container communication without exposing internal ports externally.
docker network create monitoring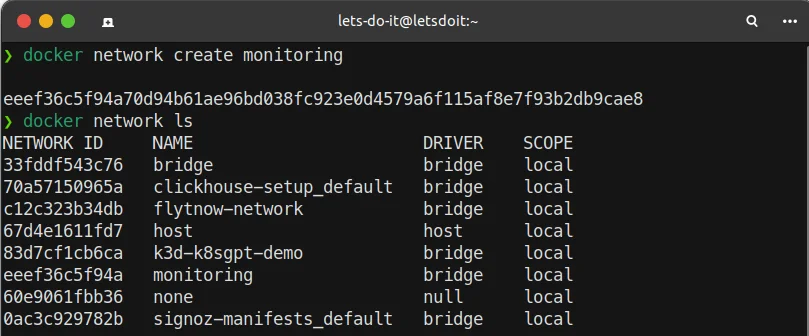
command: docker network ls Create a Prometheus Configuration File
Define scrape settings and specify the Prometheus server itself as a target in a file named
prometheus.yml:global: scrape_interval: 15s # Frequency of metric scraping scrape_configs: - job_name: 'prometheus' static_configs: - targets: ['localhost:9090']📌 This configuration tells Prometheus to scrape metrics from itself every 15 seconds.
Create a Docker Compose File
Define the Prometheus container setup in
docker-compose.yml. Pin the image version for stability and map the configuration file as a volume.version: '3.8' services: prometheus: image: prom/prometheus:v2.52.0 container_name: prometheus ports: - "9090:9090" volumes: - ./prometheus.yml:/etc/prometheus/prometheus.yml networks: - monitoring restart: unless-stopped networks: monitoring: external: true📝 Using
restart: unless-stoppedensures Prometheus restarts automatically if it crashes or the system reboots.Launch Prometheus
Start the service in detached mode:
docker-compose up -dVerify Prometheus is Running
Check if the container is active:
docker psYou should see the
prometheuscontainer listed and listening on port9090.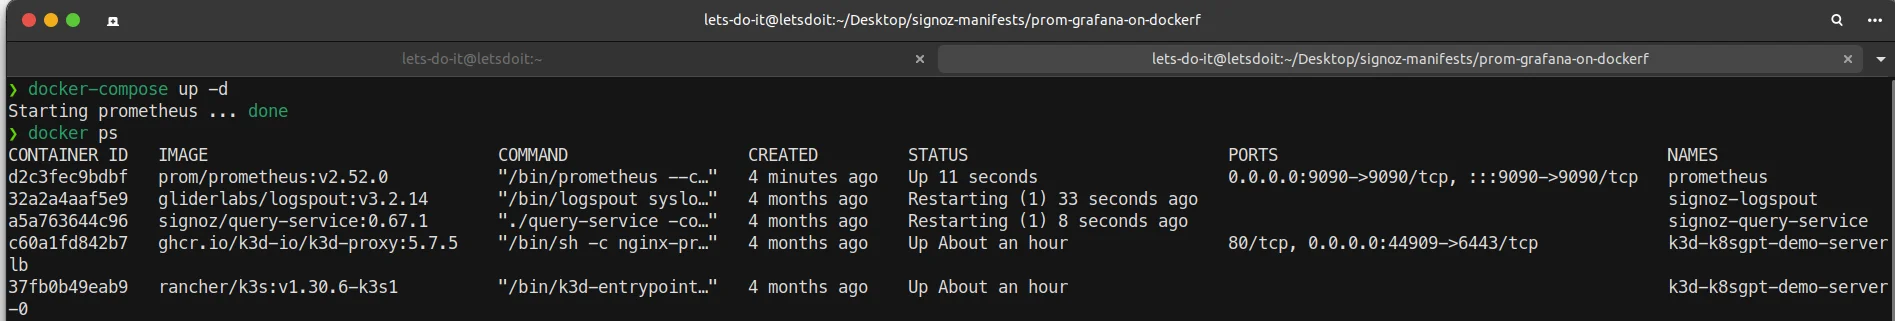
command: docker ps Access the Prometheus UI
Navigate to http://localhost:9090 in your browser. You should see the Prometheus web interface.
Troubleshooting
If Prometheus doesn't start:
Check logs:
docker-compose logs prometheusEnsure the config file path and syntax are correct.
Confirm port
9090is not in use.
Configuring Prometheus for Metric Collection
To monitor your services, Prometheus must know where to pull metrics from. This is done by defining scrape jobs in the configuration file.
Add a New Scrape Job to
prometheus.ymlEach job in Prometheus represents a set of targets that expose metrics. Update your configuration file to include your app:
scrape_configs:
  - job_name: 'my-app'  # Descriptive name for the service
    static_configs:
      - targets: ['app-host:8000']  # Replace with container name or IP and port
📌 Ensure
app-hostis resolvable from within the Prometheus container—use a Docker service name or internal container name if they're on the same network.💡 You can also customize the scrape interval per job:
scrape_interval: 10s
scrape_timeout: 5s
Restart Prometheus to Apply the New Configuration
Use Docker Compose to reload the updated configuration:
docker-compose restart prometheus🔍 Alternatively, use
docker execto test the config before restarting:docker exec -it prometheus promtool check config /etc/prometheus/prometheus.ymlVerify Metric Collection in the Prometheus UI
Open: http://localhost:9090
Go to Status → Targets to ensure your new job appears and is marked as UP
Use the Graph tab to query example metrics, such as:
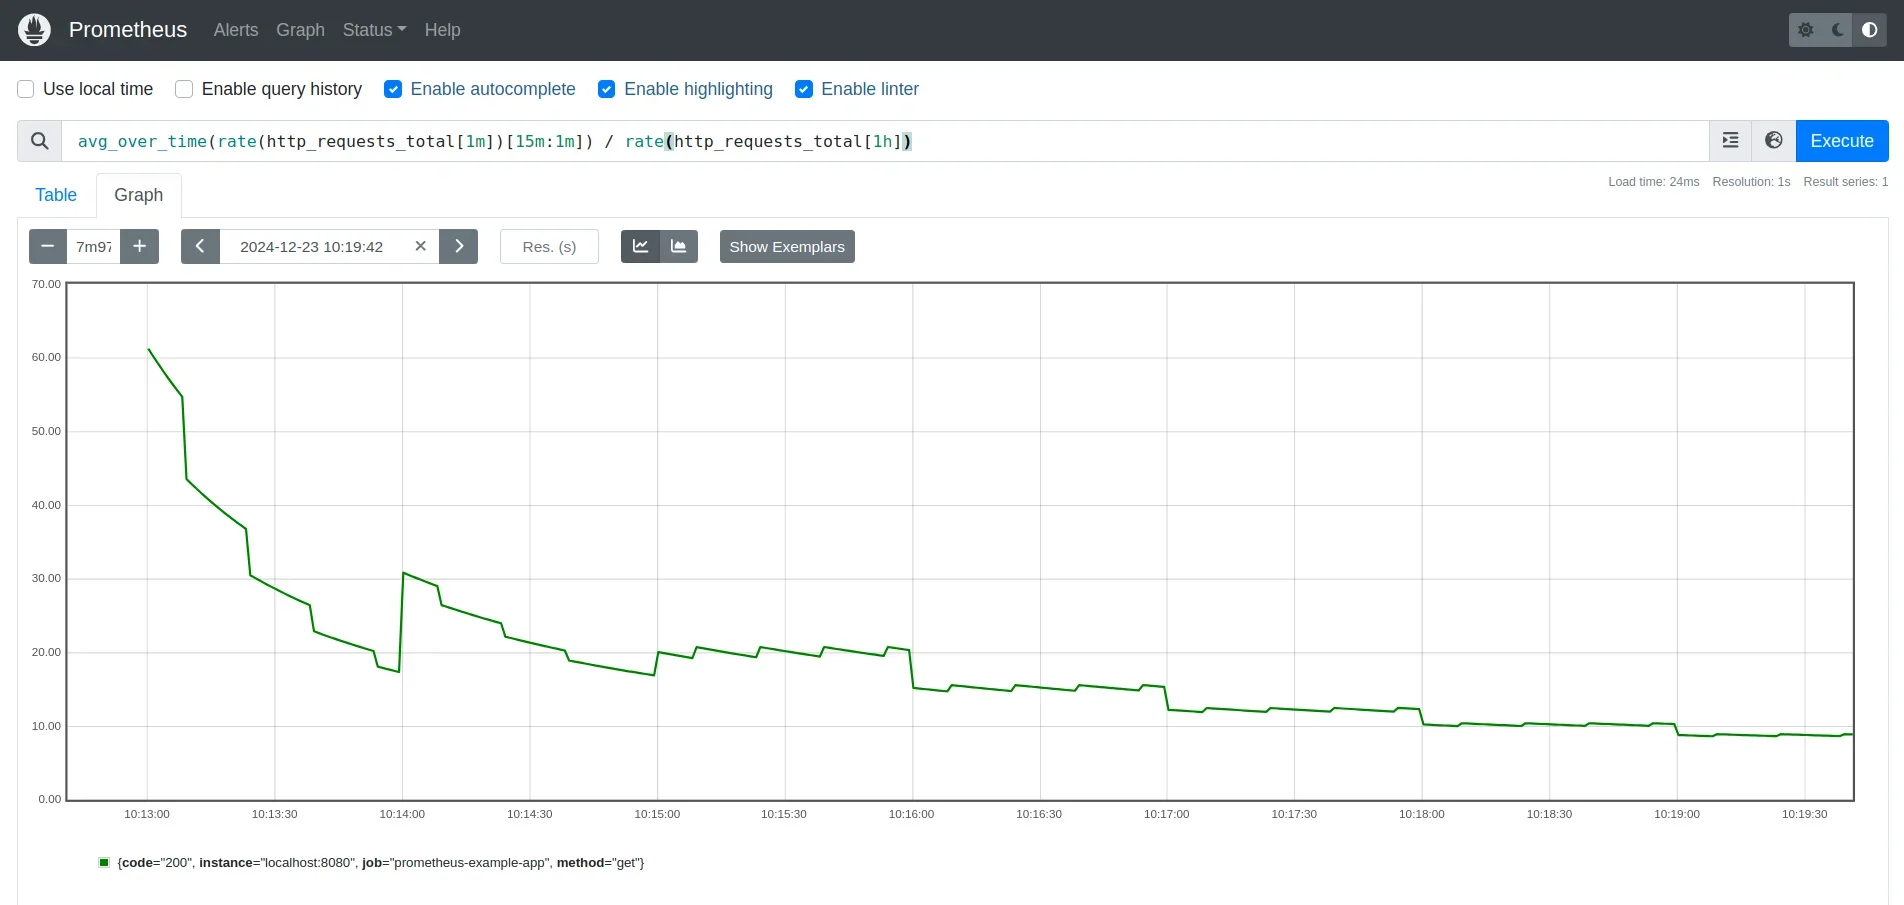
Prometheus graph using PromQL Query
Installing Grafana on Docker
Grafana is a powerful visualization tool that complements Prometheus by turning raw metrics into insightful dashboards. By containerizing Grafana with Docker, you can easily manage, deploy, and persist your monitoring setup alongside Prometheus.
Update Your
docker-compose.ymlto Include GrafanaUpdate your Docker Compose file to include Grafana as a service. This setup ensures persistent storage, environment configuration, and seamless integration with your monitoring network:
version: '3.8'

services:
  prometheus:
    image: prom/prometheus:v2.52.0
    # ... existing Prometheus config

  grafana:
    image: grafana/grafana:10.2.2
    container_name: grafana
    ports:
      - "3000:3000"
    environment:
      - GF_SECURITY_ADMIN_PASSWORD=your_password
    volumes:
      - grafana-storage:/var/lib/grafana
    networks:
      - monitoring
    restart: unless-stopped

volumes:
  grafana-storage:

networks:
  monitoring:
    external: true
📌 Using a named volume ensures Grafana persists dashboards and data sources across container restarts.
Launch Grafana
Run the following command to bring up the updated stack:
docker-compose up -d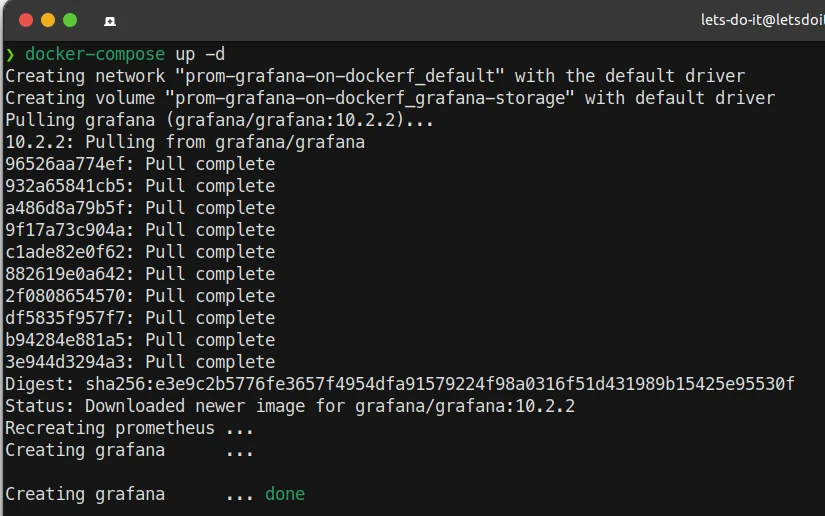
Command: docker-compose up -d Once running, access the web interface at:
Connecting Grafana to Prometheus
To visualize Prometheus metrics effectively in Grafana, the first step is to establish a connection between the two. This involves configuring Prometheus as a data source and building a dashboard to display meaningful insights.
- Set up Prometheus as a Data Source in Grafana
Navigate to Connections → Data Sources → Add data source in the left side panel.
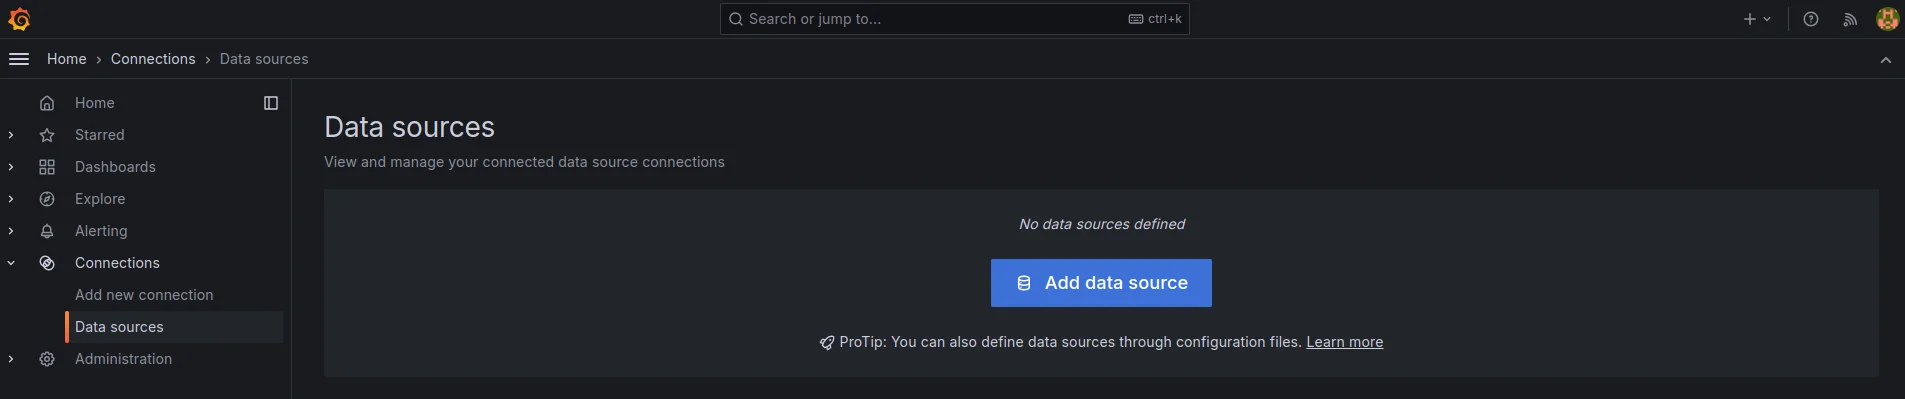
Adding a data source in Grafana Enter the Prometheus server URL in the configuration field.
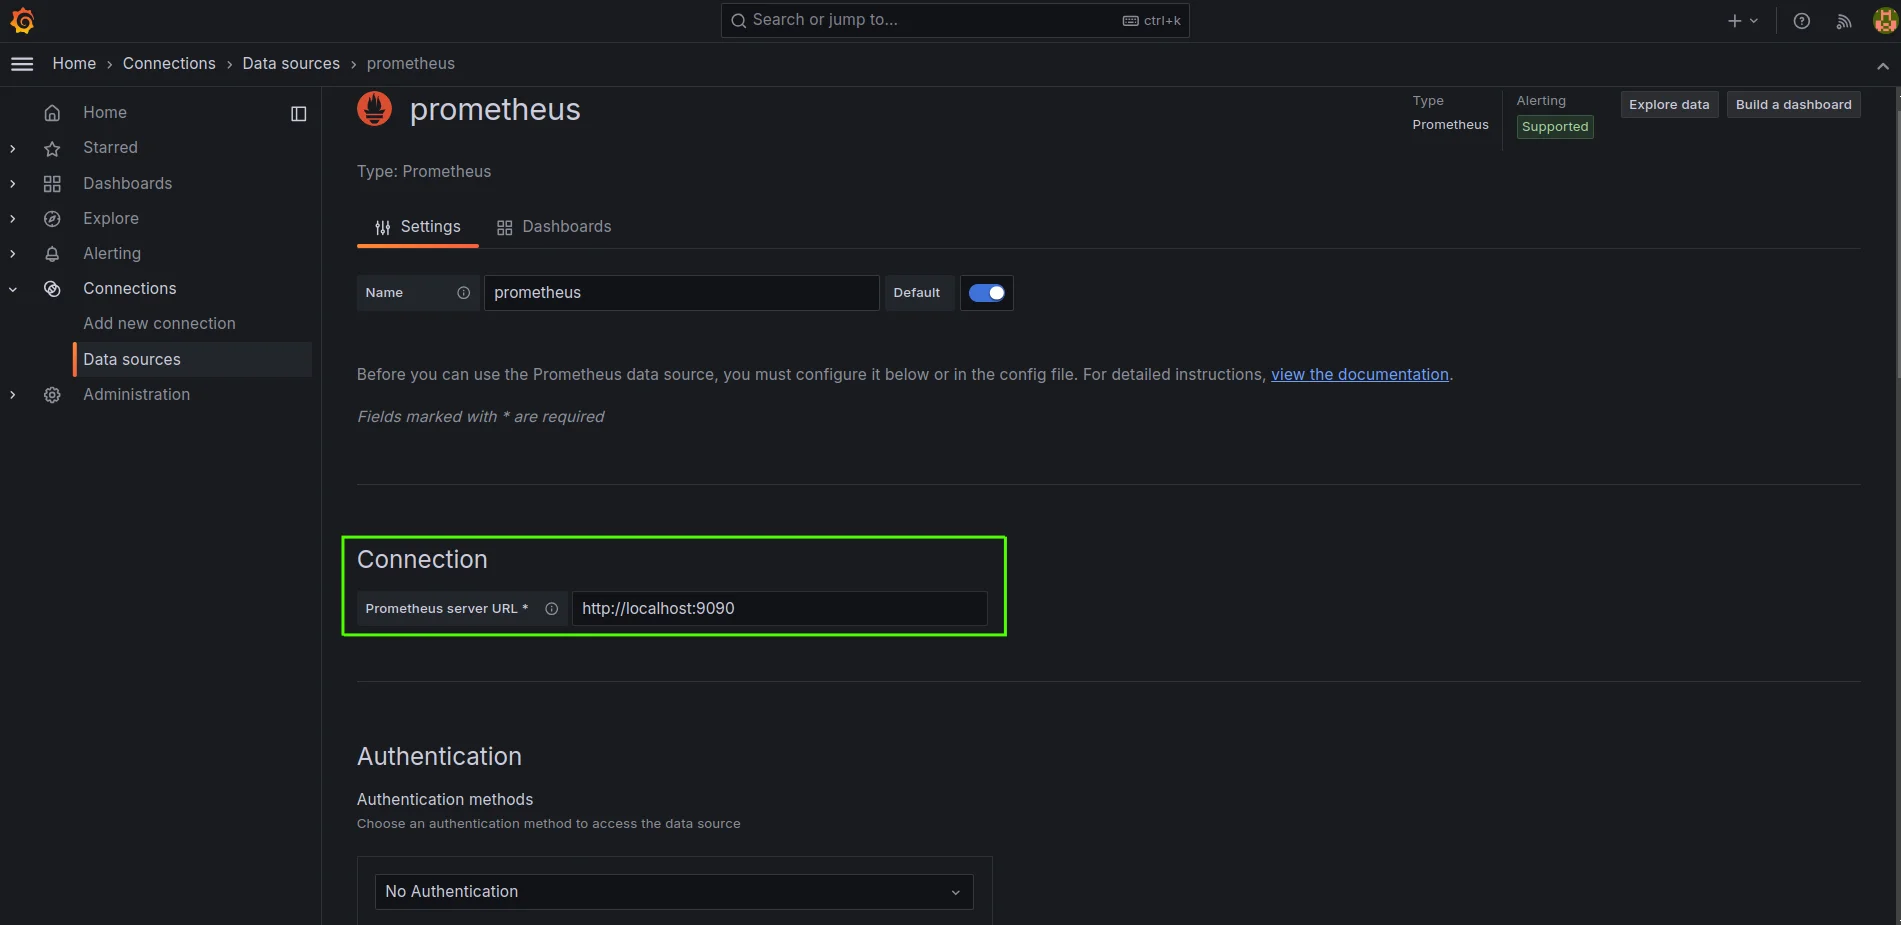
Enter Prometheus server URL in the config field Configure authentication settings (if required).
Click "Save & Test" to verify the connection
- Create a New Dashboard and Panel
Navigate to Dashboards → New Dashboard → Click on the Add Visualization button
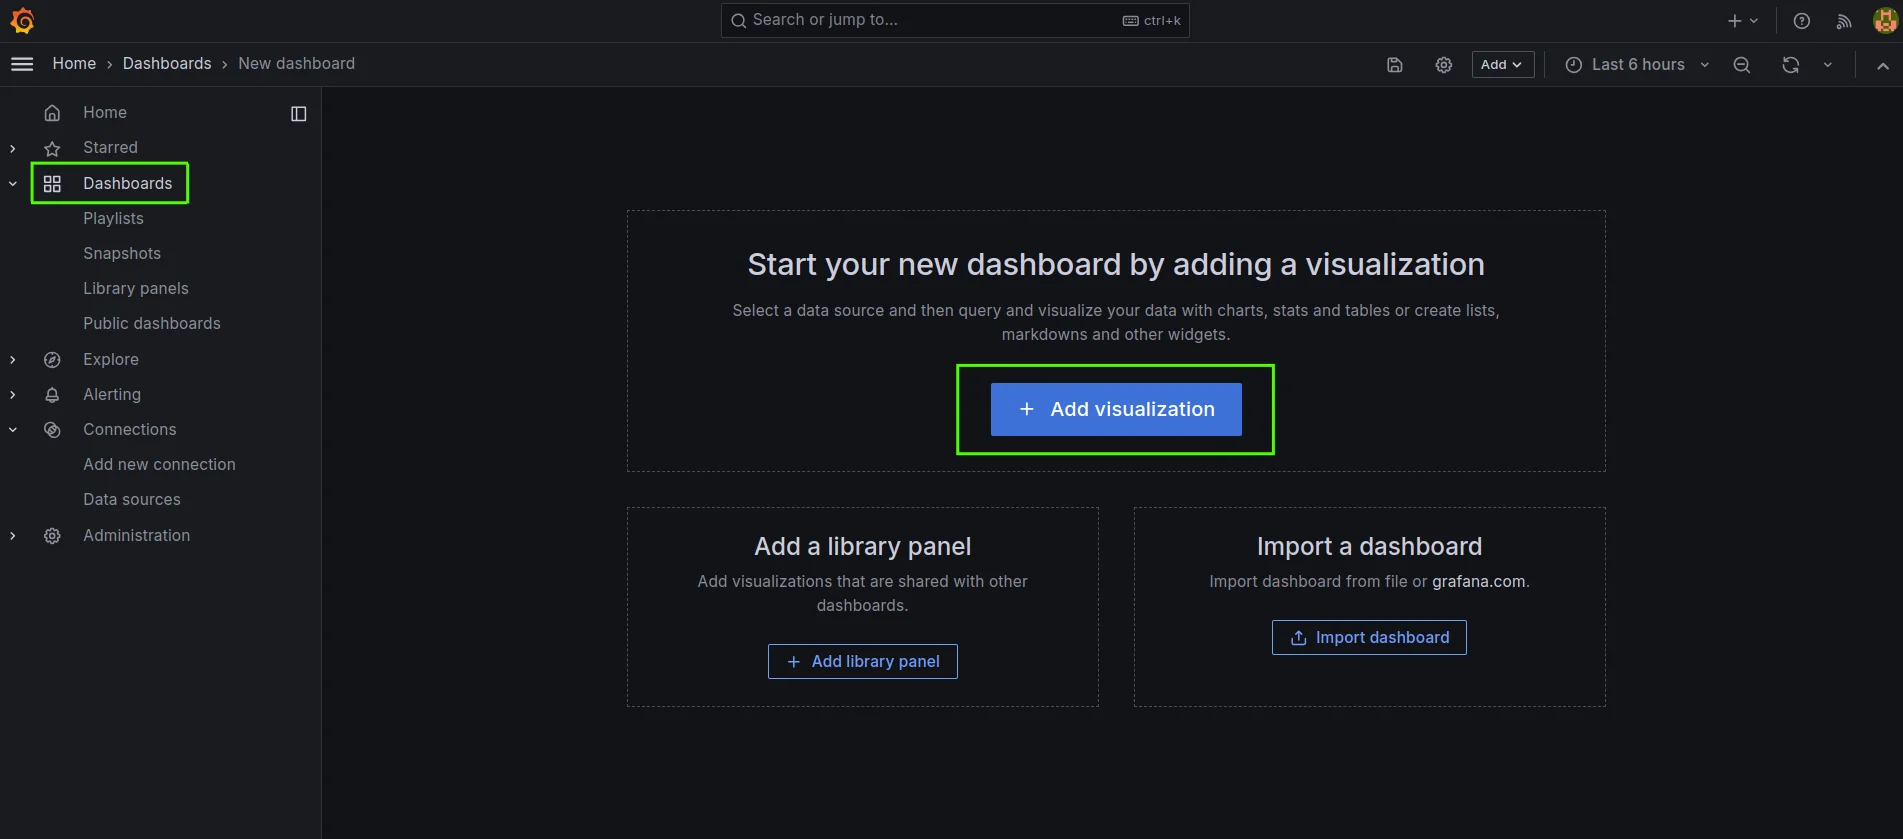
Create a new dashboard and add a visualization Select Prometheus from the data source dropdown
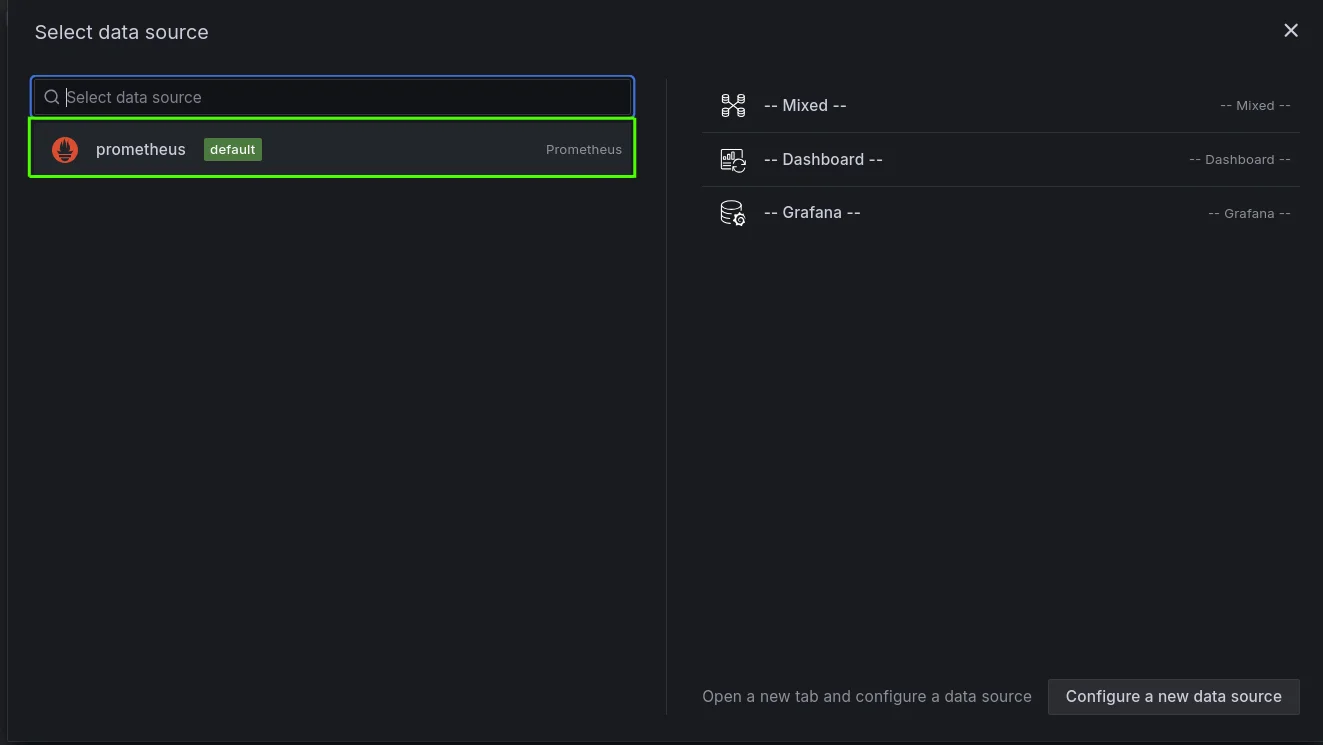
Select Prometheus as the data source Choose the appropriate visualization type
- Input Your PromQL Expression
In the query editor, enter your metric division expression. For example, to calculate CPU usage for each core:
100 - (rate(node_cpu_seconds_total{mode="idle"}[5m]) * 100This query breaks down CPU usage for each core individually, showing how much time each core is spending on active tasks over a 5-minute interval.
.webp)
PromQL expression for CPU usage
Monitoring Docker with cAdvisor
While Prometheus is excellent at scraping and storing metrics, it needs exporters to expose metrics from different systems. cAdvisor (Container Advisor) is a lightweight exporter developed by Google that collects real-time resource usage and performance metrics directly from Docker containers. It provides detailed insights such as:
- CPU and memory usage
- Network I/O
- Filesystem utilization
- Container lifecycle stats
This makes cAdvisor an essential tool for gaining container-level observability, especially when you're working with microservices or multiple Docker containers.
Add cAdvisor to Your
docker-compose.yml:Add the following service to your existing Docker Compose setup:
cadvisor:
    image: gcr.io/cadvisor/cadvisor:v0.47.2
    container_name: cadvisor
    ports:
      - "8080:8080"
    volumes:
      - /:/rootfs:ro
      - /var/run:/var/run:ro
      - /sys:/sys:ro
      - /var/lib/docker/:/var/lib/docker:ro
      - /var/run/docker.sock:/var/run/docker.sock:ro  # Only needed on Docker Desktop for Mac
    networks:
      - monitoring
    restart: unless-stopped
📝 cAdvisor provides insights like memory, CPU, and network usage for each container.
Update
prometheus.ymlto Scrape cAdvisorNow that cAdvisor is part of your stack, configure Prometheus to collect metrics from it:
scrape_configs:
  - job_name: 'cadvisor'
    static_configs:
      - targets: ['cadvisor:8080']
Restart the Stack
Apply your changes and restart the Docker stack:
docker-compose up -dOnce it's up and running, you’ll start seeing per-container metrics in Prometheus and can visualize them in Grafana for deeper analysis.
Best Practices and Optimization
To maximize performance, reliability, and security in your monitoring setup:
- Secure your stack:
- Enable authentication for both Prometheus and Grafana.
- Serve both tools behind a reverse proxy with HTTPS (e.g., Nginx + Let's Encrypt).
- Use network policies or firewalls to restrict access to monitoring ports.
- Optimize storage:
- Configure Prometheus's
-storage.tsdb.retention.timeto limit historical data retention based on your storage capacity. - Regularly clean up unused dashboards or data sources in Grafana.
- Configure Prometheus's
- Alert proactively:
- Define alerting rules in Prometheus and route them using Alertmanager.
- Integrate alerts with tools like Slack, PagerDuty, or email.
- Use Grafana's alerting engine for panel-based threshold alerts.
- Maintain your stack:
- Pin image versions to avoid unexpected changes (
grafana/grafana:10.2.2,prom/prometheus:v2.52.0). - Monitor Prometheus's own metrics (e.g.,
prometheus_tsdb_head_series) to detect performance bottlenecks. - Backup volumes (
prometheus-data,grafana-storage) regularly.
- Pin image versions to avoid unexpected changes (
Key Takeaways
- Prometheus and Grafana on Docker provide a flexible and powerful monitoring solution.
- Proper configuration is crucial for effective metric collection and visualization.
- Regular maintenance ensures long-term performance and reliability.
- Customizing dashboards allows you to focus on metrics that matter most to your applications.
FAQs
What are the minimum system requirements?
For small to medium workloads:
- CPU: 2 cores
- Memory: 4–8 GB RAM
- Disk: 20–50 GB (SSD preferred for better Prometheus performance)
For production or large-scale environments, scale based on data volume and scrape intervals.
Can Prometheus and Grafana monitor non-Docker applications?
Yes. Prometheus can scrape metrics from:
- Bare-metal or VM-hosted services
- Kubernetes clusters
- Cloud services (via exporters)
- Custom apps exposing
/metricsendpoints
How can I secure my setup?
- Use strong credentials and environment variables (
GF_SECURITY_ADMIN_PASSWORD) - Reverse proxy with HTTPS (e.g., Nginx or Traefik)
- Restrict network access via firewalls or
docker-composenetwork isolation - Enable Grafana alerting audit logs and role-based access
What are common setup issues and their solutions?
| Issue | Solution |
|---|---|
| Prometheus can’t scrape metrics | Verify targets in prometheus.yml and container DNS |
| Grafana can’t connect to Prometheus | Check http://prometheus:9090 URL and Docker network |
| High memory usage | Tune scrape intervals and retention time |
| Dashboard data is missing | Ensure correct time range and valid PromQL queries |
Visualizing Prometheus Metrics with SigNoz
While Grafana is an industry-standard visualization platform, SigNoz offers an integrated alternative that combines metrics, traces, and logs.
Why SigNoz?
- Built-in support for OpenTelemetry
- Unified observability: metrics + traces + logs
- Seamless backend powered by ClickHouse
- Intuitive UI and PromQL support
- Self-hosted and managed cloud options
Getting Started with SigNoz
You can deploy SigNoz with Docker Compose or Kubernetes in minutes. For example:
git clone https://github.com/SigNoz/signoz.git
cd signoz/deploy/docker
docker-compose up -d
Once running, access the UI at http://localhost:8080.
