Datadog bills can spiral out of control quickly. We've previously covered how Datadog pricing works and the common pricing pitfalls teams face. This guide dives into proven strategies to slash your Datadog costs by 30-70% while maintaining the observability your team needs.
Understanding Datadog's Pricing (Brief Recap)
If you haven’t read our article on datadog pricing, here’s a quick recap for you on how datadog pricing works:
1. Host-Based Fees
Core monitoring costs $15-34 per host/month for infrastructure, $31-40 for APM. Eight small instances cost more than one large instance in Datadog fees, a key consideration for autoscaling environments.
2. Ingestion vs Indexing
Logs are billed twice: ingestion (~$0.10/GB) and indexing (~$2.50 per million events). Even excluded logs from indexing still incur ingestion costs.
3. Custom Metrics and Cardinality
Custom metrics are counted as unique metric-name + tag combinations.
Beyond free allotments (100 per host on Pro), each unique metric timeseries costs ~$0.05/month. High-cardinality metrics with dynamic tags (user IDs, UUIDs) can generate thousands of series, often comprising 50%+ of bills.
4. Other Products
Each feature (traces, RUM, synthetics) has separate pricing units. Enabling integrations can flood your account with hundreds of default metrics.
Strategies to Reduce Datadog Costs
Many datadog exploding bills surprises come from:
- Autoscaling spikes increasing host counts.
- New integrations emitting hundreds of metrics.
- Verbose logging in production.
- High-cardinality metrics from dynamic tags.
Datadog’s costs scale with your usage of hosts, metrics, logs, traces, etc. - uncontrolled growth in any of these will translate to a higher bill.
The following sections outline strategies to keep these costs under control without sacrificing observability.
1. Control Custom Metrics and Cardinality
Custom metrics are useful for application-specific monitoring, but they can become a silent budget killer if not managed.
Each unique metric name + tag combination counts as a separate timeseries.
For example, if a metric api.request.count has a tag user_id with 1,000 distinct values, that’s 1,000 custom metrics right there. It adds up fast.
Eliminate High-Cardinality Tags:
Never tag with user IDs, UUIDs, timestamps, or highly unique values.
- Replace
user_idwithuser_tierorregion(group users into categories). - Each tag you add should have a low number of possible values.
Consolidate Redundant Metrics:
Check if you are tracking the same thing in multiple ways. It’s common to accidentally duplicate metrics – e.g. recording request latency as a custom metric while an integration or APM also reports it.
- Audit for duplicate metrics across teams
- Remove metrics already provided by integrations or APM
- Use a single load balancer metric instead of per-service request counts
Use Metrics Without Limits:
Datadog offers Metrics Without Limits™ to decouple ingestion from indexing. This means you can ingest high-cardinality metrics but index (make queryable) only a subset of tag values.
- Ingest high-cardinality metrics but index only essential tag combinations.
- Example: ingest with
user_idbut index only byserviceandregion.
Be careful: with this feature, you might pay for two volumes – ingested vs indexed metrics – but it lets you retain the raw data if needed while lowering the cost of what you actively index.
Pre-Aggregate When Possible:
If you only need high-level trends and not granular details, consider aggregating metrics before sending to Datadog.
- Example: For example, instead of sending a custom metric with
{user_id}tag for every user’s action (and incurring one series per user), aggregate counts or sums by minute and send a metric likeapp.feature.usage_countwith no user tag.
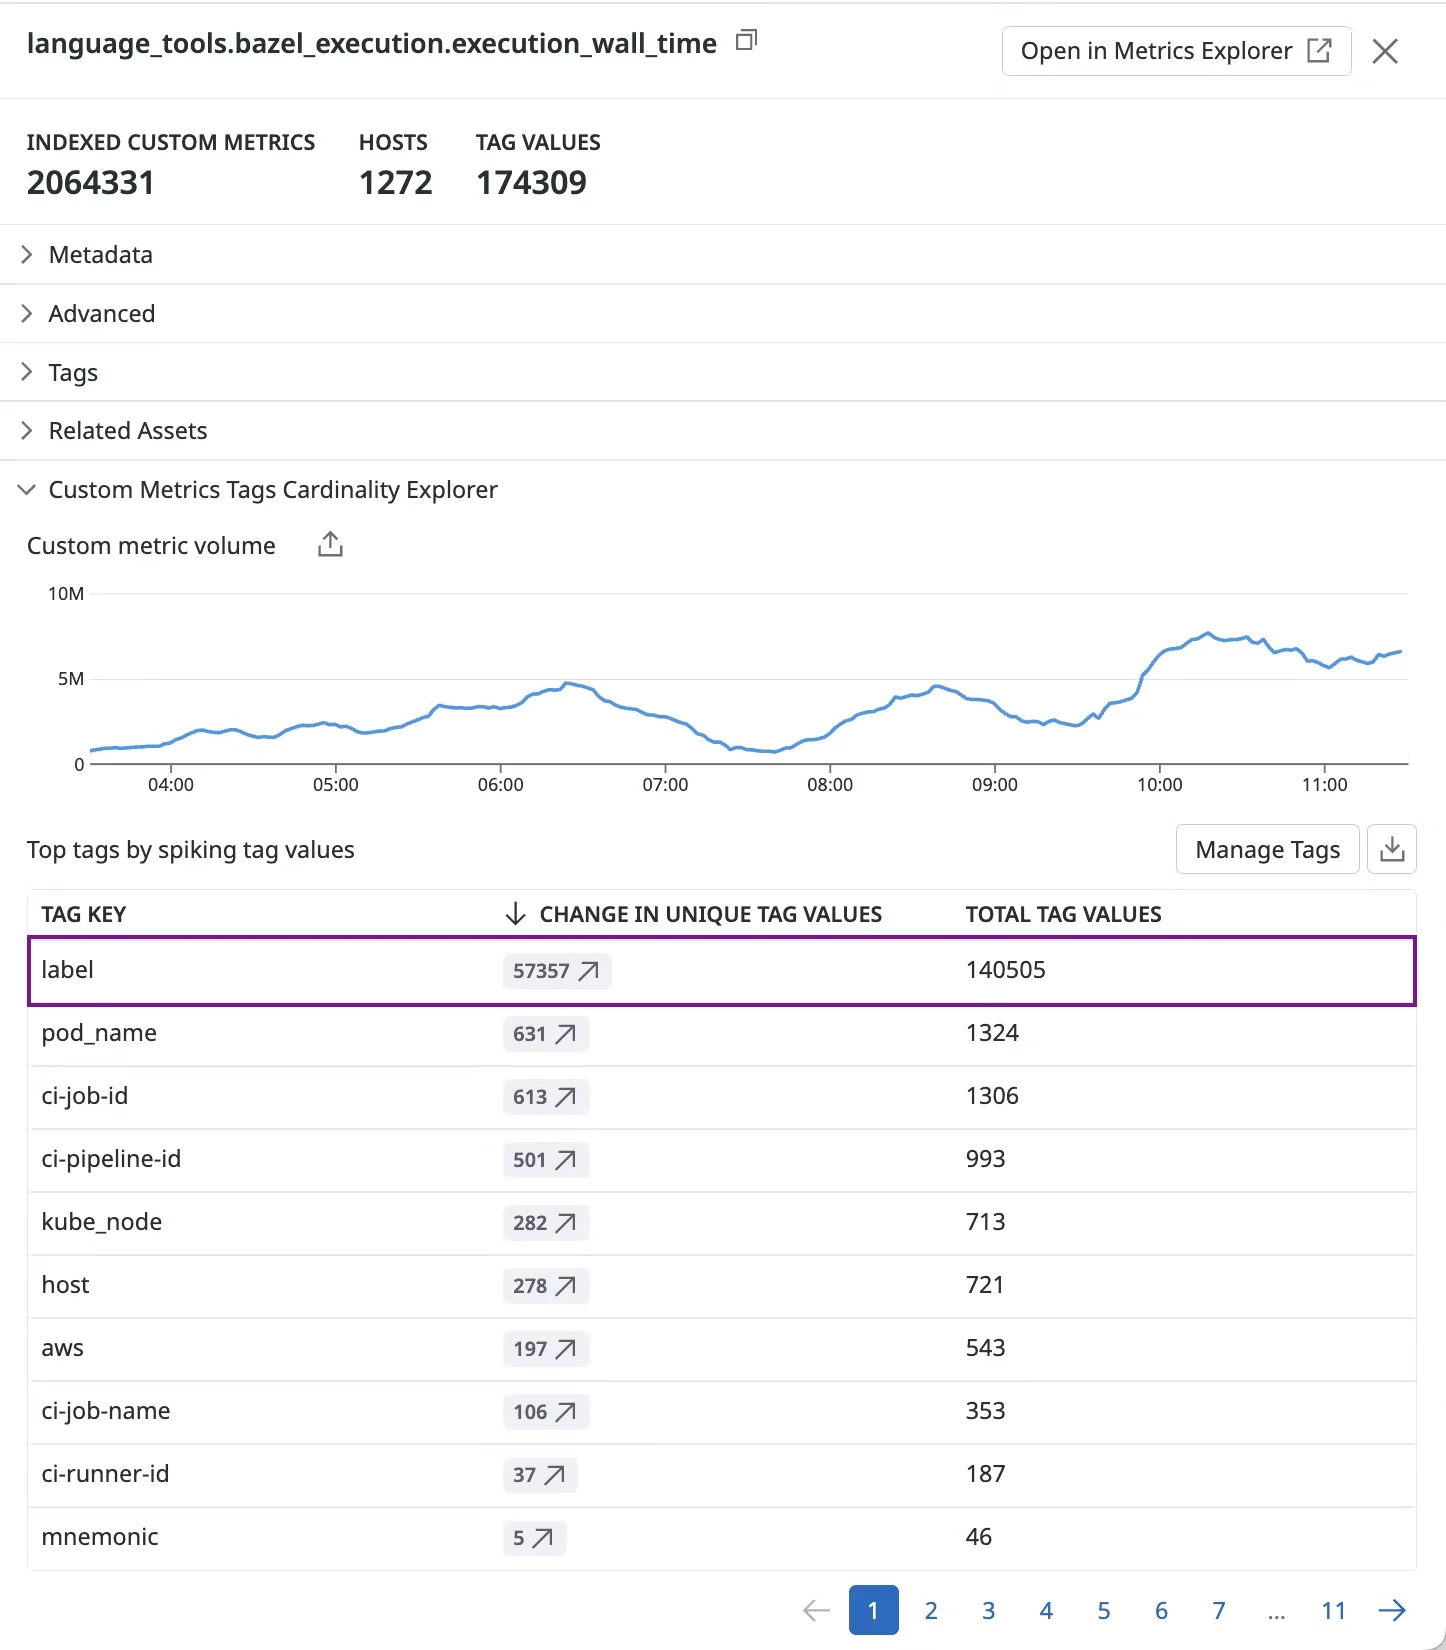
Monitor Metric Usage: Use Datadog's Metrics Summary page to identify top metrics by cardinality. Set up alerts when metric counts spike unexpectedly.
2. Optimize Log Collection, Indexing, and Retention
Logs can be a huge portion of Datadog bills, especially if your applications are chatty. Datadog’s Logging without Limits philosophy means you don’t have to index everything – you can decide what to keep, what to drop, and how long to keep it.
Filter at Source: Configure the Datadog Agent to drop logs before ingestion:
logs:
  - type: file
    path: /var/log/myapp/app.log
    service: myapp
    source: python
    log_processing_rules:
      - type: exclude_at_match
        name: exclude_healthchecks
        pattern: "healthcheck"
      - type: exclude_at_match
        name: exclude_debug
        pattern: " DEBUG "
The above configuration will drop any log line containing "healthcheck" or " DEBUG " (note the spaces to target log level in context). The exclude_at_match rule ensures matching logs are not sent to Datadog. By doing this, you stop paying for logs that provide little value.
Why filter before sending? Once data reaches Datadog, you’re incurring ingestion costs. Dropping data after ingestion (via exclusion filters) saves on indexing but not on ingestion costs. So it’s often best to do initial filtering in your logging agent or pipeline on your infrastructure.
Reminder: When filtering, ensure you’re not dropping logs that you’ll regret losing during an incident. A good approach is to involve developers in deciding which logs are mission-critical.
Use Exclusion Filters for Indexing:
Even after filtering at source, you’ll have logs that you do send to Datadog for archive or metrics, but perhaps you don’t need all of them indexed (searchable) in real-time.
Datadog lets you define Log Exclusion Filters on indexes – rules that say “ingest the log (for archive or live tail) but don’t index it for search”.
For example, you might keep ERROR and WARN logs indexed, but exclude INFO logs from indexing to save on storage costs.
Shorten Retention Periods:
Reduce from 15 days to 7 or 3 days. Shortening to 3 days saves ~37% on storage costs.
Archive and Rehydrate:
Configure automated archiving to S3. Rehydrate only when needed for investigations. This means you have a long-term record at low cost (since your cloud storage is cheaper per GB than Datadog).
Drop Unneeded Log Fields
Another subtle way to reduce log ingestion size is to remove unnecessary attributes from logs. (Example - large user-agent strings)
Smaller log events = fewer GB ingested = lower cost. Datadog suggests using an “edit” processor to remove unused attributes and reduce log size.
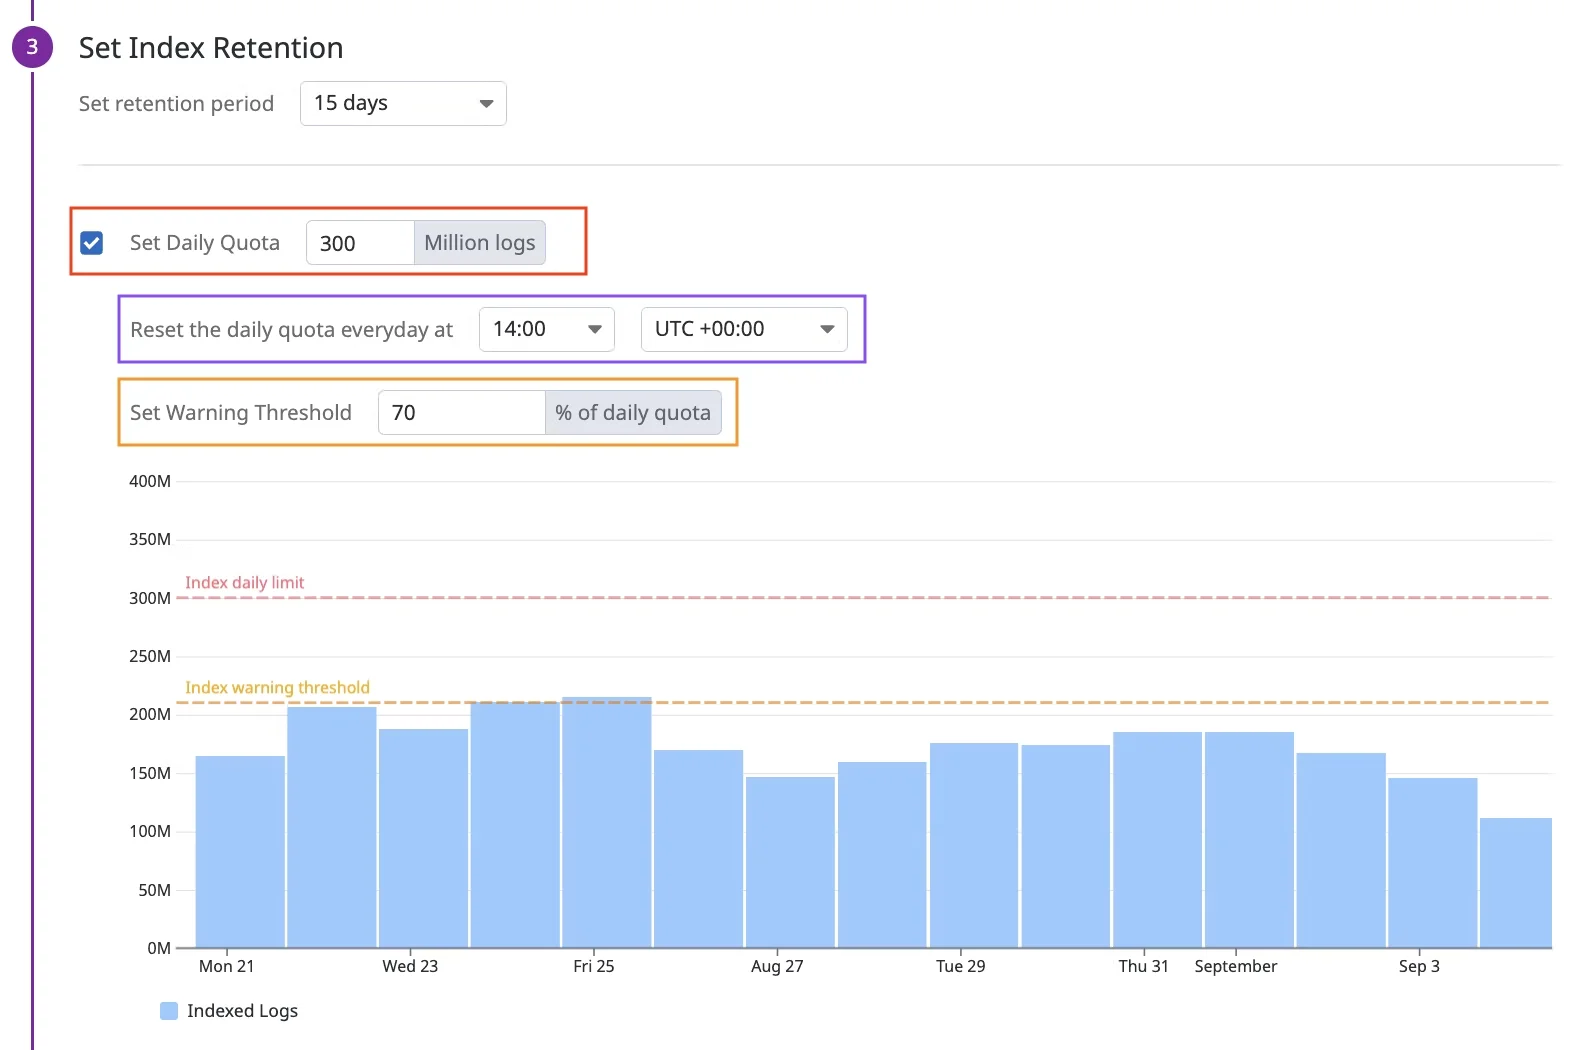
Set Daily Quotas:
Hard caps prevent runaway costs. Set quotas slightly above normal peak usage—when exceeded, additional logs are dropped from indexing.
3. Clean Up Unused Metrics, Dashboards, and Pipelines
Over time, it’s common for organizations to accumulate cruft in their monitoring setup: old metrics that are no longer emitted, dashboards nobody views, log pipelines for defunct services, etc. Cleaning these up can reduce costs (and also reduce confusion in the tooling).
Audit Unused Metrics:
- Use Metrics Summary to find metrics not queried in 30+ days
- Check "Metrics Related Assets" to see if metrics are referenced anywhere
- Stop sending unused metrics from your code or integrations
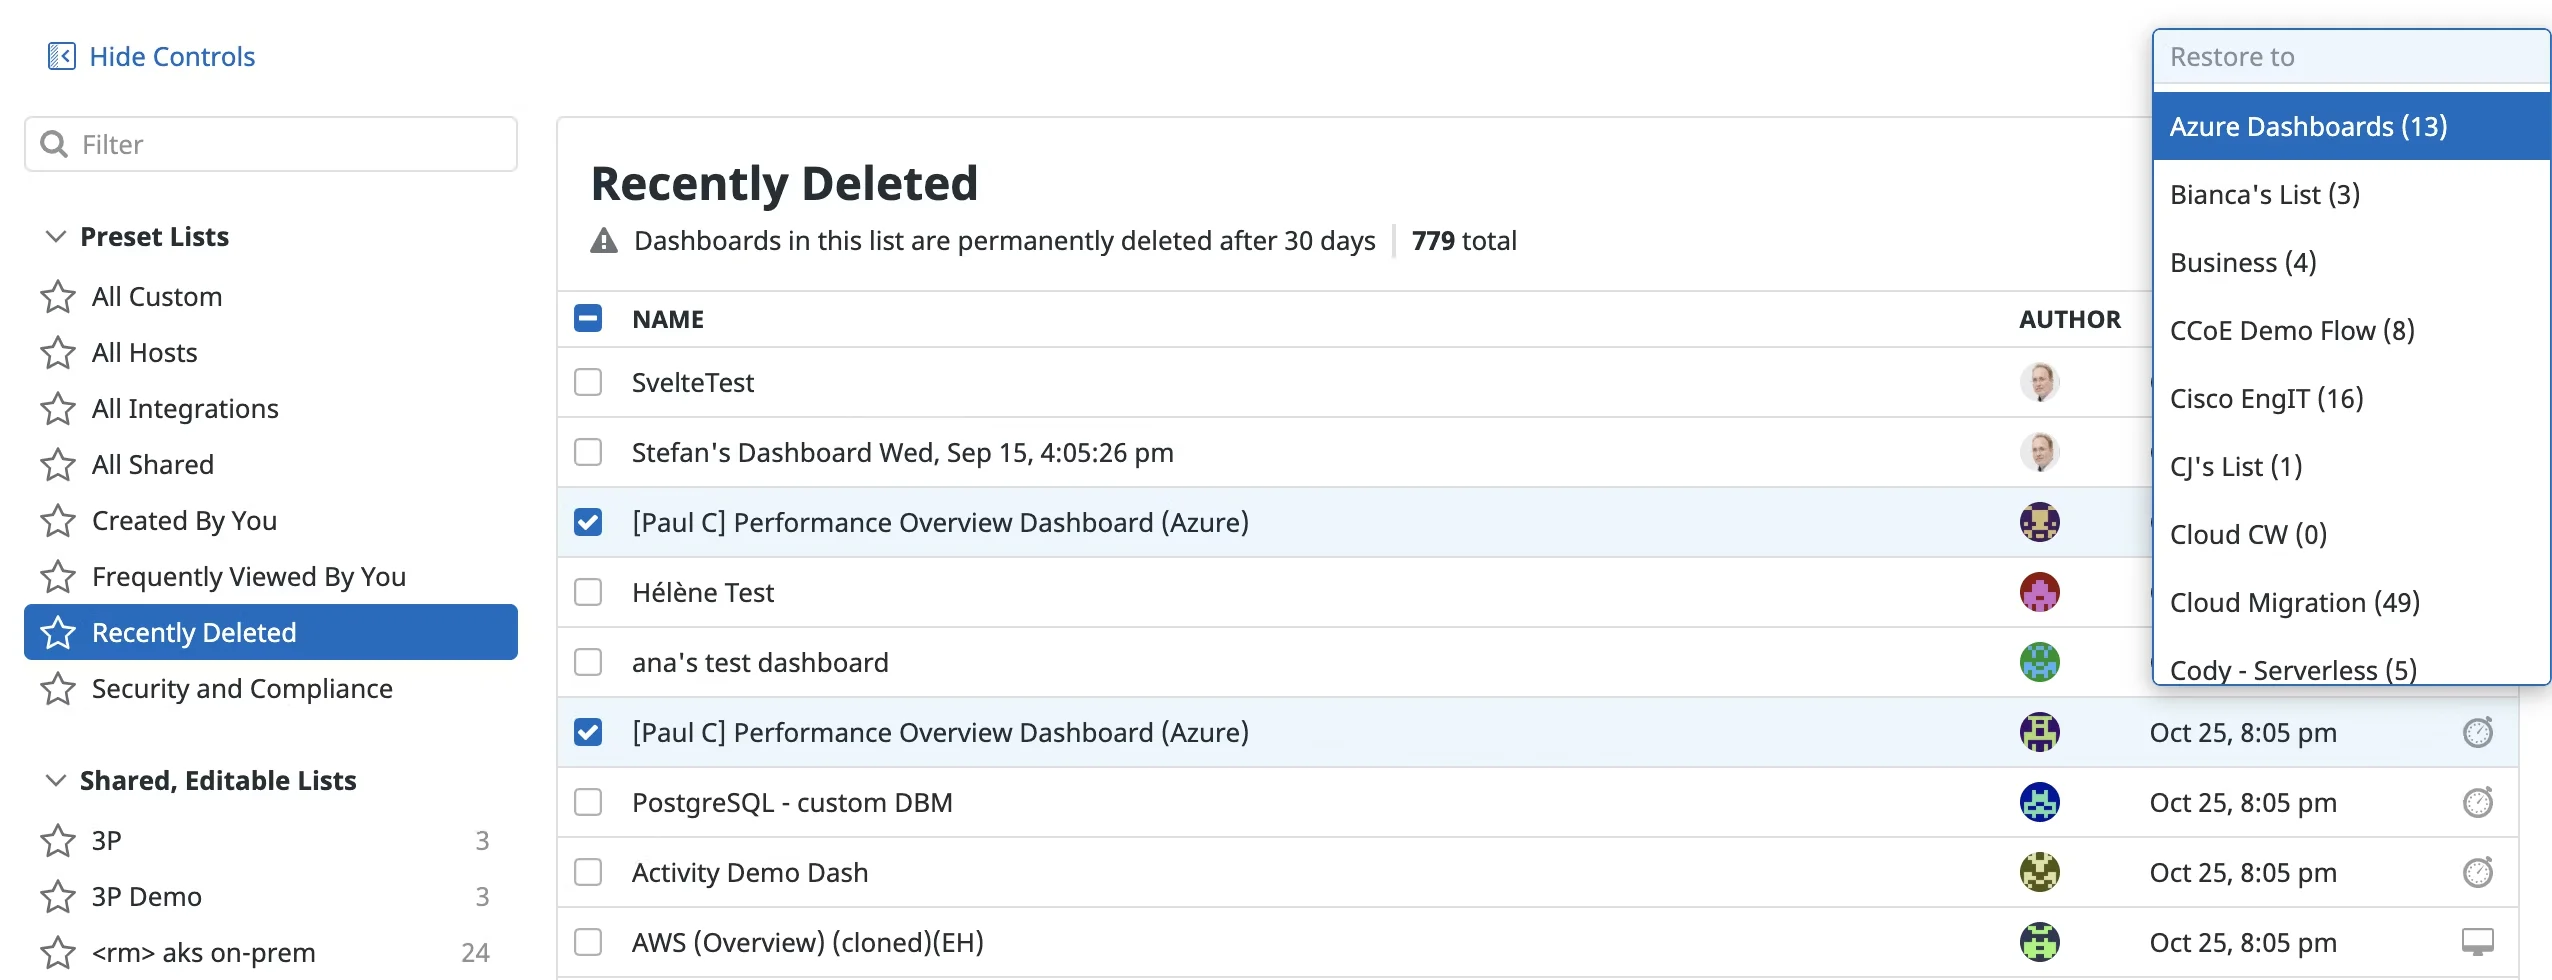
Clean Up Dashboards:
- Sort by last viewed/modified date
- Bulk delete dashboards not accessed in 3+ months
- Use Datadog's 30-day recycle bin as safety net
While dashboards themselves don’t incur direct cost, they often pull in metrics (and people might keep metrics because “it’s on some dashboard”).
Remove Unused Log Pipelines:
An unused pipeline might not incur a cost directly, but it adds processing overhead and complexity. More importantly, some pipelines extract custom attributes or generate metrics from logs which do cost money.
Delete pipelines for retired services or those generating unused metrics from logs.
4. Set Up Proactive Billing Alerts and Usage Caps
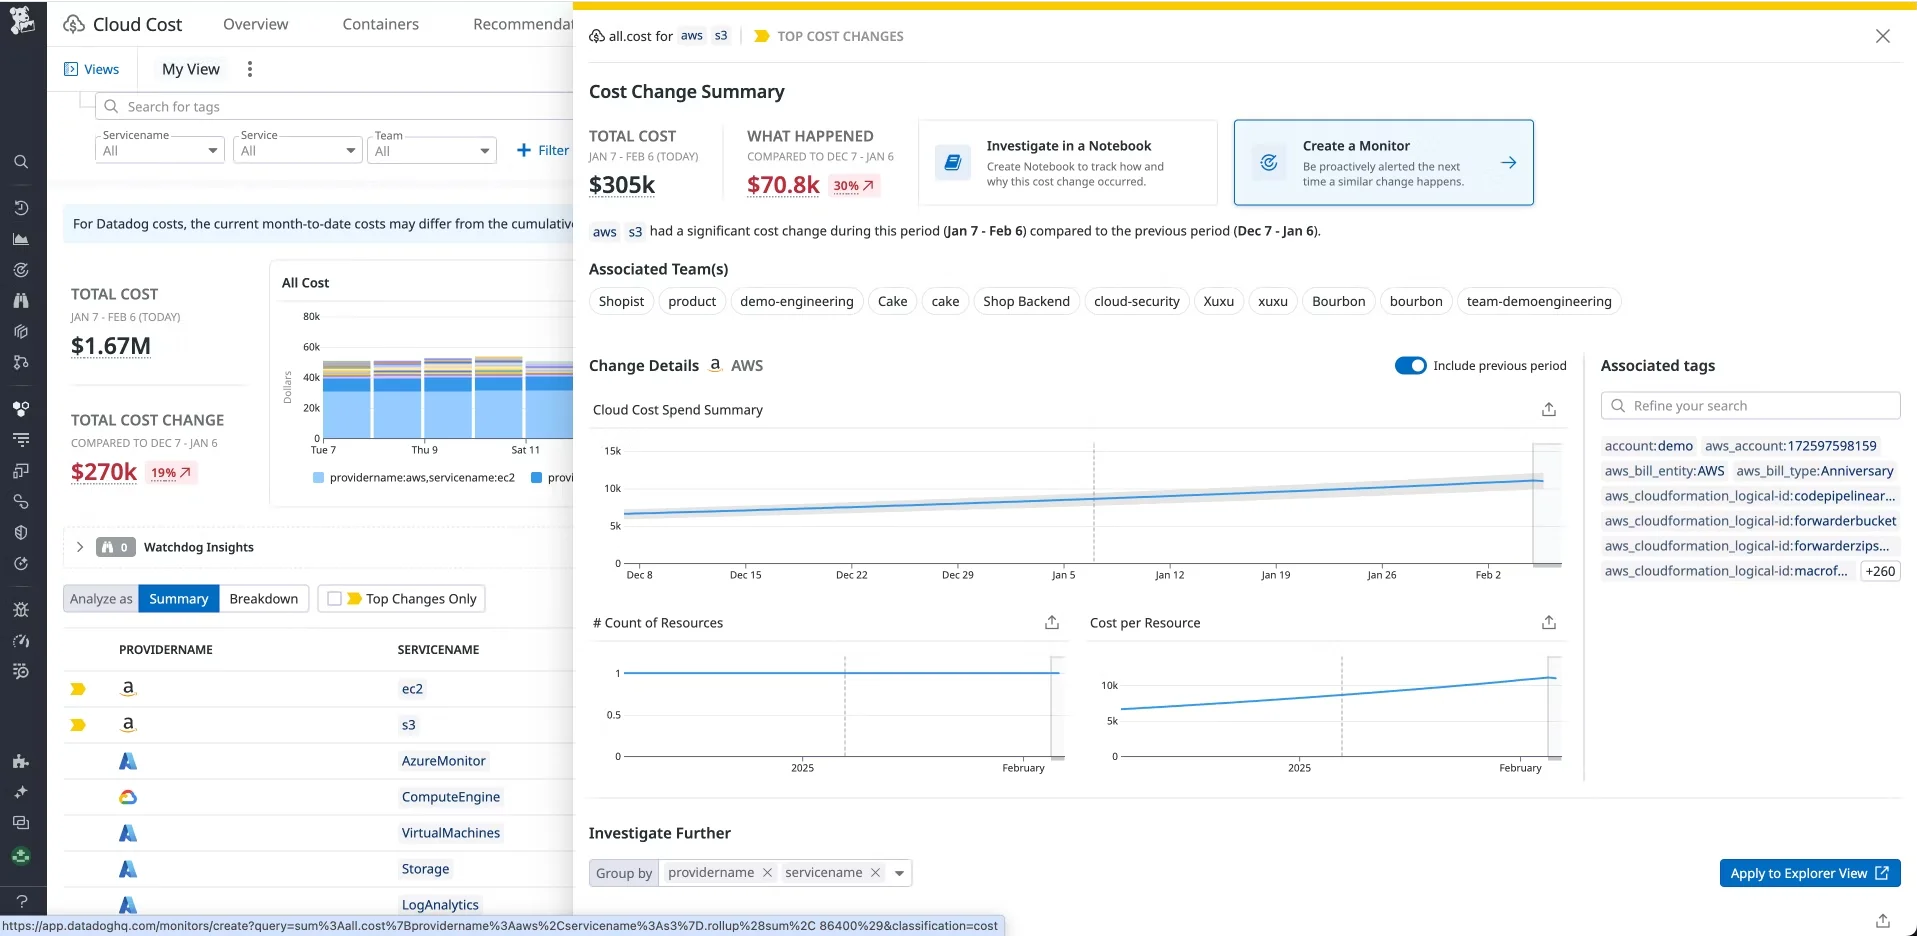
Just as you monitor CPU or error rates, you can monitor your Datadog spend. Datadog’s Cloud Cost Management features let you create cost monitors that trigger alerts based on usage or cost thresholds.
Cost Monitors:
Create monitors that alert on cost thresholds:
- Monthly log indexing exceeds $500
- Custom metrics grow >5% week-over-week
- Total usage increases >20% month-over-month
Usage Attribution Budgets:
Allocate costs by team using tags. Set budgets and alert when teams exceed allocations.
Treat your observability usage as a monitored system. Set thresholds, get alerted on abnormal usage, and react quickly – either by optimizing usage or contacting Datadog to adjust the plan if truly needed.
Use SigNoz for Simple Usage-based Predictable Observability Costs
Even with all the cost optimisations, the stories of exploding Datadog bills are quite common.
In 2021, Coinbase famously faced a $65 million annual Datadog bill before stepping back to renegotiate and explore alternatives.
"I used to work at Coinbase actually. At Coinbase, there was a huge effort internally to minimize the Datadog bill. I think we were spending tens of millions of dollars on Datadog at Coinbase." — Shiv Ansal, Co-founder & CTO, Bands (Read full case study)
SigNoz takes a simpler approach:
No Per-Metric Fees
Unlike Datadog’s $0.05/series model, SigNoz charges only for raw data volume:
Metrics: $0.10 per million samples/month (all series included)
Logs & Traces: $0.30 per GB ingested/month (regardless of field count or cardinality)
This means you can emit high-cardinality metrics (e.g. per-user counters) without per-series penalties, cost scales purely with event volume.
Transparent Data Flow
SigNoz uses a columnar database under the hood, so you know exactly how bytes translate into cost. There’s no hidden “indexed vs. ingested” split for metrics, it’s a single volume-based pool.
Self-Hosting Option
Run the full stack (ClickHouse + OpenTelemetry collector + frontend) on your own infrastructure for zero licensing costs—only pay your cloud/VM bills.
Core Observability Features
- Metrics: Prebuilt dashboards for system and application metrics, plus custom queries via PromQL.
- Logs: Query your logs quickly with our powerful logs query builder with cost-effective long-term storage of logs.
- Traces: Native OpenTelemetry support with distributed-trace flame graphs and span-level querying.
- Alerts: Threshold and anomaly detectors driven by real-time data.
Technical Advantages
- Unified Storage: All telemetry (metrics, logs, traces) lives in one ClickHouse cluster—cross-correlation queries are just SQL joins.
- Resource Efficiency: ClickHouse’s columnar storage delivers high throughput at low cost per GB.
SigNoz delivers up to 9x better cost efficiency compared to Datadog for equivalent telemetry workloads—see the detailed pricing breakdown.
Explore a feature-by-feature comparison of SigNoz vs. Datadog to evaluate what's best for your stack.
Get Started with SigNoz
SigNoz cloud is the easiest way to run SigNoz. Sign up for a free account and get 30 days of unlimited access to all features.

You can also install and self-host SigNoz yourself since it is open-source. With 20,000+ GitHub stars, open-source SigNoz is loved by developers. Find the instructions to self-host SigNoz.
Other Alternatives
Grafana Cloud:
- Usage-based pricing, not per-host
- 40-50% cheaper than Datadog for many workloads
- Open-source foundation prevents lock-in
- Issue: Multiple tools to integrate vs single platform
New Relic:
- Simplified data ingestion pricing
- All telemetry in one pricing pool
- Issue: Complex interface, still can be expensive at scale
Prometheus + Grafana (Self-hosted):
- No licensing costs, pay only for infrastructure
- Complete control and customization
- Issue: Significant operational overhead
Uptrace:
- Open-source, no metric limits
- ClickHouse backend for performance
- Issue: Smaller community, fewer integrations
Elastic Stack:
- Good for log-heavy workloads
- Can combine with Prometheus for metrics
- Issue: Complex to scale, can be expensive to run
Key Takeaways
- Audit regularly: Review metrics, logs, and usage monthly. Set up cost monitors.
- Filter aggressively: Drop 70-90% of low-value logs and metrics before they hit Datadog.
- Control cardinality: Avoid high-cardinality tags. Use controlled vocabularies.
- Set hard limits: Use daily quotas and usage caps to prevent bill shock.
- Consider alternatives: For high-volume workloads, tools like SigNoz can offer 90%+ savings.
- Optimize incrementally: Start with biggest cost drivers (usually custom metrics and logs).
Most teams can reduce Datadog costs by 30-70% through these optimizations while maintaining essential observability. The key is treating cost as a first-class metric to monitor and optimize continuously.
