Infrastructure monitoring, custom metrics &
dashboards to fit any use case
Monitor any metrics important to you. Ingest metrics from your infrastructure or applications
and create customized dashboards to monitor them. Set alerts and get notified
in your preferred notification channel.


Metrics Monitoring?

Easy-to-Use Query Builder with Advanced Capabilities
SigNoz comes packed with a powerful query builder. Create queries on your metrics data quickly with an easy-to-use metrics query builder. The click-and-select query builder is made to write queries super easily without knowing any query language. You can combine multiple queries, apply functions, and add formulae to create really complex queries quickly.

Integrations for quick-start monitoring
Use integrations to start monitoring popular technologies quickly. This enables you to create pre-built dashboards with important logs and metrics that can give you insights into performance. We currently have integrations for AWS services, Redis, MongoDB, Nginx, Clickhouse, Postgresql, and many more.

Support for both delta and cumulative metrics
SigNoz supports both delta and cumulative metrics for covering all types of use cases in metrics monitoring. Delta metrics help to measure the change in a value over a specific interval, while cumulative metrics measure the total value accumulated over time. Send metrics from your application in any format and monitor them in SigNoz.
Popular tools like Datadog only supports delta metrics, and Prometheus only supports cumulative metrics.
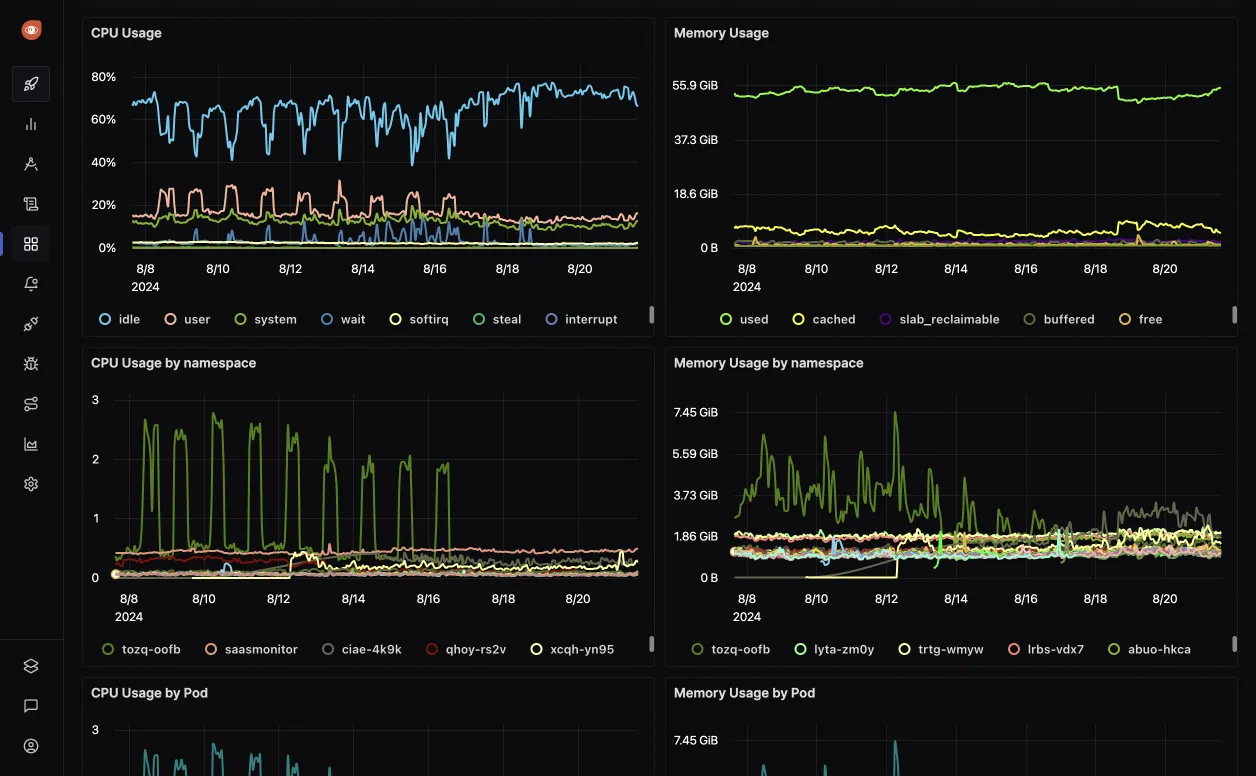
Dashboards Overview
Send metrics from any source
Infrastructure, application, or database metrics - send all types of time-series data to SigNoz. Create charts and dashboards and add alerts to monitor them.
OpenTelemetry Metrics SDK Support
SigNoz is OpenTelemetry-native, and it supports all kinds of metrics provided by OpenTelemetry metrics SDK. OpenTelemetry is a powerful observability framework using which you can correlate your application metrics with other signals like traces for richer context while debugging.
Powerful Query Builder
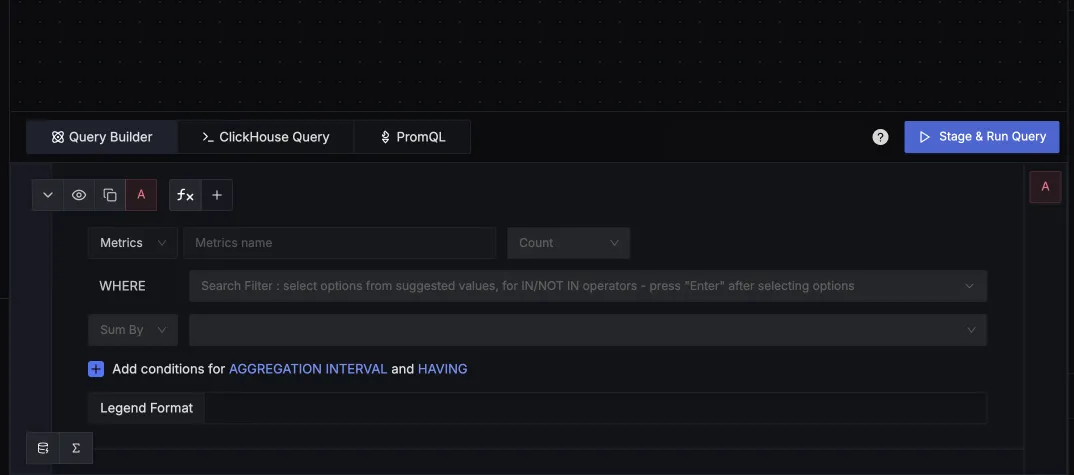
Create queries on your metrics data quickly with an easy-to-use metrics query builder. Add multiple queries and combine those queries with formulae to create really complex queries quickly.
Support for Functions
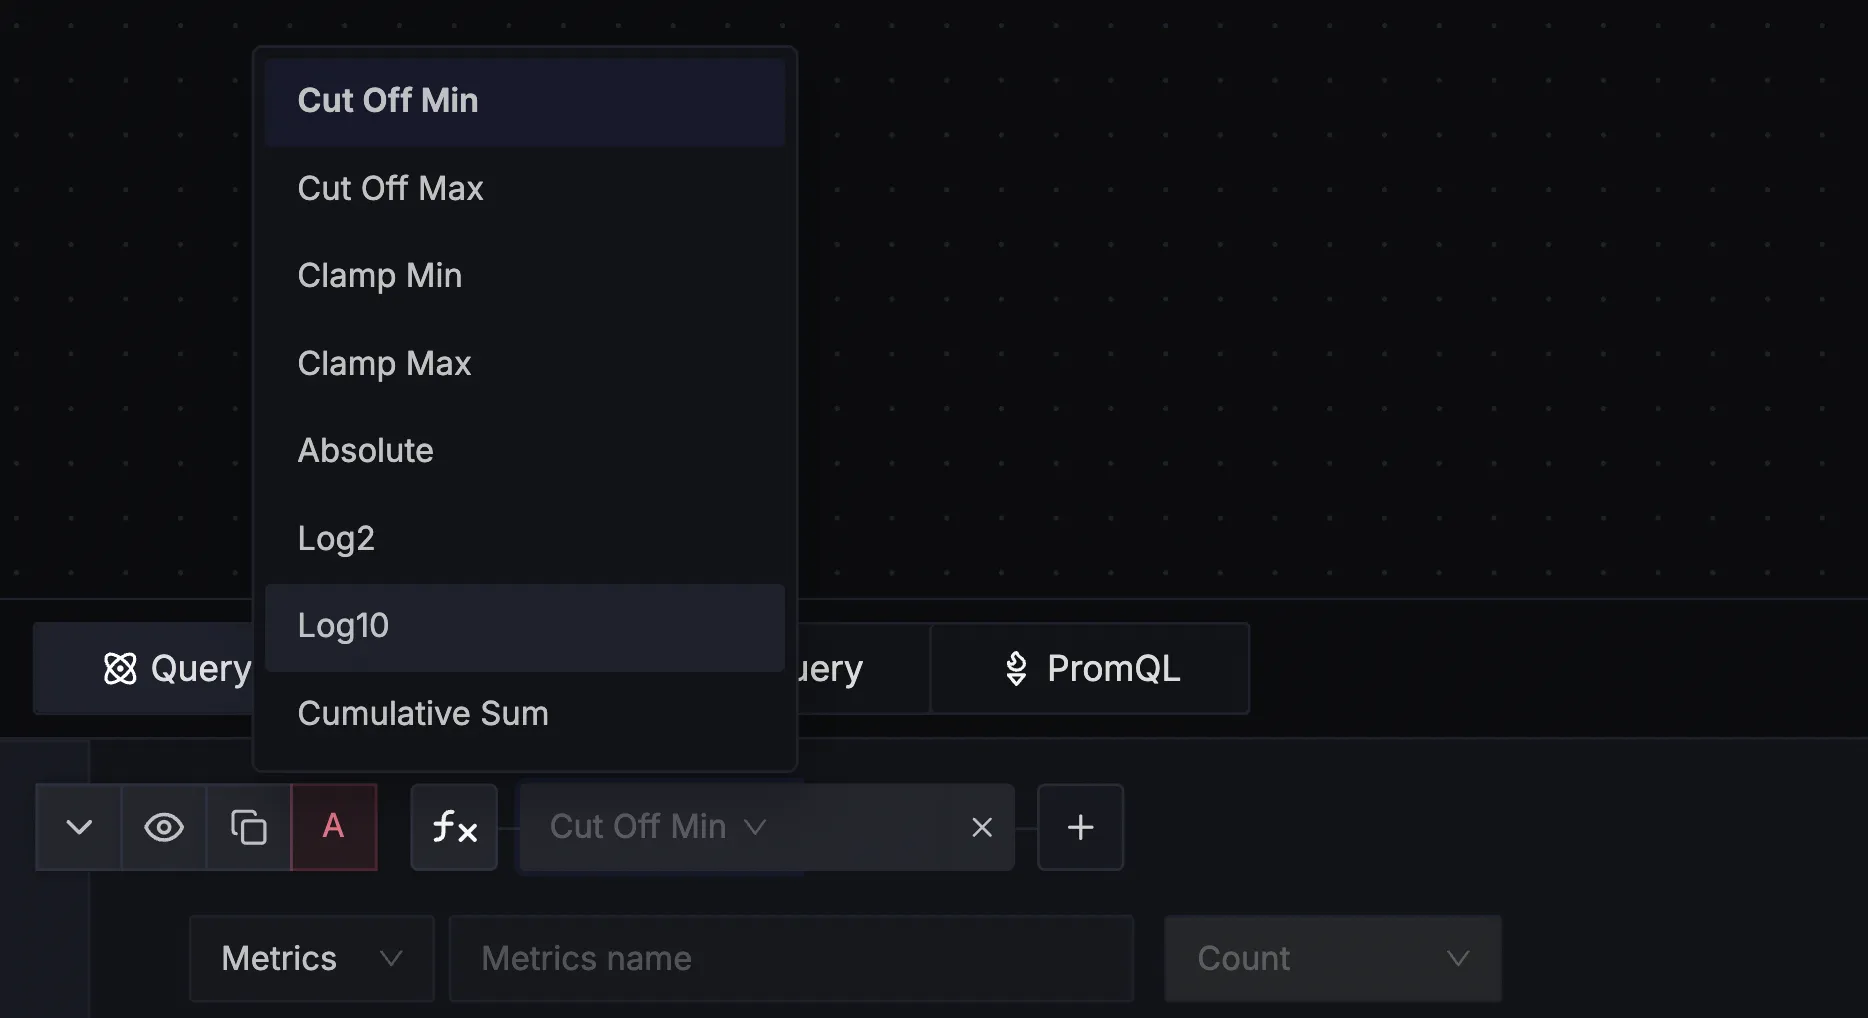
Metrics Query Builder comes packed with a lot of mathematical functions that you can apply directly to your queries.
Rich Visualizations
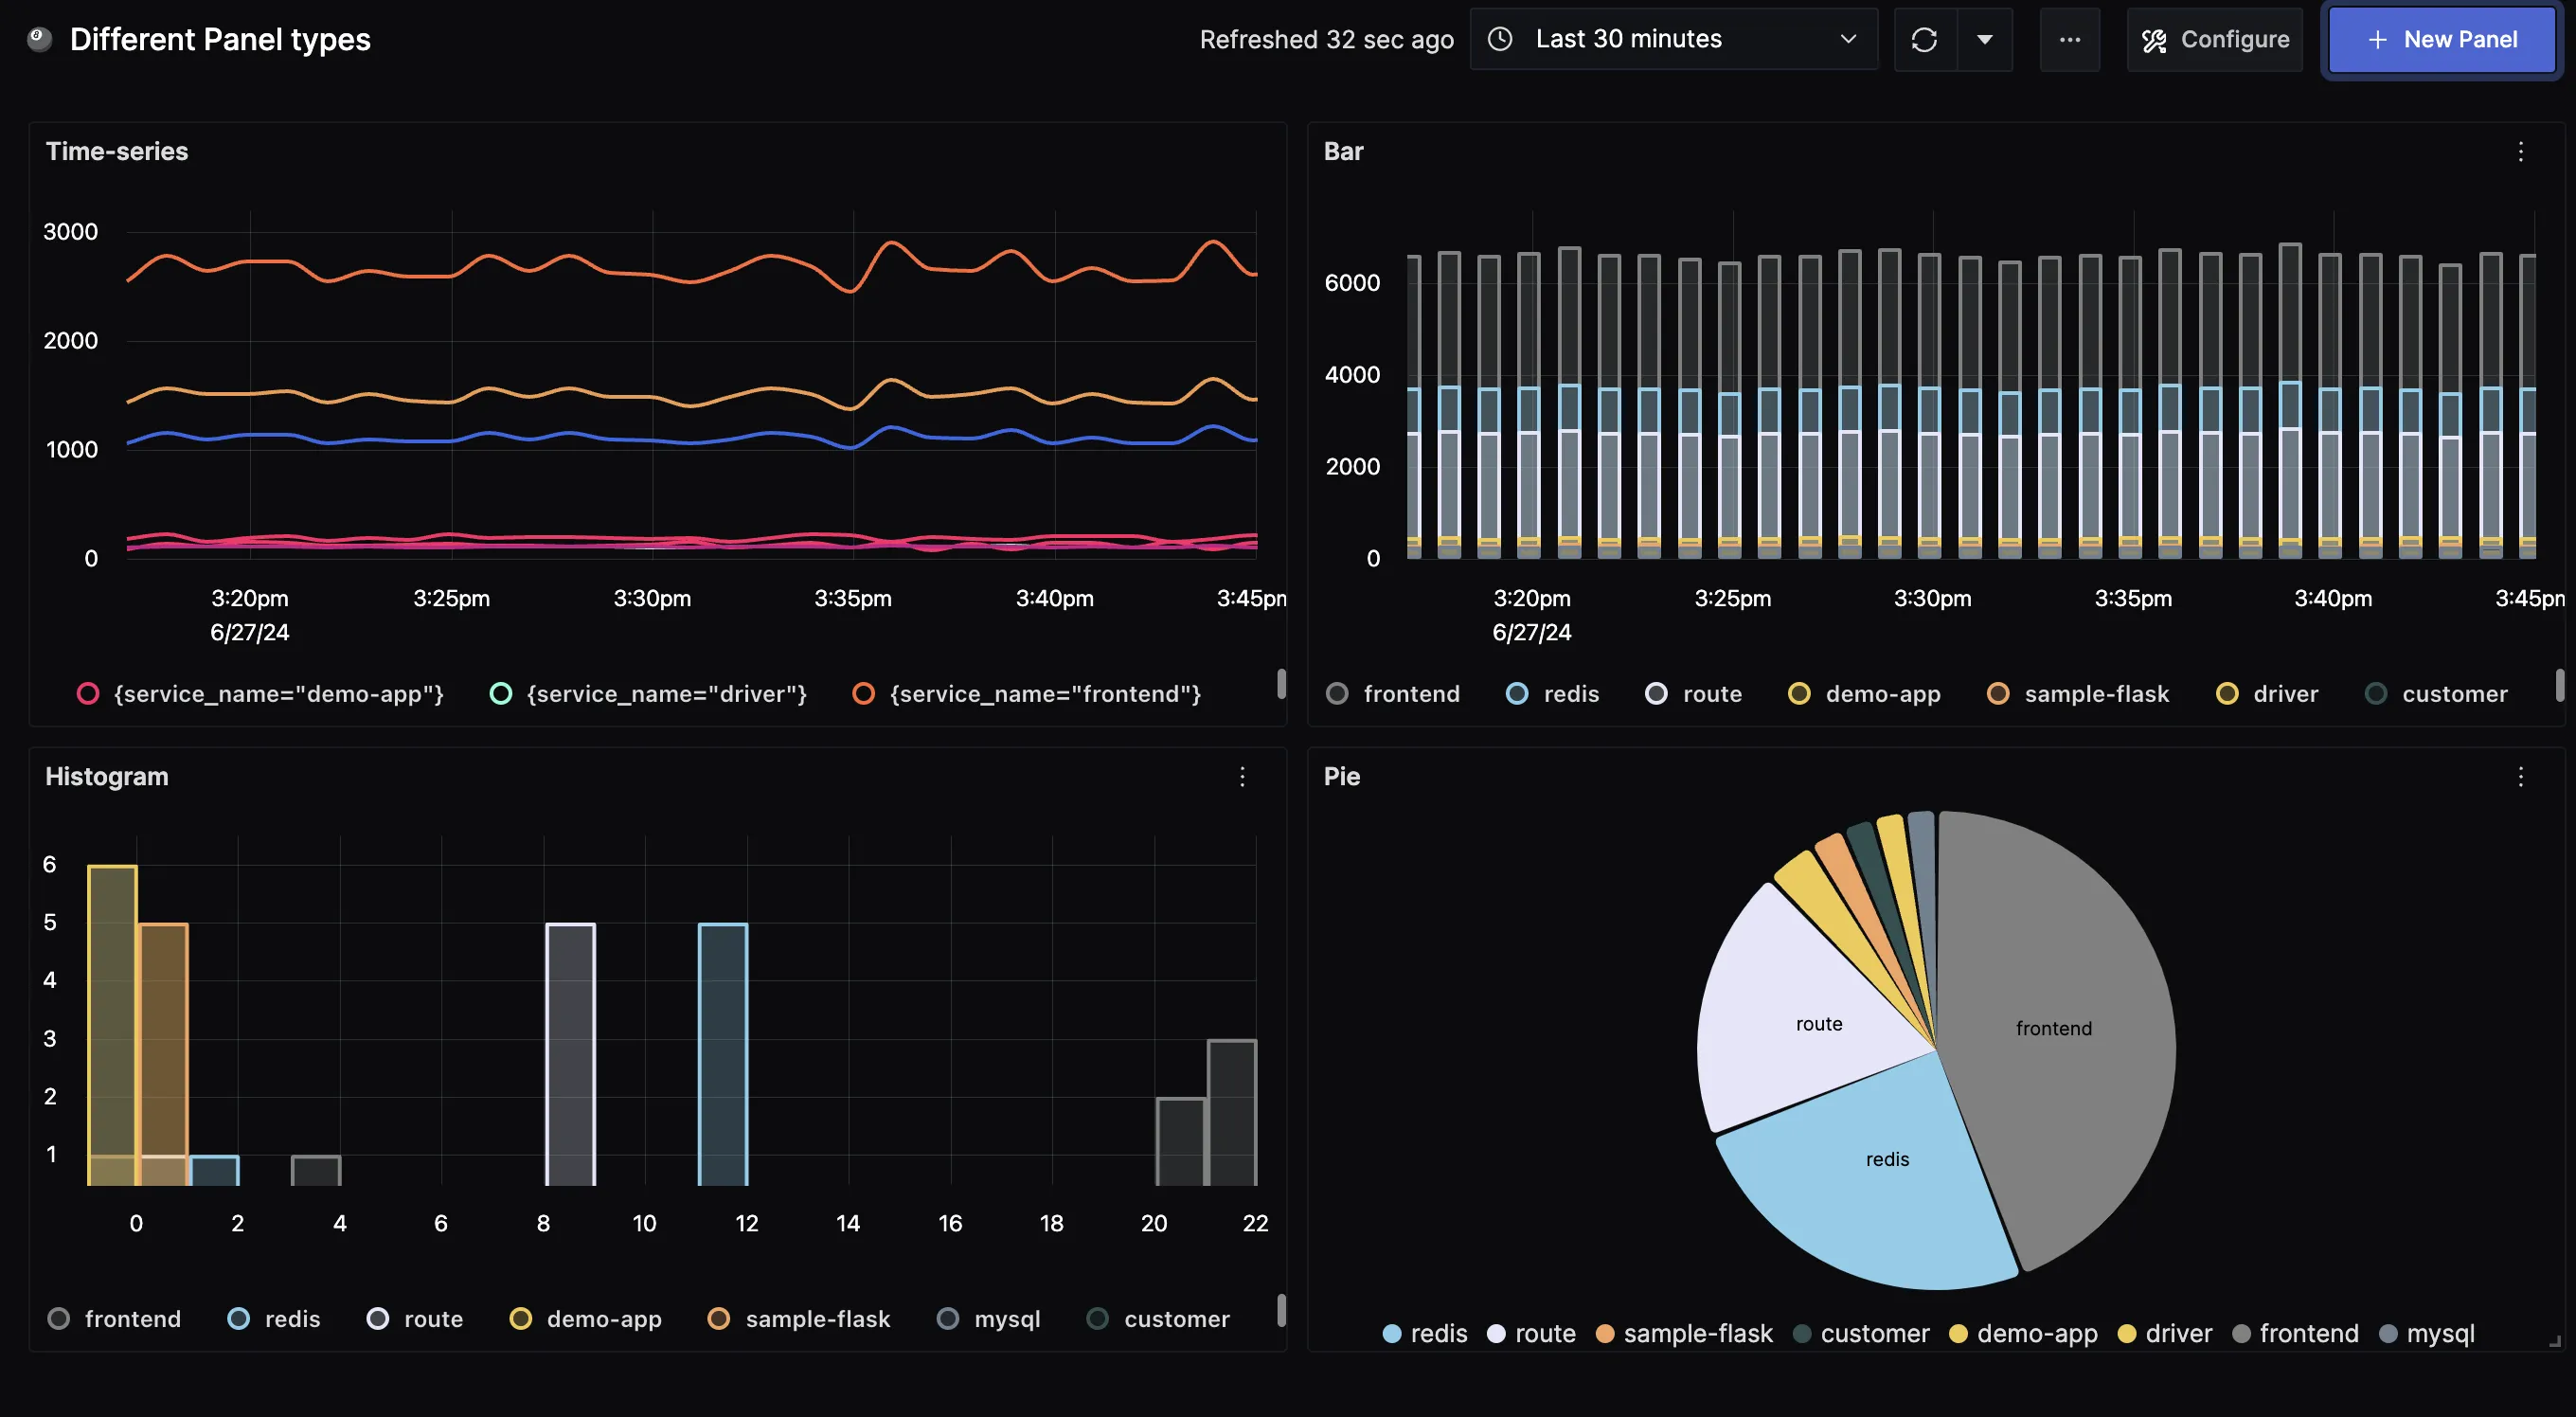
Create visualization that suits your needs and add them to a dashboard to create customized monitoring dashboards.
Customized Dashboards
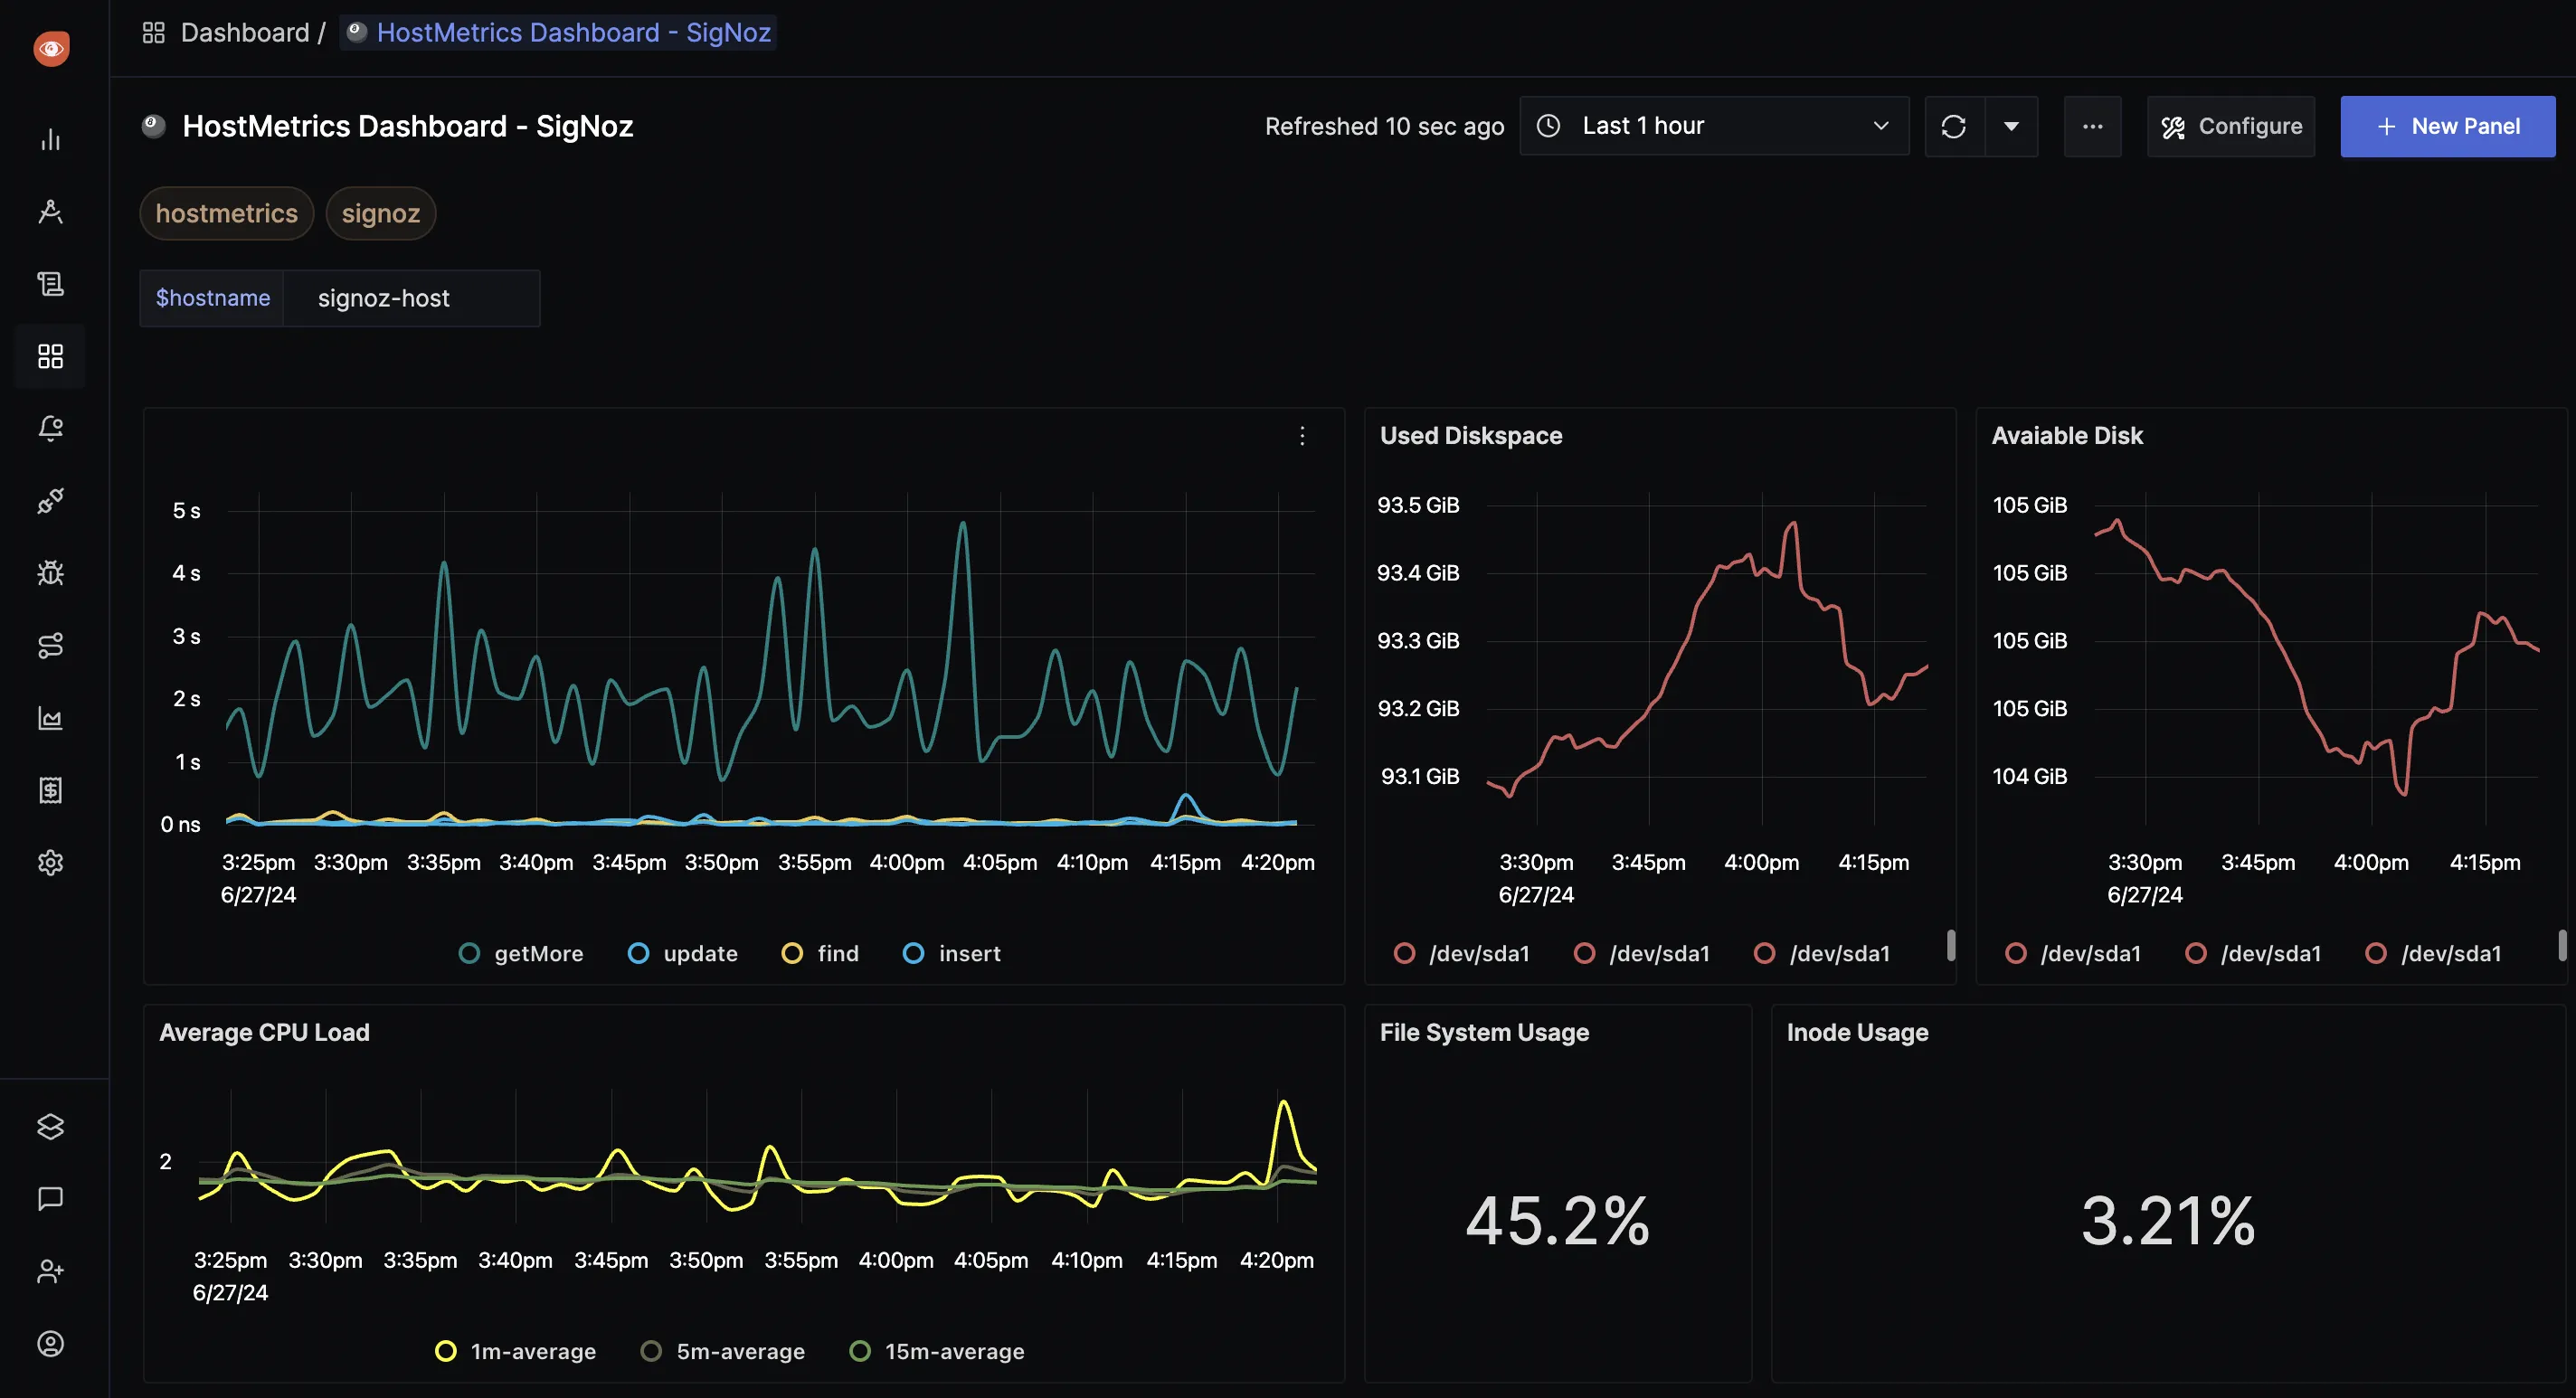
Enhance your observability with flexible dashboards. Add panels, divide them into sections, go full-screen, and lock them for security. Use variables to create interactive dashboards, filtering charts by hostnames, environments, namespaces, and more.
Advanced querying with ClickHouse Queries
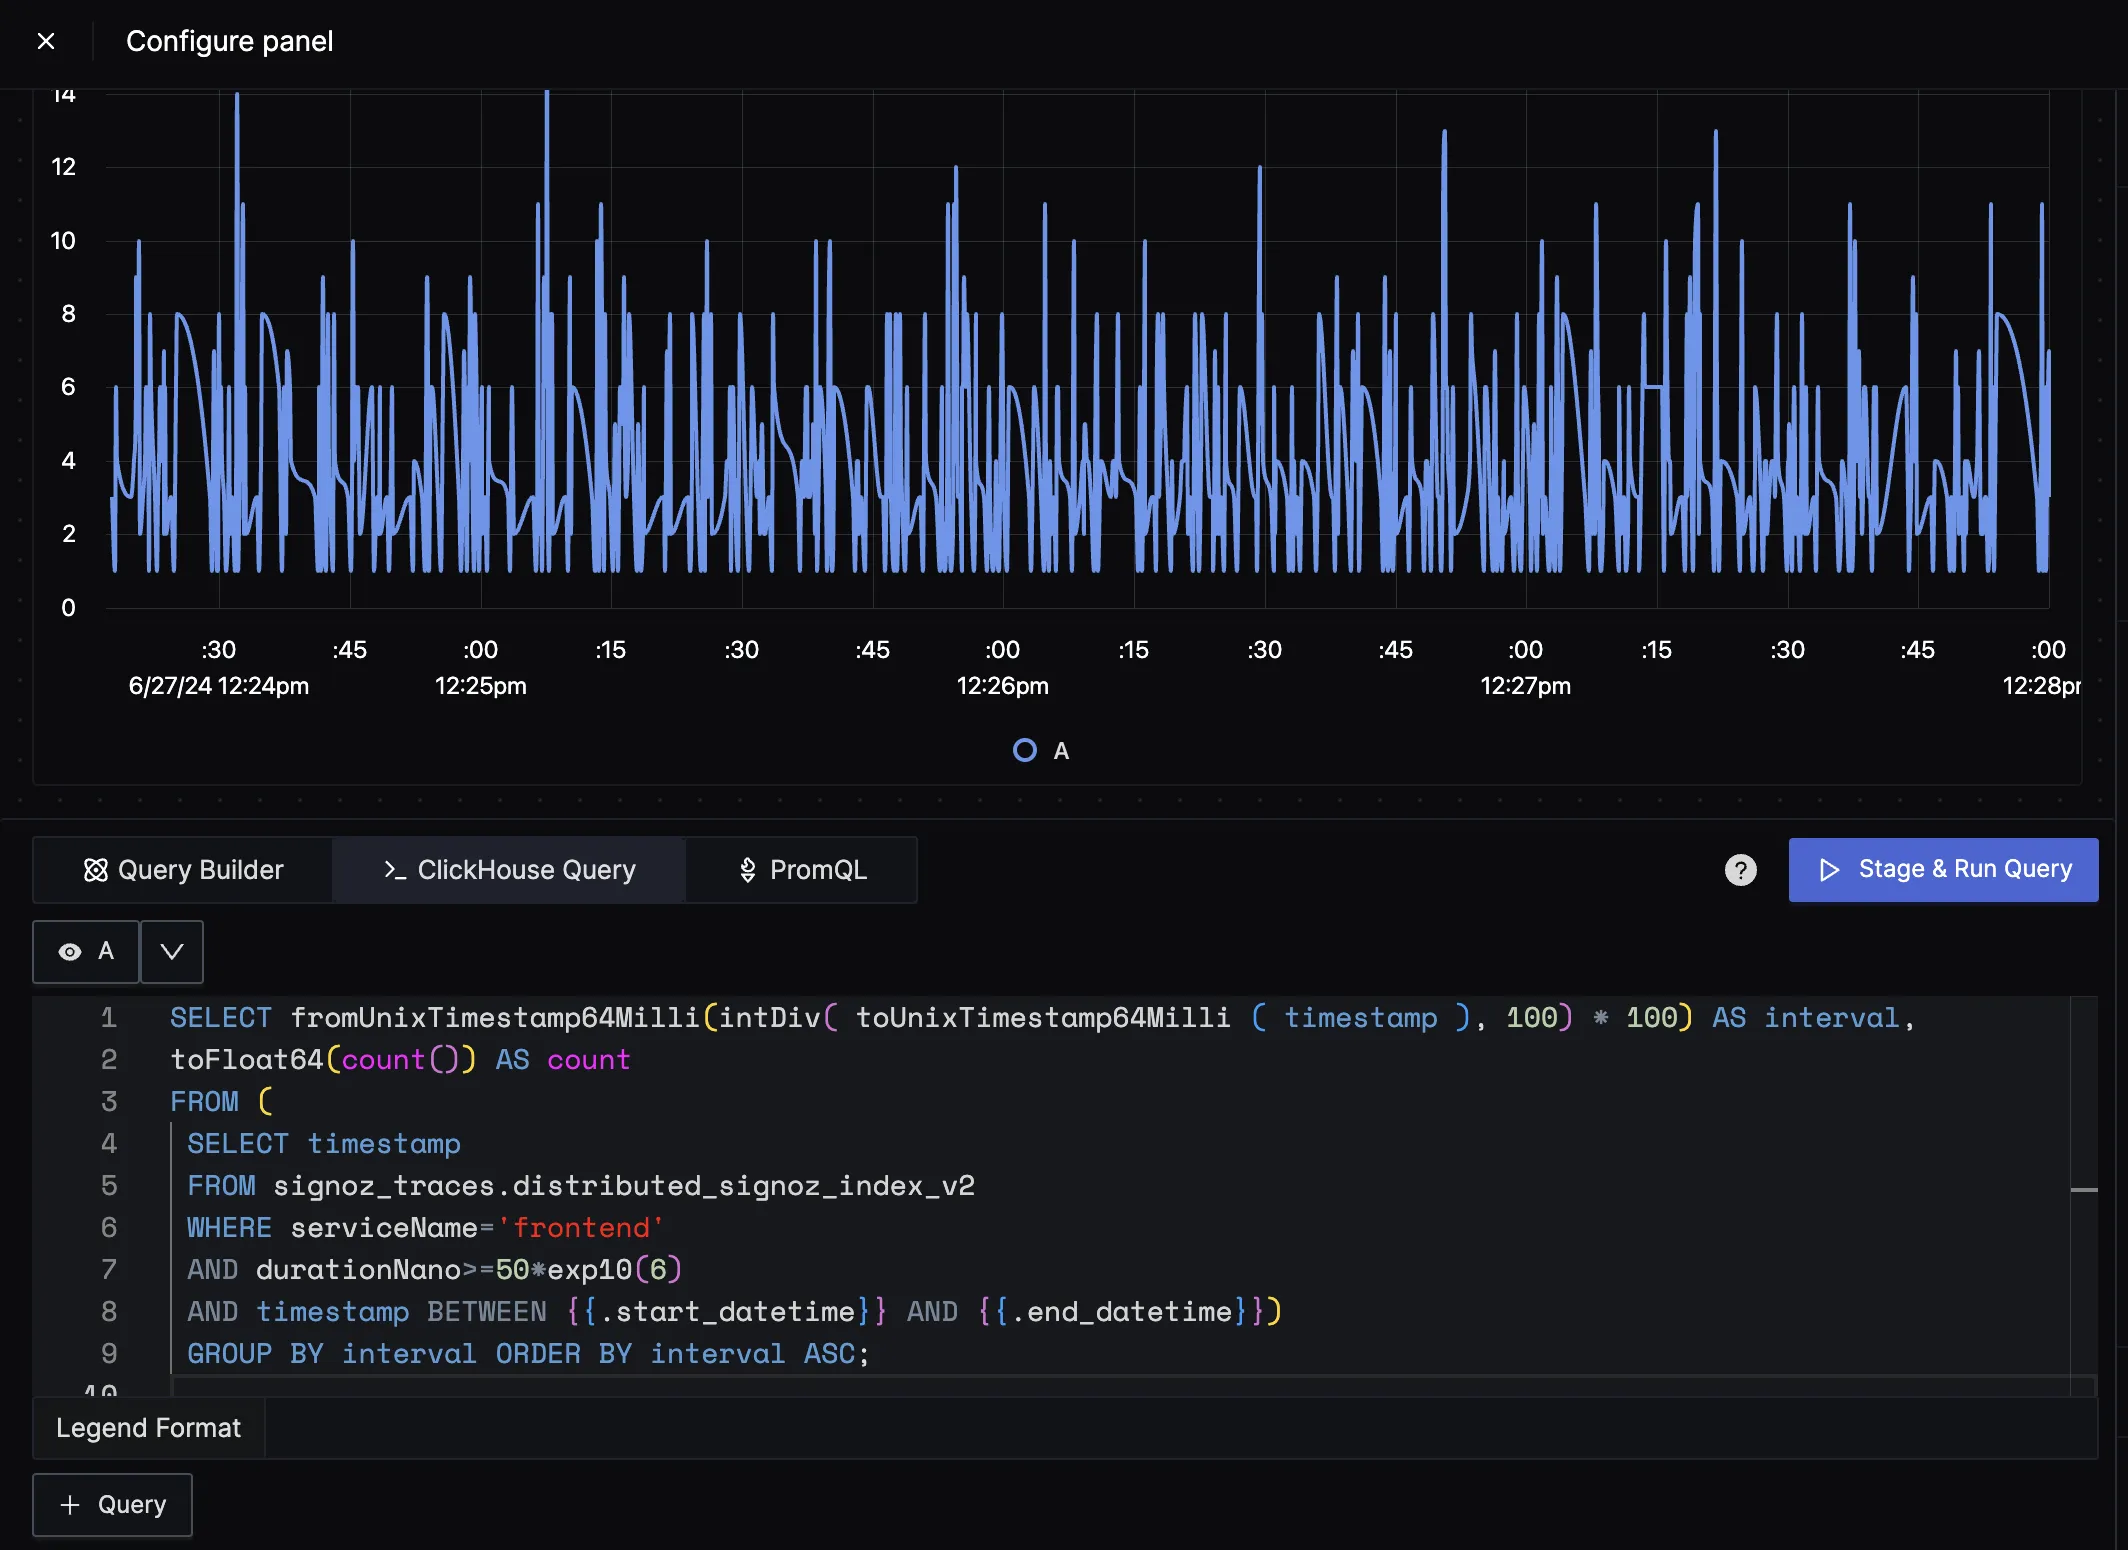
Your metrics data is stored in ClickHouse - and we give you the ability to write ClickHouse queries directly on your data. This enables in-depth analysis when you want to dig deeper into your data.
PromQL Support
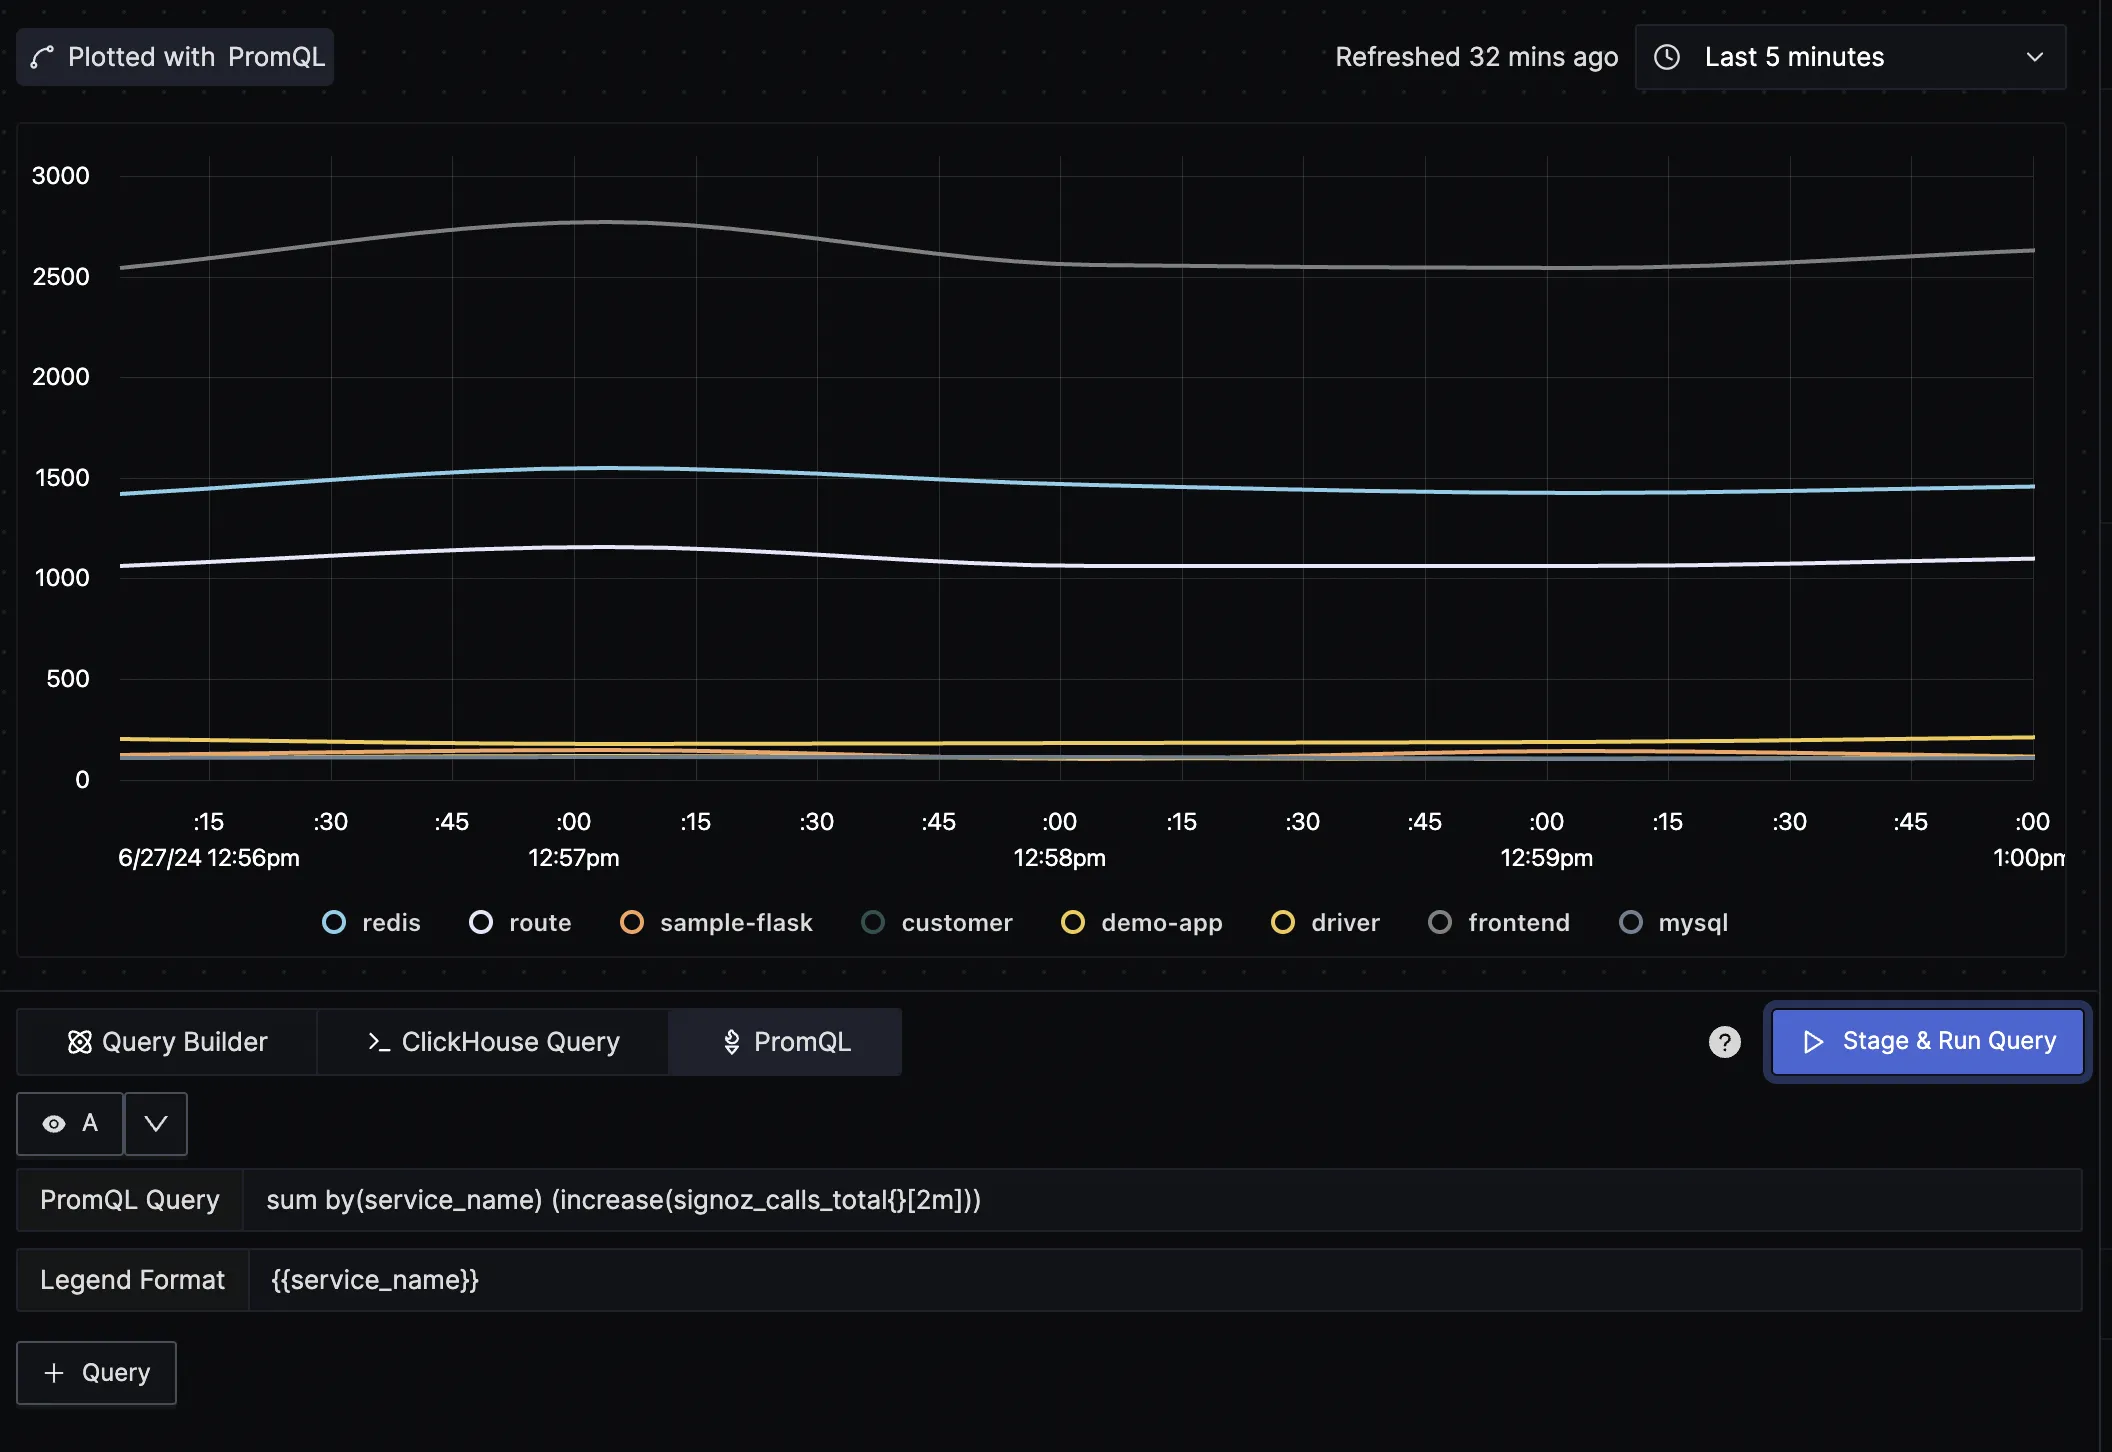
If you’re coming from the Prometheus ecosystem, don’t worry. We support PromQL for querying data and ingesting Prometheus metrics format.
Access to Metrics data through API
Accessing metrics data through our Metrics API allows you to manage and analyze it efficiently. This opens up many opportunities for integration with other tools, programmatic analysis of metrics data, and customized data handling.
No separate pricing for custom metrics
All metrics are treated the same in SigNoz and are not charged separately (unlike some other popular observability tools). Metrics pricing in SigNoz is very cost-effective and you can scale your metrics monitoring with peace of mind.
Simple
usage-based
pricing
Tired of Datadog’s unpredictable bills or New Relic’s user-based pricing?
We’re here for you.
Pay only for data you send
We don’t have any SKU-based pricing. Get access to all features in the plan selected and only pay for the data you send. Pay only $0.1 per million samples for metrics.
No special pricing for custom metrics
Vendors like Datadog charge $0.05 per custom metric, which limits a team’s ability to send and analyze custom metrics for monitoring. SigNoz does not treat custom metrics any differently. The charges remain $0.1 per million samples no matter what type of metrics you send.
Add unlimited team members
Observability should be available to every developer at your company. After all, anyone can need debugging. That’s why we don’t charge for user seats, and you can add as many team members as you want.
No Host (container or node) based pricing
For modern cloud-based applications it doesn’t make sense to charge on the basis of number of hosts or containers. You don’t need to worry about auto-scaling during peak hours. Only pay for the amount of data sent no matter the number of hosts.
Developers
Love
SigNoz

10 million+
OSS Downloads

22k+
GitHub Stars

140+
Contributors

4.5k+
Community Members
Get started with
SigNoz Cloud today

