Simple Usage-based Predictable Observability Costs

Teams

For fast-scaling teams that need observability to scale with them.

starts from
$199 $49/month
After $49, billed at:
Traces Icon
Traces
$0.30/GB
Logs Icon
Logs
$0.30/GB
Metrics Icon
Metrics
$0.10/mn samples

What's included in $49/month?

Enterprise

For larger orgs that need data residency, compliance and support.

Custom
starts at $4000/month

Choose between the following offerings

  • A dedicated environment on SigNoz cloud
  • Bring your own cloud(managed by SigNoz in your cloud)
  • Self-host with support contract

Enterprise benefits

  • Volume discounts & annual contracts
  • HIPAA, BAA agreement and other certifications
  • Dedicated Slack, email & in-product support
  • Guided migration support
  • Ongoing professional services
  • Team training
  • SLA w/ downtime developer pairing
🧮 Pricing Calculator

Calculate Your Exact Monthly Bill

Get an instant estimate based on your usage. No surprises, no hidden fees.

Estimate your monthly bill

You can also set data ingestion limits so you never get a surprise bill.Learn more

Pricing per unit
Retention
Scale of ingestion (per month)
Estimated usage
Subtotal
Traces IconTraces
$0.3/GB
0GB
100TB
GB
$0
Logs IconLogs
$0.3/GB
0GB
100TB
GB
$0
Metrics IconMetrics
$0.1/mn samples
0M
100B
mn
$0
Monthly estimate
$49
Choose When

Best suited for your needs when you

🛠️ Have DevOps expertise & want full control
☁️ Want zero operational overhead & quick setup
🏢 Want dedicated environments or bring-your-own-cloud

Ideal for

Solo developers & small startups
Teams scaling fast & growing companies
Orgs with compliance & security requirements
APM & Distributed Tracing

Out of Box APM metrics

Filtering and creating dashboards based on traces data

Creating alerts based on traces data

Unlimited dashboards & alerts based on traces

Advanced visualization for very large traces (>10K spans)

Third Party API Monitoring with error rates, latency tracking

Log Management

Parsing logs via pipeline

Create direct filters from JSON logs

Saved Views for logs

Live tail Logging

Unlimited dashboards & alerts based on logs

Long Term Log Storage Options

Infrastructure Monitoring

Out of the box dashboards for hostmetrics

Kubernetes Monitoring

Container Monitoring

Unlimited dashboards & alerts based on metrics

Cloud Monitoring

AWS monitoring (EC2, ECS, EKS, Lambda, RDS, ELB, VPC)

Azure monitoring (VM, App Service, Functions, AKS, Container Apps, SQL DB)

GCP monitoring (Compute Engine, GKE, Cloud Run, Cloud Functions, App Engine)

Cloud services metrics, logs, and traces correlation

CI/CD Observability

Pipeline health and performance monitoring

DORA metrics tracking and visualization

Repository health and PR metrics

Pipeline flakiness detection

Data Exploration

Metrics Explorer - search, query, and analyze all metrics with quick filters

Traces Explorer with multiple views (List, Trace, Time Series, Table)

Advanced Query Builder with filtering, aggregation, and mathematical functions

Exceptions Monitoring

Separate view of exceptions based on Trace data

Frontend & Mobile Monitoring

Web Vitals monitoring for frontend applications

Mobile app monitoring (iOS, Android, Flutter)

LLM Monitoring

LLM observability with OpenTelemetry

Integration with Langtrace and OpenLLMetry

Vector database monitoring with OpenLIT

Alerts Management

Create alerts directly from dashboards

Support for Slack, Pagerduty, OpsGenie & webhooks as alert channel

Anomaly Detection

Alert as Code

MS Teams as alert channel

Pre-built Integrations & Dashboards

Infrastructure & database dashboards (Kubernetes, Docker, PostgreSQL, MongoDB, Redis, MySQL)

Application performance & web service dashboards (APM, NGINX, Apache, RabbitMQ, LLM)

Single Click AWS Integrations

OTel-native Messaging Queue Monitoring

Producer Latency, Consumer Lag, Partition Latency Views

Correlation of Signals

APM metrics to traces

Traces to logs

Logs to traces

Logs to infrastructure metrics

Service Dependency Visualization

Overview of your application graph with health indication

Security & Compliance

SOC2 Type II Compliant

HIPAA Compliant

Data centers in US, EU, and India

BAA Agreement

ADD ON
Configuration

SSO support

SAML support

Support for Multiple Ingestion Keys

Support for Rate Limits based on Ingestion keys

Dashboard Locking & Access control

Access Data in SigNoz from Anywhere (via API keys)

Security tightening for on-premise installation

ENTERPRISE SELF-MANAGED

Monitor Health of SigNoz

ENTERPRISE SELF-MANAGED

Custom retention for different sources of logs

COMING SOON
COMING SOON

Finer RBAC with custom roles

COMING SOON

AWS Private link

ENTERPRISE CLOUD

Audit Logs

COMING SOON

Multi-tenancy

COMING SOON
Support

Community Support on Slack

Email Support

In product chat support

ENTERPRISE CLOUD

Support for Migrating DataDog Dashboards

for spends above $999

Dedicated Slack Channel

for spends above $999

Team Training

Dashboard Configuration Support

Instrumentation Support

SLA w/ downtime developer pairing

Trusted by the best platform teams
netapp logo
samsung logo
comcast logo
freo logo
hyperface logo
salesforce logo
rattle logo
brainfish logo
GoKiwi logo
outplay logo
tune logo
wombo logo

SigNoz for
Startups

Special Pricing

Get 50% off on SigNoz standard pricing with our Startup Program - just $19/month instead of $49/month.

Perfect for early-stage companies looking for enterprise-grade observability that won't burn your startup budget.

Eligibility Requirements

  • Less than 3 years old
  • Fewer than 30 employees
  • Raised less than $6 million
Startup Program

Complete
Observability
for
Every
Use Case

APM & Tracing

Auto-instrument any language with OpenTelemetry

Java
See all languages

Logs Management

Collect, parse, and analyze logs from any source

Java
See all log sources

Infrastructure Monitoring

Monitor hosts, containers, and orchestration platforms

See infrastructure docs

Cloud, Databases & Integrations

Pre-built integrations for cloud services, databases, and third-party tools

Azure
See all integrations

OpenTelemetry Native — SigNoz supports any language or framework that OpenTelemetry supports. From Rust to Elixir, from mobile apps to serverless functions - if it can emit OTLP data, SigNoz can monitor it.

Why
select
SigNoz?

Built for scale

Our powerful ingestion engine has a proven track record of handling 10TB+ data ingestion per day.

Trusted across the globe

Used by teams in all 5 continents ⎯ across the mountains, rivers, and the high seas.

Powering observability for teams of all sizes

Hundreds of companies ⎯from early-stage start-ups to public enterprises use SigNoz to build more reliable products.

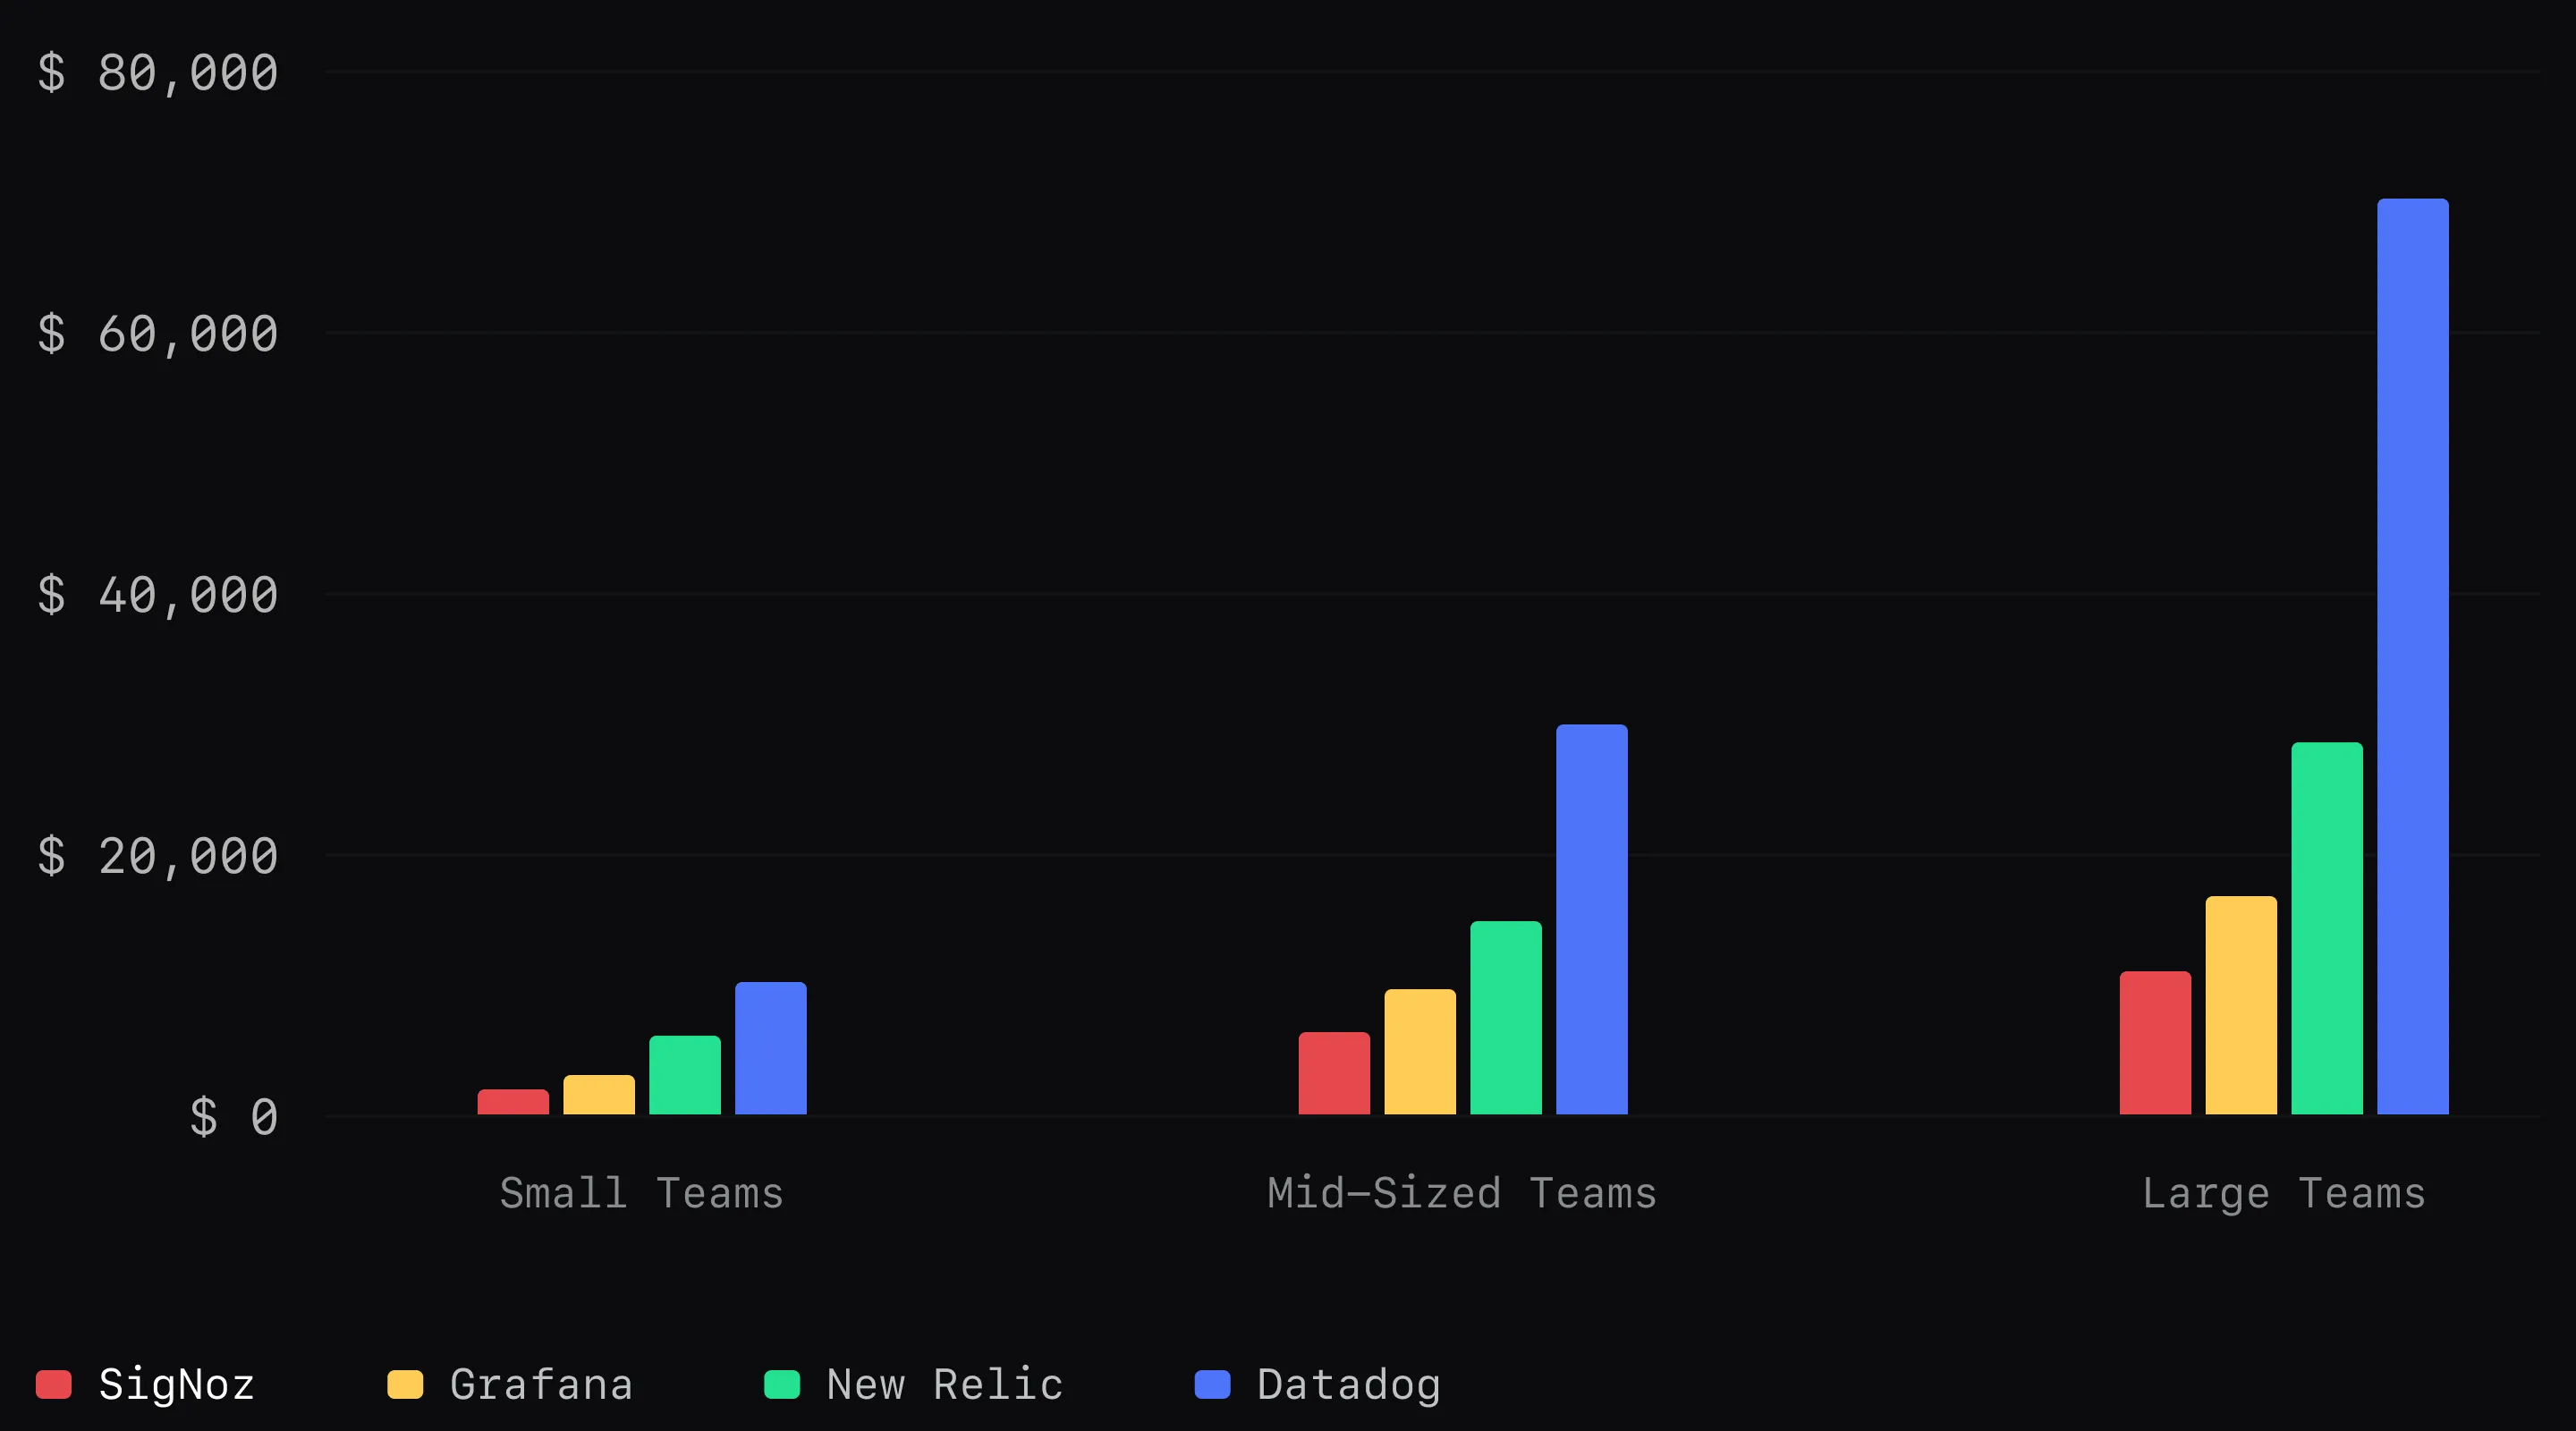
SigNoz provides up to 9X ROI than DataDog

You can also set data ingestion limits so you never get a surprise bill. Learn more

Worried about Data Protection Laws?

No need to send data outside your region. We have data centers in US, EU and India to comply with data privacy regulations. You can also host SigNoz in your own cloud.

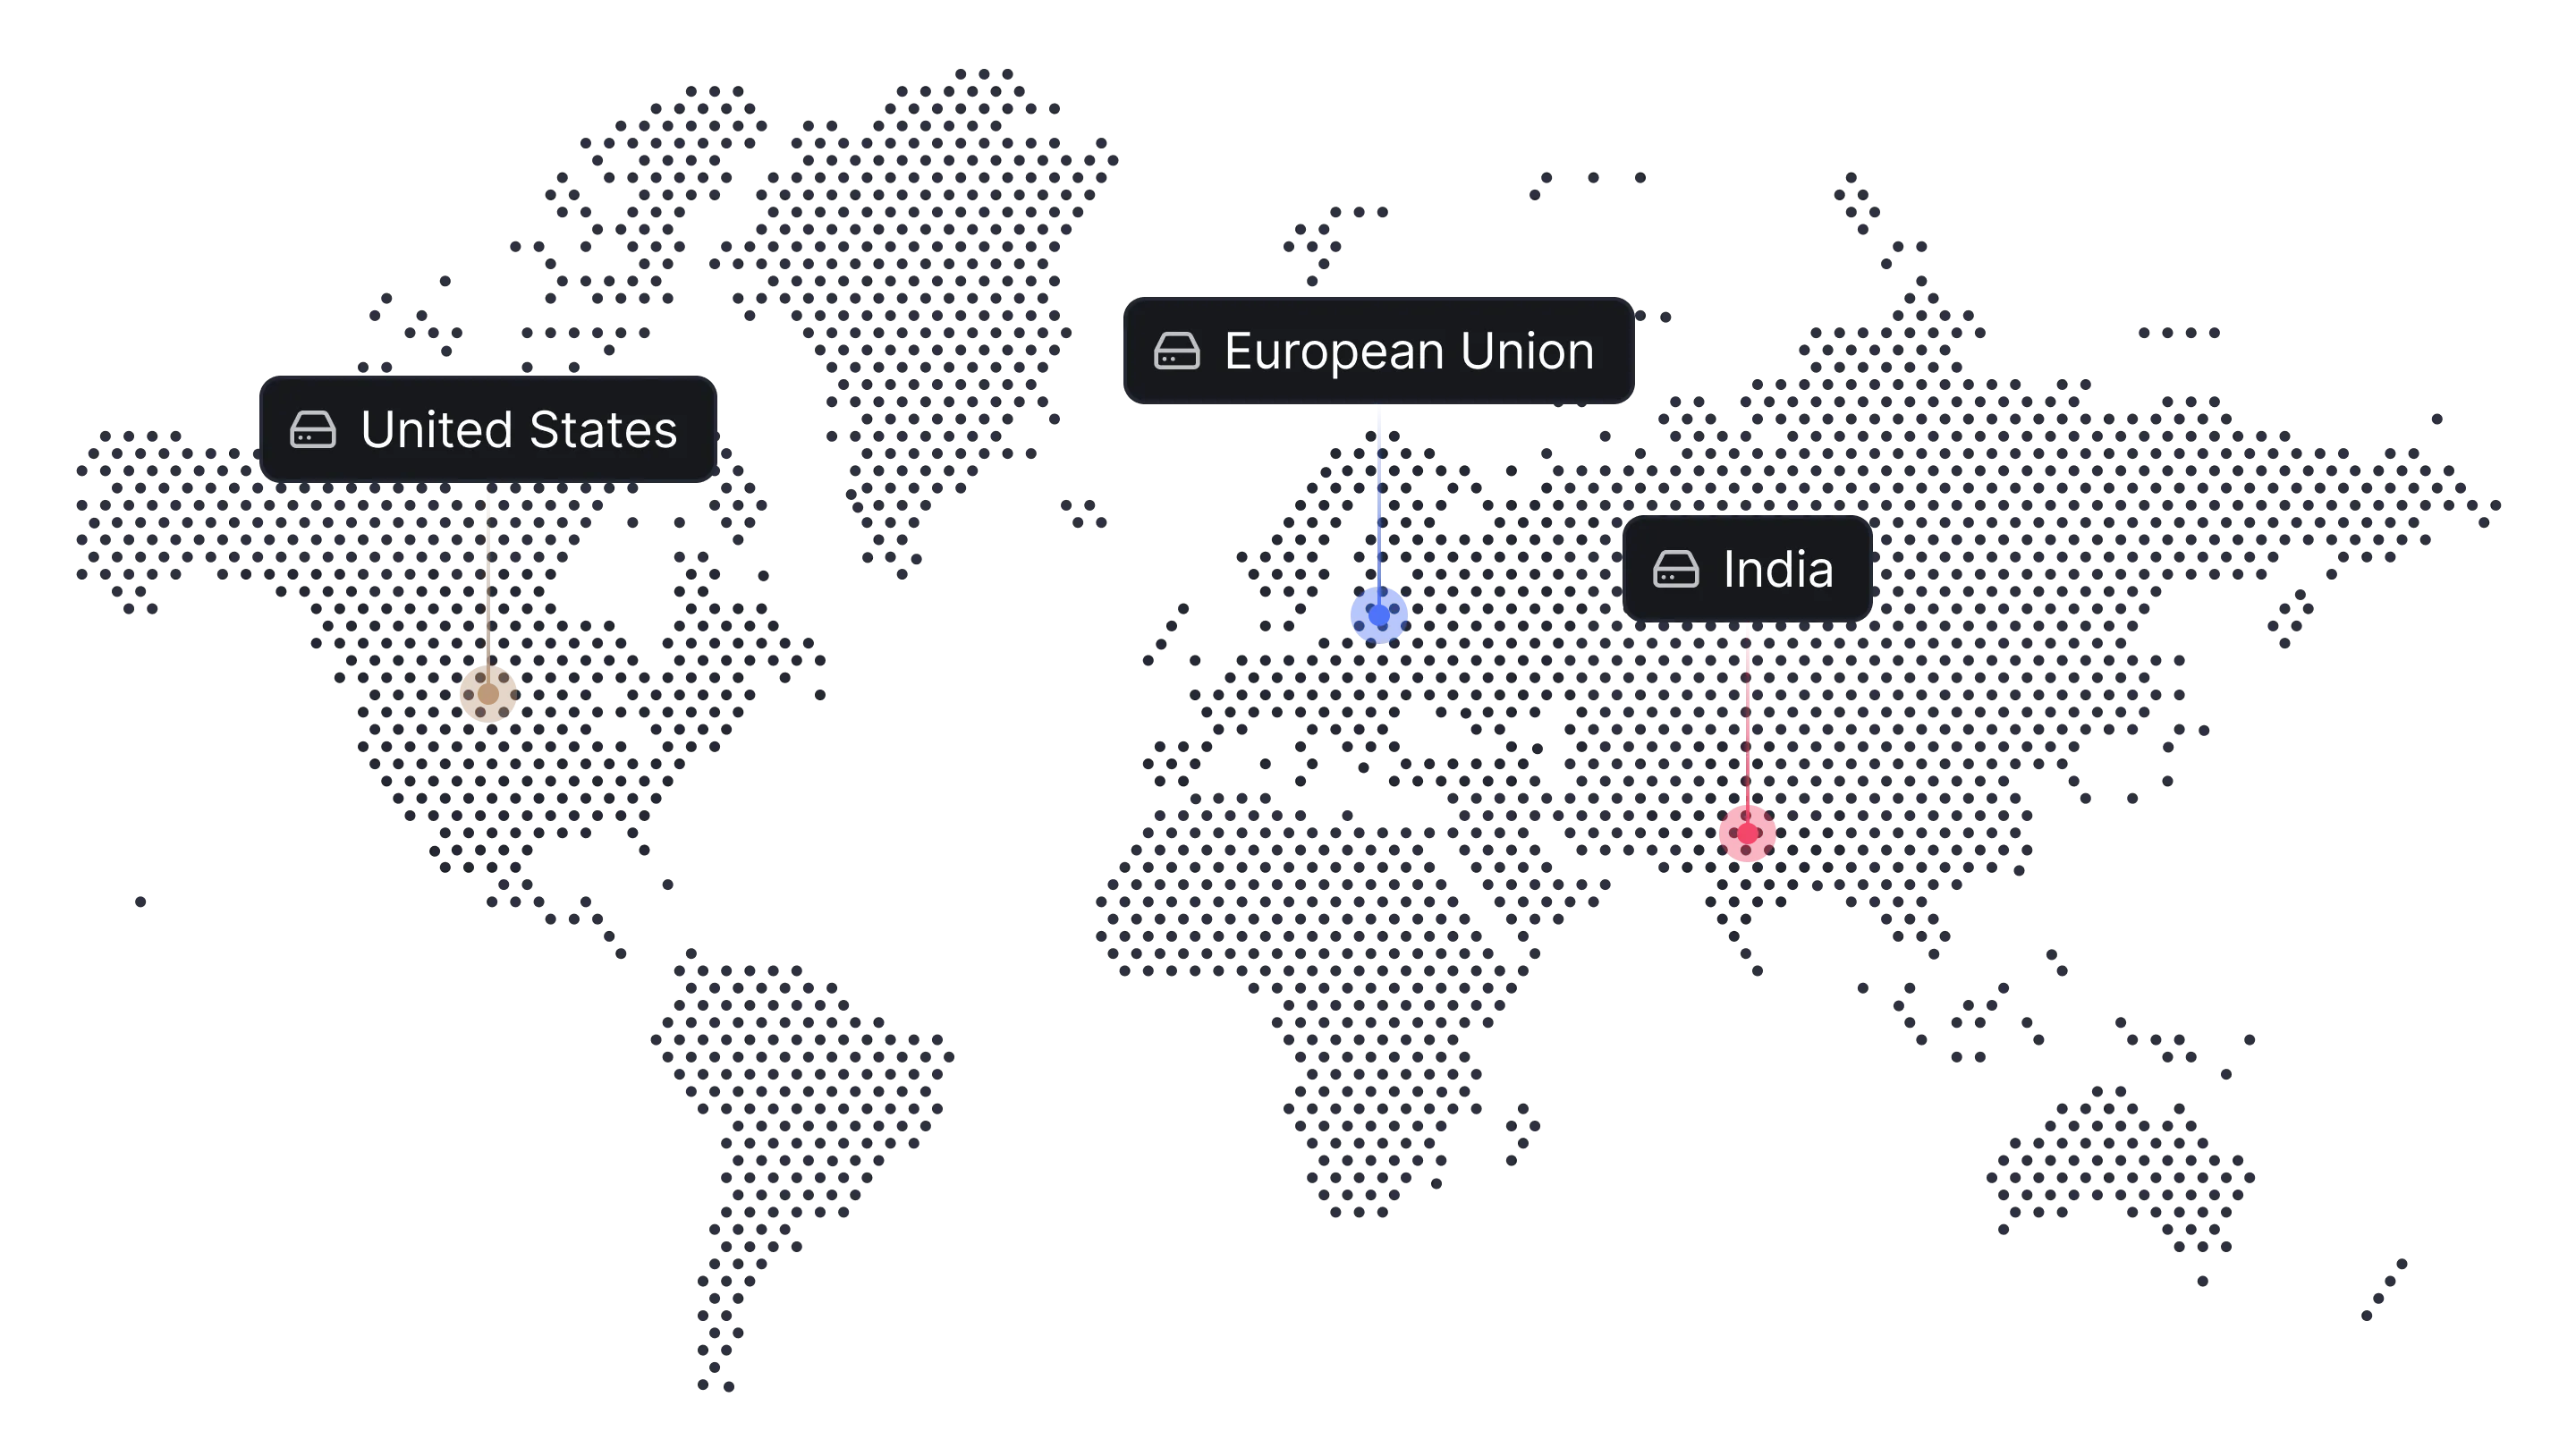
Enterprise-grade Observability

Get access to observability at any scale with advanced security and compliance.

  • SSO and SAML support
  • Query API Keys
  • Advanced Security
  • AWS Private Link
  • VPC Peering

Get started with Community Edition

You always have the open source version of SigNoz to get started with your observability journey.

Frequently
Asked
Questions

What is the difference between SigNoz Cloud(Teams) and Community Edition?
You can self-host and manage the community edition yourself. You should choose SigNoz Cloud if you don’t want to worry about managing the SigNoz cluster. There are some exclusive features like SSO & SAML support, which come with SigNoz cloud offering. Our team also offers support on the initial configuration of dashboards & alerts and advises on best practices for setting up your observability stack in the SigNoz cloud offering.
How are number of samples calculated for metrics pricing?
If a timeseries sends data every 30s, then it will generate 2 samples per min. So, if you have 10,000 time series sending data every 30s then you will be sending 20,000 samples per min to SigNoz. This will be around 864 mn samples per month and would cost 86.4 USD/month. Here's an explainer video on how metrics pricing is calculated - Link
Do you offer enterprise support plans?
Yes, feel free to reach out to us on hello@signoz.io if you need a dedicated support plan or paid support for setting up your initial SigNoz setup
Who should use Enterprise plans?
Teams which need enterprise support or features like SSO, Audit logs, etc. may find our enterprise plans valuable

SigNoz Cloud is the Fastest Way to Try Out SigNoz

1
Sign Up
2
Choose Data Source
3
Set Up & Visualize
SigNoz Dashboard